Performance of the r2SCAN functional in transition metal oxides
Abstract
We assess the accuracy and computational efficiency of the recently developed meta-generalized gradient approximation (metaGGA) functional, the restored regularized strongly constrained and appropriately normed (r2SCAN), in transition metal oxide (TMO) systems and compare its performance against SCAN. Specifically, we benchmark the r2SCAN-calculated oxidation enthalpies, lattice parameters, on-site magnetic moments, and band gaps of binary 3d TMOs against the SCAN-calculated and experimental values. Additionally, we evaluate the optimal Hubbard U correction required for each transition metal (TM) to improve the accuracy of the r2SCAN functional, based on experimental oxidation enthalpies, and verify the transferability of the U values by comparing against experimental properties on other TM-containing oxides. Notably, including the U-correction to r2SCAN increases the lattice parameters, on-site magnetic moments and band gaps of TMOs, apart from an improved description of the ground state electronic state in narrow band gap TMOs. The r2SCAN and r2SCAN+U calculated oxidation enthalpies follow the qualitative trends of SCAN and SCAN+U, with r2SCAN and r2SCAN+U predicting marginally larger lattice parameters, smaller magnetic moments, and lower band gaps compared to SCAN and SCAN+U, respectively. We observe that the overall computational time (i.e., for all ionic+electronic steps) required for r2SCAN(+U) to be lower than SCAN(+U). Thus, the r2SCAN(+U) framework can offer a reasonably accurate description of the ground state properties of TMOs with better computational efficiency than SCAN(+U).
1 Introduction
Density functional theory (DFT[1]) calculations are the bedrock of modern computational materials science in terms of predicting thermodynamic and kinetic properties, with such property predictions being put to use in subsequent materials discovery[2, 3, 4, 5, 6, 7] and understanding underlying physical phenomena.[8, 9, 10, 11, 12] In recent years, machine learning has been used to augment DFT in property predictions, thereby reducing computational cost and accelerating materials discovery.[13, 14, 15, 16, 17] Note that a key approximation within DFT is the exchange-correlation (XC) functional, the exact form of which is unknown. However, several approximations for the XC functional have been proposed over the years, which can be categorized into different classes depending on the degree of sophistication and accuracy, and visually represented as rungs on the Jacob’s ladder.[1, 2, 18, 19] As with most computational tools, the higher the accuracy (higher up Jacob’s ladder) higher is the computational cost.
Most DFT calculations for “large” solid systems (10s to 100s of atoms) are performed using the Perdew-Burke-Ernzerhof (PBE) parameterization of the generalized gradient approximation (GGA) XC functional,[20] as it offers fair accuracy at reasonable computational cost for a wide variety of materials.[21, 22, 23] Specifically, GGAs include the local electron density as well as the gradient of the electron density in describing the XC. As a semilocal functional of electron density, PBE captures short range interactions but fails to capture medium and long-range dispersions and also exhibits large electronic self-interaction errors (SIEs), especially in highly correlated systems.[24, 25] Also, PBE typically underestimates the formation energies[26, 27] and semiconductor band gaps of crystalline solids,[28, 26] while overestimating their lattice volumes.[26, 29]
As we move higher in the Jacob’s ladder,[19] we obtain metaGGA functionals, which may account for medium range dispersions and exhibit lower SIEs. Some metaGGAs consider orbital kinetic energy density in addition to the local electron density and its gradient, such as the recently developed strongly constrained and appropriately normed (SCAN[30]) functional, which offers better numerical accuracy than PBE and satisfies all 17 known constraints for a XC functional (namely, 6 for exchange, 6 for correlation, and 5 for both). The iso-orbital indicator (), which includes the kinetic energy density in SCAN, distinguishes various bonding environments in a given material and consequently improves the accuracy of SCAN over GGA. However, SCAN suffers from numerical instability during self-consistent-field (SCF) calculations[31] wherein denser -grids (than PBE) are required for accurate and consistent predictions.[32, 33, 31] Thus it is computationally expensive (per SCF step) compared to PBE.[21]
To overcome the numerical instability and reduce the computational cost of SCAN, Bartok and Yates[34] developed regularized SCAN (rSCAN), which satisfies 13 out of the 17 known constraints. The authors replaced the non-analytical switching interpolation function in SCAN with a simple polynomial function, which improves computational speed.[35] However, subsequent investigations showed a significant drop in numerical accuracy with rSCAN (compared to SCAN), which is attributed to the failure of the polynomial function to fully recover the uniform gas limit.[32, 31] Subsequently, Furness et al.[32] introduced the restored regularized SCAN (or r2SCAN), wherein the constraints broken by rSCAN were restored except the fourth order gradient expansion constraint for exchange (or GE4X). Furness et al. claimed that the new r2SCAN functional combines the numerical accuracy of SCAN and computational speed of rSCAN as the smooth polynomial function of rSCAN is modified to satisfy the uniform gas limit in r2SCAN.[32] Recently, Kingsbury et al.[36] demonstrated that r2SCAN functional indeed delivers robust numerical accuracy (i.e., similar to SCAN) and better computational performance (faster and numerically stable) by comparing r2SCAN and SCAN for solids using a high-throughput computational workflow. Specifically, the authors[36] reported that while r2SCAN predicts a smaller band gap (for most of the strongly-bound materials) and larger lattice volumes than SCAN, the mean atomization error with r2SCAN is 15-20% lower for most solids. However, the performance of r2SCAN in correlated electron systems, i.e., transition metal oxides (TMOs) containing open-shell d electrons, remains to be seen and forms the main focus of this work.
Despite the accuracy of SCAN, it still has shortcomings in TMOs, which can be mitigated by adding an on-site Hubbard U correction term for the transition metal (TM) under consideration.[37, 38] This approach is similar to the one followed to mitigate the SIEs of PBE in TMOs.[39, 40] However, the magnitude of the U correction required is not known a priori, and there are both theory-based approaches such as density functional perturbation theory,[41] linear response theory,[42, 43, 44] embedded Hartree-Fock method,[45, 46] and machine learning based Bayesian optimisation,[47] and experimental-data-based approaches to identify the appropriate U values. For example, Gautam et al.[37, 38] used the experimental oxidation enthalpies among binary TMOs to identify optimal U values across various oxidation states of 3d TMs. A similar experimental-data-based Hubbard U correction scheme can be developed in conjunction with r2SCAN as well, resulting in a r2SCAN+U framework, in case r2SCAN exhibits similar SIEs as SCAN in TMOs. We explore the usefulness of such a r2SCAN+U framework also in this work.
Here, we verify the numerical accuracy and computational efficiency of the r2SCAN and r2SCAN+U frameworks in comparison to SCAN and SCAN+U, respectively, in describing material properties such as lattice parameters, on-site magnetic moments, and band gaps of binary 3d TMOs, including Ti, V, Cr, Mn, Fe, Co, Ni, and Cu. As necessary, we evaluate the optimal Hubbard U correction with r2SCAN for each TM by using the experimental-data-based approach employed in previous works.[37, 38] We find that r2SCAN predicts marginally larger lattice constants and smaller on-site magnetic moments than SCAN for most of the TMOs considered. On addition of the U-correction to both SCAN and r2SCAN, we observe an increase in the calculated lattice constants, on-site magnetic moments and band gaps. In the case of narrow band gap TMOs, SCAN+U and r2SCAN+U generally estimate a non-zero band gap, with r2SCAN+U’s band gap in better agreement with experiments. Also, we perform transferability checks for the optimal U values derived in this work for each TM, by benchmarking various properties in oxides that were not used in obtaining the U values. Finally, we compare the computational performance of r2SCAN/r2SCAN+U relative to SCAN/SCAN+U to explore the accuracy-cost trade-off. We report that r2SCAN/r2SCAN+U is computationally less expensive than SCAN and SCAN+U, when all required ionic and electronic steps are taken into account for convergence during structure relaxations. We hope that our work will provide a foundational basis for further studies on understanding material behavior and computationally discovering new materials in the near future.
2 Methods
2.1 Computational Methods
We used the Vienna ab-initio simulation package (VASP 6.2.1)[48, 49, 50] for all the spin-polarized DFT calculations, where the frozen-core PBE-based projector augmented wave (PAW)[51] potentials employed were identical to previous work.[37, 38] The plane waves for each system were expanded up to a kinetic energy of 520 eV, with each structure converged until the total energy differences and atomic forces became <0.01 meV and < eV/Å, respectively. We adopted a -centered Monkhorst-Pack[52] grid with a density of 48 -points per Å for all systems. The conjugate gradient algorithm was used to relax the structures (i.e., cell shapes, volumes, and ionic positions), without preserving any underlying symmetry. An ‘accurate’ level of precision was maintained while projecting the wavefunctions in the reciprocal space. The Fermi surface of each system was integrated with a Gaussian smearing of partial occupancies, with a width of 0.05 eV. In terms of DFT+U calculations, we used the Dudarev framework[53] for adding a effective U correction on the orbitals of TM atoms. All U values used in SCAN+U calculations were taken from previous work (see Table S1 of the Supporting Information –SI).[37, 38] Since we used different computing systems to perform our structure relaxations for different systems, we normalized the computational time with the number of cores used in each calculation to compare the computational efficiency of the different XC functionals considered.
For calculating band gaps, GGA functionals typically use the Kohn Sham potential as a multiplicative term, which typically underestimates the band gap of solids even at the SCAN level.[54, 55] Here, we use the generalized Kohn Sham technique to determine the band gaps by calculating the density of states (DOS) for all systems considered. For each DOS calculation, we used the optimized structure and the initial charge density from a previous structure relaxation. Subsequently, we introduced a set of zero-weighted -points, corresponding to a density of 96 -points per Å, where the -points that were used for the structure relaxation retained their original weights (as determined by VASP). Finally, we performed a single-SCF calculation where the DOS was sampled between energies of -20 to 20 eV in steps of 0.005 eV.
2.2 Structures and magnetic configurations
We considered the binary oxides of each TM, i.e., Ti, V, Cr, Mn, Fe, Co, Ni, and Cu with different oxidation states, similar to previous studies.[37, 38] The main criteria in selection of these metal oxides are the availability of reliable thermodynamic data (i.e., formation energies[56, 57, 58]) and the experimentally-determined ground-state structures that are compiled in the inorganic crystal structure database (ICSD)[59] Note that the structures from the ICSD were the initial structures in all our DFT structure relaxations, including the systems used as transferability checks. In the case of Ni oxides, we chose NiO and LiNiO2 (similar to previous work,[38]), as reliable thermodynamic data is not available for higher-oxidation-state binary Ni oxides (e.g., Ni2O3 and NiO2). The TM in all oxides, except select Co and Ni compounds, was initialized in its high-spin configuration (e.g., high-spin configuration of Fe3+ consists of five unpaired electrons). A detailed description of all structures utilised in this work is provided in the SI, under the ’Crystal Structures’ section, with the magnetic configurations depicted in Figure S1.
The magnetic configuration of each TMO considered (see Figure S1) was initialized to its appropriate (in several cases, experimentally-known) ground state configuration during the structural relaxation. For example, we considered the ferromagnetic (FM) ground state configuration for CrO2 and VO2, given that CrO2 is metallic[60] and VO2 undergoes a metal-to-insulator transition (MIT) below 341 K.[61] The rocksalt (RS) TMOs, namely, VO, MnO, FeO, CoO, and NiO were initialized with their experimentally-known type-II antiferromagnetic (AFM) configuration.[62, 63, 64, 65, 66, 67] Each Ni’s spin in NiO was initialized with two unpaired electrons (i.e., its high-spin configuration). In CuO, we arranged the magnetic moments of Cu2+ antiferromagnetically along the Cu-O-Cu chains in the [10] direction.[68, 69]
We initialized -Mn2O3 (bixbyite structure) in a FM configuration as this configuration was found to be the most stable in previous work.[37] AFM configurations were utilized for rutile-MnO2,[70], and the other TM2O3 oxides, namely, V2O3, Fe2O3, Ti2O3, and Cr2O3. Note that V2O3 becomes AFM below its MIT temperature,[71, 72, 73] while Fe2O3 displays an AFM configuration with the magnetic moment of Fe alternating every two consecutive layers along the -axis.[74] Cr2O3 and Ti2O3 exhibit and magnetic configurations, respectively, on the TM centers along the -axis.[75, 76]
In case of spinels, we used different ferrimagnetic (FIM) configurations, as per experimental observations. For example, spinel-Fe3O4 contains both Fe3+ and Fe2+, with up-spin Fe3+ occupying tetrahedral sites and down-spin Fe3+ occupying half the octahedral sites. The remaining octahedral sites in Fe3O4 are occupied by up-spin Fe2+.[77, 78] In Co3O4, no-spin Co3+ occupies octahedral sites, while high-spin Co2+ (three unpaired electrons) occupies tetrahedral sites in an AFM configuration.[79, 80, 81] For Mn3O4, we adopted the ”FIM6” configuration, as this was found to be the ground state in previous work.[37] TiO2, CrO3, and V2O5 are diamagnetic, since they contain TMs with empty 3 orbitals. Similarly, Cu2O is diamagnetic owing to the completely-filled 3d orbitals of Cu.
2.3 Determining
We determined the required U value, with r2SCAN, for each binary TMO oxidation reaction (e.g., Ti Ti4+ in 2Ti2O3 + O 4TiO2) by comparing the experimental enthalpy (per mole of O2) with the calculated (r2SCAN+U) value that minimizes the error against the experimental value. Note that U = 0 eV in our data simply reflects a r2SCAN calculation. In order to obtain the experimental oxidation enthalpy, standard enthalpy of formation for all the considered TMOs were taken from the Wagman and/or Kubaschewski tables,[56, 57] thus ignoring the and entropic contributions, similar to previous works.[37, 38, 82] The overall optimal U value for each TM was obtained by taking the average of the required U for each of the available oxidation reactions. In the case of Ni oxides, oxidation of NiO to LiNiO2 by 2Li2O + 4NiO + O2 4LiNiO2 was considered as a proxy for the Ni Ni3+ oxidation reaction.[38]
3 Results
3.1 Oxidation energetics
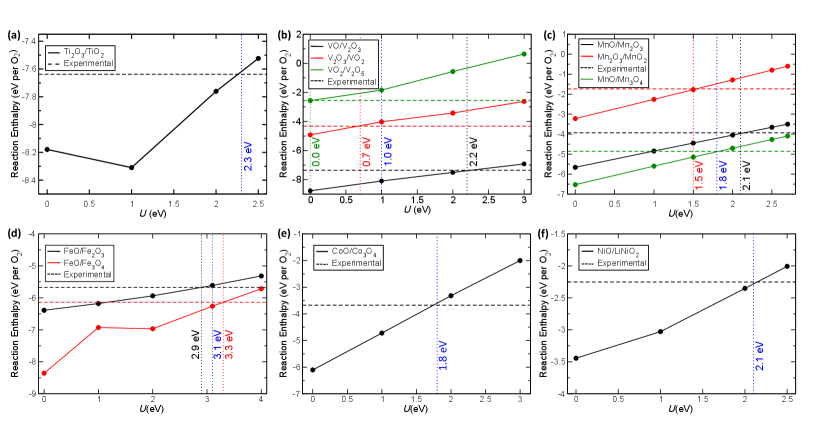
Figure 1 displays the variation of the enthalpy of different oxidation reactions among binary TMOs, as a function of applied U in the r2SCAN+U framework, for all TMs considered except Cr and Cu. Solid lines in each panel of Figure 1 represent DFT-calculated oxidation enthalpies, with each color corresponding to different oxidation reactions for the TM. For instance in V oxides (Figure 1b), the solid black line corresponds to the oxidation reaction, VO V2O3, while the solid red and green lines indicate V2O VO2 and VO V2O5, respectively. Similarly, the experimental enthalpy of each oxidation reaction is represented by dashed horizontal line of the same color. For example, the black dashed line in Figure 1b indicates the experimental oxidation enthalpy (-7.36 eV) of VO V2O3. Also, dotted vertical line of a given color highlights the required U value to minimize the error between DFT-calculated and experimental value for the oxidation reaction enthalpy indicated by the same color. The dotted blue line in each panel signifies the overall optimal U for the TM that is averaged across all available oxidation reactions.
We report an optimal U value of 2.3, 1.0, 1.8, 3.1, 1.8, and 2.1 eV, respectively, for Ti, V, Mn, Fe, Co, and Ni oxides, within the r2SCAN+U framework (Figure 1). Notably, the optimal U obtained with r2SCAN is less than that reported previously for SCAN functional (Table S1) for all 3d TMs considered (except V and Fe), which can be attributed to better accuracy of r2SCAN compared to SCAN, as observed in non-TMOs.[36] For V oxides, the required U value for VO2 V2O5, V2O3 VO2, VO V2O3 is 0.0, 0.7, and 2.2 eV, respectively. Thus, the optimal U value for V is 1.0 eV (average of the three required U values), which is identical to the U correction required with SCAN.[38] The decreasing required U with increasing oxidation state of V in V oxides is expected due to the decrease in the strength of exchange interactions among the d electrons as oxidation state increases. In the case of Fe, FeO Fe2O3 and FeO Fe3O4 reactions require a U of 2.9 and 3.3 eV, respectively, resulting in an optimal U of 3.1 eV, which is also identical to the optimal U with SCAN.[37] Moreover, we obtain the highest optimal U of 3.1 eV for Fe, among all TMs considered in this work, which is consistent with the fact that Fe3+ has the highest number of unpaired electrons resulting in the strongest exchange interactions.
For Ti and Ni, we observe a marginal improvement in the U-value for r2SCAN when compared to SCAN. Specifically, we obtain an optimal U of 2.3 eV and 2.1 eV for Ti and Ni, respectively, versus 2.5 eV for both elements with SCAN. We find an optimal U value of 1.8 eV for both Mn (2.7 eV with SCAN) and Co (3.0 eV with SCAN). In Mn-oxides, the required U for the oxidation of Mn2O MnO2, and MnO Mn2O3 are 1.5 and 2.1 eV, respectively. The optimal U for Mn is transferable to other Mn oxides as well, indicated by the robust agreement between r2SCAN+U-calculated and experimental oxidation enthalpy for MnO Mn3O4 (green lines in Figure 1c).
For Cr and Cu oxides, we obtain reasonable agreement with experimental data without a U correction (Figure S2), similar to our observation with SCAN.[38] In fact, for Cu, introducing U-correction worsens the error in the calculated oxidation enthalpy for Cu2O CuO versus experiment, similar to our observation with SCAN(+U) as well, which can be attributed to PAW potentials derived at the PBE-level.[38] However, the magnitude of error (versus experiment) is smaller with r2SCAN (13.1%) than with SCAN (25.7%). In case of Cr, the oxidation reaction of CrO CrO3 requires U 0.9 eV, but introducing a U correction worsens any agreement with experiment for Cr2O CrO2 (where required U = 0 eV). Thus, the optimal U for Cr oxides is 0.45 eV (<0.5 eV), which only provides a marginal improvement in describing oxidation enthalpies. Hence, we recommend using only r2SCAN for calculating any Cr oxide framework.
3.2 Lattice parameters
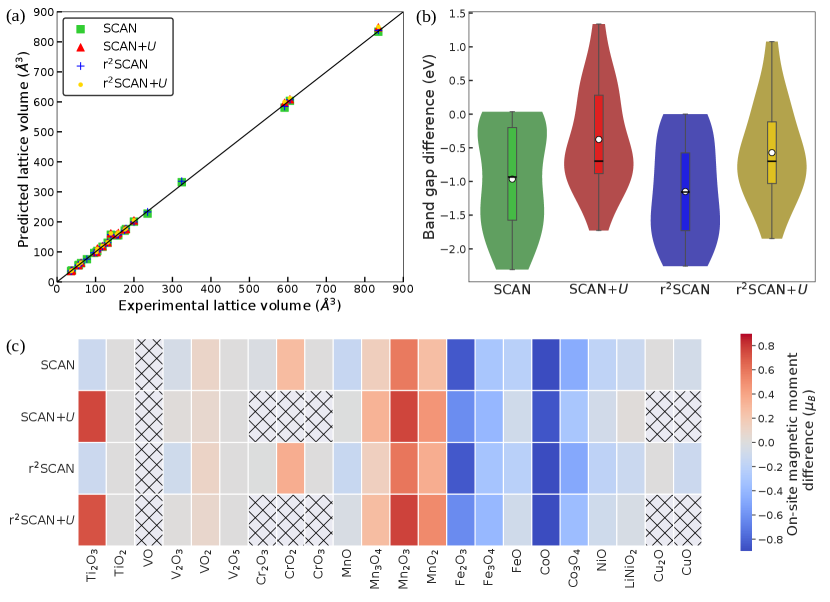
All r2SCAN(+U) and SCAN(+U) calculated lattice parameters, on-site magnetic moments, and band gaps for each TMO are tabulated in Table S2. Additionally, the calculated lattice volumes by the four XC functionals are plotted against experimental data in Figure 2a for all oxides. Generally, both SCAN (green squares in Figure 2a) and r2SCAN (blue symbols) offer 2.8% deviation from the experimental lattice parameters for all the TMOs considered, except VO, FeO, CuO, and LiNiO2, indicating robust agreement with experiments for both functionals. In VO, SCAN and r2SCAN overestimate (by 8%) the experimental lattice constants, while the deviation in FeO and CuO is 3-4% and 8-10%, respectively. In LiNiO2, SCAN’s angle evaluation is 4.1% different from experiment.
Notably, SCAN and r2SCAN do show qualitative differences in their calculated lattice parameters (when compared against experiments) across TMOs. For instance, both functionals overestimate the experimental lattice constants in TiO2, Ti2O3, and VO, while they underestimate in CrO2, CrO3, MnO2, and Fe3O4. There are also examples (MnO and Mn2O3) where SCAN underestimates the experimental lattice constants while r2SCAN overestimates. Overall, there are cases where SCAN’s errors in lattice parameter estimations are lower versus experiments (e.g., Cr2O3, CoO), r2SCAN’s errors are lower (e.g., CrO2, CrO3, MnO2, Fe3O4), and both functionals exhibit identical errors (e.g., TiO2, Co3O4, NiO, Cu2O), signifying that both functionals offer similar performance in terms of geometrical properties.
Comparing r2SCAN and SCAN, we find that r2SCAN’s lattice constants are generally larger than SCAN across TMOs (e.g., Ti2O3, Cr2O3, CrO3, VO2, etc.). As a range, r2SCAN estimates lattice constants that are a maximum of 1.5% larger than SCAN (in CrO3) and a minimum of 0.1% larger than SCAN (in Mn2O3). Having said that, there are instances where r2SCAN’s lattice constant evaluations are lower than SCAN (VO, CoO, CuO, and LiNiO2) and cases where both functionals are identical (TiO2, Co3O4, NiO, and Cu2O). In specific TMOs, SCAN and r2SCAN calculate an identical (individual) lattice constant, while the other lattice constants with r2SCAN are larger than SCAN. For example, and lattice constants with r2SCAN are higher than SCAN in V2O5 while both functionals estimate = 3.55 Å.
On introducing the optimal U correction, an increase in the value of calculated lattice constants is obtained for both SCAN and r2SCAN functionals for all TMOs. The lattice constants computed by r2SCAN+U (yellow symbols in Figure 2a) is up to 1.3% higher than r2SCAN, except FeO (4.2% higher). Similar to the comparison of r2SCAN vs. SCAN, there are systems where r2SCAN+U predicts larger, smaller, and identical lattice constants compared to SCAN+U (red triangles). For example, r2SCAN+U calculates larger lattice constants than SCAN+U in VO2, V2O5, MnO, Mn2O3 and Fe3O4 (maximum of 0.5% higher in V2O5), while for Ti2O3, CoO and NiO, r2SCAN+U’s estimations are smaller than SCAN+U (maximum deviation of 2.1% in Ti2O3). Both SCAN+U and r2SCAN+U functionals evaluate identical lattice parameters for TiO2, Co3O4 and LiNiO2.
Overall, lattice constants calculated by SCAN+U and r2SCAN+U deviate 3.3% from experiments for all TMOs, except VO and VO2 where deviations of 8.5% and 4.6% are observed, respectively. Adding U improves the agreement with experiment for both SCAN and r2SCAN in Co3O4, while r2SCAN+U gives the best estimate of the lattice parameters in FeO (% deviation vs. experiments) compared to SCAN, SCAN+U and r2SCAN. Notably, all functionals break the rocksalt symmetry of VO, MnO, and FeO, while the cubic symmetry of Fe3O4 is retained only by SCAN. In Ti2O3, the hexagonal symmetry is broken by SCAN but the symmetry is preserved by the other frameworks. In summary, we find that the differences in lattice parameter estimations to be minimal across the four functionals on average, with notable exceptions of a few systems.
3.3 On-site magnetic moments
On-site magnetic moments of the TMOs (Figure 2c and Table S2) computed by SCAN and r2SCAN generally underestimate experimental values, with the exception of MnO2, Mn2O3, CrO2, and VO2. Note that larger magnetic moments typically indicate stronger localization of d electrons. Comparing r2SCAN and SCAN calculations, we find that r2SCAN typically estimates smaller magnetic moments than SCAN but with several exceptions, such as MnO, MnO2, Mn2O3, Cr2O3, and VO2. Thus, on average, SCAN’s magnetic moment predictions are in better agreement with experiments. However, in terms of magnitude, moments predicted by r2SCAN deviate by 3% from SCAN’s estimates, except CuO ( 6.8% deviation), CrO2 (%), and MnO2 (%), highlighting that the differences in the predictions are marginal.
Adding optimal U to both SCAN and r2SCAN increases the magnitude of the calculated on-site magnetic moments for all TMOs (except VO2, which is predicted to be metallic by all functionals), consistent with the expectation that the U correction facilitates d electron localization. r2SCAN+U-calculated data are similar to the corresponding SCAN+U values (% variation), except LiNiO2 (6.3% variation), and Ti2O3 (3.8%). Similar to r2SCAN versus SCAN, r2SCAN+U estimates smaller magnetic moments than SCAN+U, with notable exceptions being VO2, Mn2O3, MnO2 and FeO. Overall, we observe the accuracy in calculated on-site magnetic moments versus experiments to follow the order SCAN+U r2SCAN+U SCAN r2SCAN for several TMOs. However, there are specific cases where specific XC frameworks offer better accuracy in calculating magnetic moments, such as SCAN in CrO2, Mn2O3, MnO2, Fe3O4 and CuO, r2SCAN in Mn3O4 and Cr2O3, and r2SCAN+U in V2O3. Given the numerically marginal deviations in calculated magnetic moments across the XC frameworks (10% deviation), we expect an increase/decrease in accuracy to be marginal amongst the XC frameworks considered.
3.4 Band gaps
The differences between calculated and experimental band gaps of all TMOs considered are visualized as violin plots for SCAN (green violin), SCAN+ (red), r2SCAN (blue), and r2SCAN+ in Figure 2b. The top and bottom ends of the individual violins mark the highest and lowest differences in the respective calculated data. Note that the mean values (white empty circles) are similar for SCAN and r2SCAN, and in turn are lower than their U-corrected versions. In other words, addition of the -correction reduces the error of calculated band gaps compared to experimental values, which is expected given that semi-local DFT typically underestimates band gaps. Also, we find that SCAN+ displays the lowest mean band gap difference among the XC functionals considered, indicating that on-average SCAN+ provides better computed band gaps.
We present calculated electronic DOS of select TMOs, namely CoO (panels a and b), V2O3 (c and d), and Mn2O3 (e and f), in Figure 3, to illustrate qualitative trends in computed band gaps. The DOS for the remaining TMOs, calculated by the four XC frameworks, are compiled in Figures S3-S19 of the SI. In each DOS panel, solid orange and solid green lines correspond to the 2p-states of O and the 3d-states of the TM, respectively. Dashed black lines represent Fermi levels in metallic compounds. Dotted vertical lines represent valence and conduction band edges in semiconducting/insulating compounds, with the band gaps indicated by the text annotation near the conduction band minimum (CBM). The zero of the energy scale is set to the valence band maximum (VBM) for TMOs with a band gap and to the Fermi level in metallic TMOs.
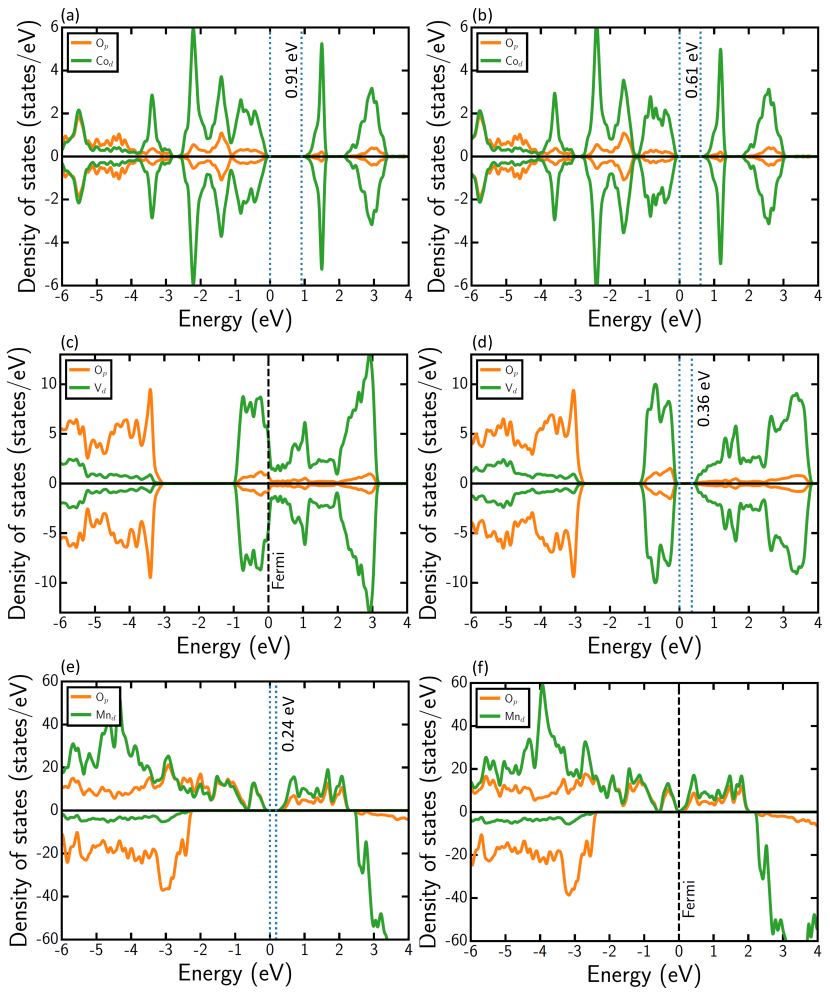
We observe that r2SCAN generally calculates a smaller band gap than SCAN for most TMOs (maximum of 66% lower in MnO2, see Table S2), as illustrated by the case of CoO in panels a and b of Figure 3. Notable exceptions do exist to this observation, such as V2O5 (1.7% larger), CrO3 (3.2%), MnO (4.3%), and Fe2O3 (1.7%), where r2SCAN calculated band gaps are marginally larger than SCAN. Both SCAN and r2SCAN incorrectly describe the ground state electronic configuration of narrow band gap TMOs (i.e., experimental band gaps eV), including Ti2O3 (Figure S4), V2O3(Figure 3c and S3c), VO2 (Figure S7) and Fe3O4 (Figure S15) to be metallic, with the exception of MnO2 where both SCAN and r2SCAN estimate a narrow gap (Figures S12a and S12c). Additionally, both functionals also calculate the wrong electronic structure in the case of a non-narrow-gap semiconductor, Mn2O3 (Figure S3), which exhibits an experimental gap of 1.2-1.3 eV.[83, 84] However, SCAN and r2SCAN qualitatively describe the right electronic structure in the case of wide band gap TMOs such as FeO (Figure S13), Fe2O3 (Figure S14), and NiO (Figure S17), with a significant quantitative underestimation of the experimental gaps. In any case, the differences in electronic structure predictions between SCAN and r2SCAN in TMOs are minimal, with SCAN being marginally better in accuracy.
Introducing a U correction to SCAN and r2SCAN widens or opens the band gap, especially in narrow band gap TMOs, as illustrated by the case of V2O3 (panels c and d in Figure 3). The opening of band gap with U correction is expected since localization of d electrons, which form the VBM and/or CBM in 3d-TMOs, is faciliated with U addition, in turn resulting in a larger gap. However, in the case of VO2 (Figure S7), adding U does not capture the MIT that occurs at low temperatures ( K[61]) with either SCAN or r2SCAN, causing the erroneous prediction of metallic behavior. Generally, SCAN+U calculates a larger band gap than r2SCAN+U (Table S2), as highlighted by the case of Mn2O3 (panels e and f in Figure 3). In fact, SCAN+U is the only framework (among those considered) to estimate a band gap in Mn2O3, which is consistent with experiment. Moreover, SCAN+U’s evaluations of larger band gaps results in better (poorer) quantitative agreement with experiments in wide (narrow) gap materials, such as MnO and FeO (V2O3 and MnO2).
Note that SCAN+U and r2SCAN+U do underestimate the experimental band gaps, similar to SCAN and r2SCAN, in wide gap TMOs. The only exception to this observation is CoO, where SCAN+U overestimates the band gap versus experiment (Figure S3a and Table S2), as also observed in our previous work.[38] In select TMOs, including Fe2O3 and V2O5, r2SCAN+U’s band gap is larger than SCAN+U, but the magnitude of difference ( eV) is meagre. Thus, for electronic structure predictions, we expect SCAN+U to provide the best qualitative and quantitative band gaps across TMOs, among the functionals considered here, especially for wide gap semiconductors/insulators. However, the qualitative trends provided by r2SCAN+U are quite robust as well and in small gap semiconductors ( eV gap), r2SCAN+U’s quantitative accuracy is often better than SCAN+U.
3.5 Transferability checks
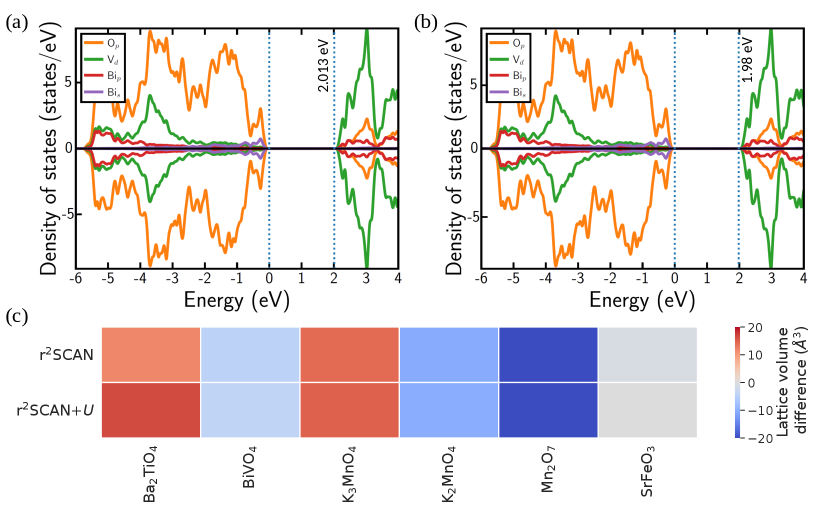
To examine the transferability of the optimal U values determined in this work (with r2SCAN), to oxide systems not used for obtaining the values, we perform checks on systems with different oxidation state and/or coordination environment for each TM. We compare calculated values against available experimental data, such as structural, electronic, magnetic, and/or electrochemical properties. Specifically, we choose Ba2TiO4 as a check for Ti, BiVO4 for V, K3MnO4, K2MnO4, and Mn2O7 for Mn, SrFeO3 for Fe, LiCoO2-CoO2 for Co, and LiNiO2-NiO2 for Ni. Data related to transferability checks are compiled in Figure 4, Table 1, and Table S3.
In the case of Ba2TiO4, we compare the calculated lattice parameters with experimental values (see Table S3 and lattice voliume differences plotted in Figure 4). Ba2TiO4 crystallizes in a monoclinic structure (space group P21/n) at low temperatures, where the unit cell is composed of four formula units.[85, 86] Ti atoms are present in distorted tetrahedra composed of neighbouring oxygen atoms (TiO4) within the Ba2TiO4 lattice, which is different from the octahedral environments sampled in TiO2 and Ti2O3. Upon structure relaxation, we observe that both r22SCAN and r22SCAN+U functionals marginally overestimate (by 2%) experimental lattice parameters (Figure 4 and Table S3). Similar to trends observed in Table S2, adding U to r2SCAN increases the calculated lattice parameters in Ba2TiO4 (by 0.03 Å), thereby marginally reducing the agreement with experiment.
We benchmark both structural and electronic properties of BiVO4 as a transferability check for V-based systems. Note that BiVO4 transforms from tetragonal (I41/a) to a monoclinic (I2/b) ‘scheelite’ phase below 528 K,[87, 88] which is a reversible second order ferroelastic transition driven by soft optical phonon modes. The BiVO4 unit cell possesses four formula units, with tetrahedrally coordinated V ions, which is different from the coordination environments of V in VO, V2O3, VO2, and V2O5. Importantly, monoclinic-BiVO4 spontaneously transforms to the tetragonal structure upon structure relaxation with r22SCAN and r22SCAN+U, similar to the observation by Liu et al [87] with GGA and hybrid functionals. Thus, neither r22SCAN nor r22SCAN+U predict the correct ground state structure. Additionally, BiVO4 possess a band gap of 2.4–2.48 eV[89] and is a candidate photocatalyst.[87] Both r22SCAN and r2SCAN+U provide similar band gap predictions (2.01-1.98 eV), which is in good qualitative agreement with experiment. Surprisingly, r2SCAN+U evaluates a marginally lower band gap than r2SCAN (see panels a and b in Figure 4). However, both r22SCAN and r2SCAN+U predict similar states occupying the valence band (Op) and conduction band (Vd) edges.
The rationale behind the choice of K3MnO4, K2MnO4, and Mn2O7 as checks for Mn-based systems is to explore the higher, unsampled oxidation states of Mn, namely +5, +6, and +7 in K3MnO4, K2MnO4, and Mn2O7, respectively. Also, Mn resides in tetrahedral coordination in these compounds, which is different from the octahedral coordination observed in MnO, Mn2O3, and MnO2. Although Mn2+ resides in tetrahedral sites in spinel-Mn3O4, we had not used in the spinel structure to obtain our optimal U. We benchmark the calculated lattice parameters versus experiments for all Mn-based transferability checks.
Mn2O7 is a volatile liquid at 298 K and solidifies to a monoclinic crystal structure (P21/c) below 279 K, with the unit cell consisting of 8 formula units of corner sharing tetrahedral MnO4 pairs.[90, 91] Upon structural relaxation, both r2SCAN and r2SCAN+U underestimate the lattice constants of monoclinic-Mn2O7 by 1-3% (Figure 4 and Table S3). In the case of K3MnO4, the tetragonal symmetry (I2m)[92] is broken with r2SCAN functional resulting in an orthorhombic structure, while the symmetry is preserved by r2SCAN+U (see Figure 4 and Table S3). Nonetheless, both r2SCAN and r2SCAN+U significantly underestimate the parameter (by 13.5%) and overestimate the or parameter ( 10.2%). K2MnO4 is an orthorhombic crystal (Pnma) with four formula units per unit cell.[93] Here, r2SCAN and r2SCAN+U predict identical lattice parameters, which marginally underestimate experimental values (by 0.4-1%, see Figure 4 and Table S3).
The choice of SrFeO3, a cubic perovskite, as a check for Fe is largely motivated by the 4+ oxidation state exhibited by Fe in the structure, which is not sampled in FeO, Fe2O3, or Fe3O4. Both r2SCAN and r2SCAN+U preserve the cubic symmetry during structure relaxation, with r2SCAN+U’s lattice parameters identical to experiments and r2SCAN’s parameters being a slight underestimation ( 0.5%, see Figure 4 and Table S3). In terms of magnetic configuration of Fe in SrFeO3, Takeda et al.[94] reported a helical spin structure via their neutron diffraction experiments, with competing FM and AFM interactions. However, Shein et al.[95] found a FM metallic state to be the ground state of SrFeO3, over a wide range of pressures, based on their first principles calculations, which they attributed to stronger FM than AFM interactions. We considered a FM configuration of Fe atoms in the SrFeO3 unit cell, and the on-site magnetic moments on Fe calculated by both r2SCAN (3.375 , Table 1) and r2SCAN+U (3.819 ) overestimate the experimental value (2.70.4 [94]). However, our calculated magnetic moments do indicate a localization of 4 electrons on the orbitals of Fe, consistent with its +4 oxidation state.
We choose CoO2 (Rm or ‘O3‘ polymorph[96]), and NiO2 (P1m1 or ‘O1’[97]), both layered structures, as transferability checks for Co and Ni, respectively, owing to the unsampled 4+ oxidation states of each TM. In terms of experimental property to benchmark, we choose the average Li intercalation voltage in these structures, i.e., LiCoO2-CoO2, and LiNiO2-NiO2 pairs, since they have been measured with high precision. The reader is referred to previous works on calculating and benchmarking average ‘topotactic’ intercalation voltages.[98, 99] r2SCAN underestimates the experimental average voltage[96, 100, 101, 102, 103, 99] in LiNiO2-NiO2 (by 8%), while it overestimates the average voltage in LiCoO2-CoO2 (by 1.7%), similar to trends observed with SCAN.[99] The addition of U to r2SCAN leads to an improvement in agreement with the experimental voltage in the Ni-system (deviation of 1.8%), while it worsens the agreement in the Co-system (deviation of 4.4%). Nevertheless, r2SCAN+U does overestimate the average voltage in both Co and Ni systems, similar to the behavior of SCAN+U.[99]
| Composition | Source | Voltage | Magnetic moment |
|---|---|---|---|
| (space group) | (V) | () | |
| LiCoO2-CoO2 | Expt. | 4.05 | - |
| (Rm) | r2SCAN | 4.12 | - |
| r2SCAN+U | 4.23 | - | |
| LiNiO2-NiO2 | Expt. | 3.85 | - |
| (P1m1) | r2SCAN | 3.54 | - |
| r2SCAN+U | 3.92 | - | |
| SrFeO3 | Expt. | - | 2.70.4 |
| (Pmm) | r2SCAN | - | 3.375 |
| r2SCAN+U | - | 3.819 |
4 Discussion
In this work, we evaluated the performance of the r2SCAN functional among binary TMOs consisting of 3d-TMs by calculating the oxidation enthalpies, lattice parameters, on-site magnetic moments, and band gaps. Additionally, for each TM-O2 system considered, we calculated the optimal Hubbard-U corrections to be used in a r2SCAN+U framework, based on experimental oxidation enthalpies. Although theoretical approaches exist to derive U values,[45, 46, 42, 44, 43, 41, 47] using oxidation enthalpies nominally gives an “average” correction that is suitable across several oxidation states of a given TM. Specifically, our optimal U values are 2.3, 1.0, 1.8, 3.1, 1.8, and 2.1 eV for Ti, V, Mn, Fe, Co, and Ni, respectively, while we don’t deem a U correction necessary for Cr and Cu oxides. Interestingly, the optimal U corrections needed with r2SCAN are lower in magnitude compared to SCAN for Ti, Mn, Co, and Ni oxides (while the corrections are identical for V and Fe oxides), indicating that r2SCAN exhibits lower errors with oxidation enthalpies and possibly lower SIEs than SCAN. However, this is not reflected in other physical properties. On an average, we find the accuracy, versus experimental values, to be similar for r2SCAN compared to SCAN, and for r2SCAN+U compared to SCAN+U, respectively, in lattice parameter, on-site magnetic moment, and band gap evaluations as seen in Figure 2.
The general trends in lattice parameter, magnetic moment, and band gap predictions, across the XC frameworks considered, can be summarized as follows. We observe that r2SCAN generates larger lattice constants than SCAN and on addition of the U correction to both functionals, the lattice constants further increase. Thus, in systems where SCAN underestimates experimental lattice constants (e.g., CrO2, CrO3, MnO2), shifting to r2SCAN improves agreement (e.g., error in r2SCAN in CrO3 is 0.8% versus 2.3% with SCAN). Also, there are instances where the ground state symmetry of the TMO is not preserved by some or all of the XC frameworks considered (i.e., in VO, MnO, FeO, Fe3O4, and Ti2O3), highlighting systematic issues in the XC treatment across the four frameworks considered. The calculated on-site magnetic moments by r2SCAN (and r2SCAN+U) are marginally lower than SCAN (SCAN+U), with the U correction nominally increasing the calculated moments calculated by r2SCAN and SCAN. However, calculated magnetic moments across the four XC frameworks differ by % (except LiNiO2), signifying marginal differences in accuracy. Both SCAN and r2SCAN underestimate band gaps across all TMOs (except MnO2), with band gaps calculated by r2SCAN typically being lower than SCAN, and adding the U opens/widens the gap. Thus, SCAN+U offers the best quantitative accuracy versus experimental band gaps, especially for wide gap semiconductors. Note that the qualitative trends from r2SCAN+U are consistent with the trends exhibited by SCAN+U and should be reliable in electronic structure predictions in other TM-based oxide systems.
r2SCAN adopts the smooth polynomial interpolation function of rSCAN to maintain numerical stability during SCF calculations. Additionally, the reformed gradient expansion for correlation introduced in r2SCAN (partially) negates the error introduced to the slowly varying density by the non-vanishing interpolation function,[32] which largely accounts for the observed variation in accuracy of r2SCAN versus SCAN. Based on our data, we observe that r2SCAN is not systematically more accurate than SCAN across all TMOs and for all property predictions. For example, we have lower optimal U values indicating lower SIEs with r2SCAN versus SCAN, but also lower on-site magnetic moments (except Mn and Cr oxides) signifying poorer d-electron localization with r2SCAN. Further, the smaller band gaps with r2SCAN (versus SCAN) may be caused by the residual SIEs, resulting in an underestimation of the CBM across TMOs. Hence, usage of r2SCAN(+U) in TM-based systems must be done with care and efforts should be made to benchmark as many available experimental properties as possible before performing “true” computational predictions.
We considered the transferability of the U values estimated in this work, with r2SCAN, by examining systems for each TM with oxidation states and/or coordination environments not sampled while calculating the optimal U. In general, we find that r2SCAN or its Hubbard U corrected version estimate similar lattice parameters and hence yield similar accuracies on structural properties. Analogously, the calculated on-site magnetic moments in SrFeO3 and the band gaps in BiVO4 are similar between r2SCAN and r2SCAN+U. In case of electrochemical properties, we do find tangible variations in the calculated average voltages of r2SCAN and r2SCAN+U, with r2SCAN+U exhibiting overall lower errors across the Co and Ni systems. Thus, we find the optimal U values obtained in this work to be transferable across oxide frameworks not sampled a priori. Nevertheless, more benchmarking studies to compare the performance of r2SCAN+U with r2SCAN (and experiments) will help in quantifying the reliability and errors associated with using r2SCAN+U.
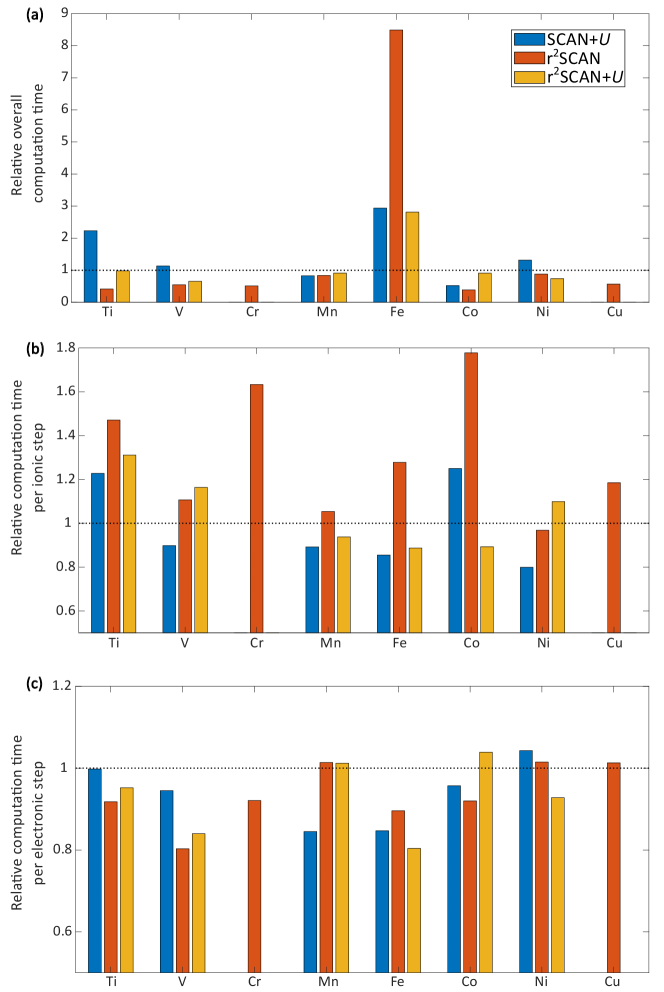
Given that r2SCAN(+U) is not systematically more or less accurate than SCAN(+U), the computational performance and numerical stability of r2SCAN(+U) is critical in determining its utility in property predictions across materials. Thus, we have quantified the computational time of r2SCAN(+U) and SCAN+U relative to SCAN for each TM-O2 system considered in Figure S1. Specifically, panels a, b, and c of Figure 5 plot the overall (electronic+ionic steps), per ionic step, and per electronic step computational time, respectively, taken by the SCAN+U (blue bars), r2SCAN (red), and r2SCAN+U (yellow) frameworks, relative to the computational time taken by the SCAN functional (dotted black lines), for each TM-based set of oxides. Details on calculating the computational times used by the functionals is described in the ‘Computational time’ section of the SI. Note that our objective is not to provide a rigorous quantification of computational resources required for each XC framework, but to provide a qualitative understanding of the relative computational costs across the frameworks considered.
For each electronic step, r2SCAN(+U) is typically faster than SCAN (Figure 5), signifying better numerical stability than SCAN, with Mn, Ni, and Cu oxides being marginal exceptions. In contrast, on a per-ionic step basis, r2SCAN and r2SCAN+U is slower than SCAN, by 1.05-1.78 and 1.1-1.31, respectively, highlighting that r2SCAN(+U) takes more electronic steps to converge per ionic step. Importantly, the overall computational time (ionic+electronic steps, Figure 5) required for structural relaxation of TMOs using r2SCAN and r2SCAN+U is lower than SCAN, by 12.1-61.2% and 1.9-34.5%, respectively, except in Fe oxides, indicating that r2SCAN(+U) takes lower number of ionic steps to converge, which possibly indicates a better description of atomic forces. The higher overall computation time in Fe oxides with r2SCAN(+U) than SCAN is primarily due to the difficulty in converging Fe3O4 with r2SCAN(+U). Comparing r2SCAN and r2SCAN+U, we find that r2SCAN+U takes a higher overall computational time to converge, except in Fe and Ni oxides. Thus, we expect r2SCAN(+U) to provide good utility in property predictions in TM-containing systems given its better computational performance and reasonable accuracy compared to SCAN(+U).
5 Conclusion
3d-TMs and their compound phases find applications in several fields such as energy storage, solar cells, catalysts, thermochemical water splitting, etc., and it is imperative to predict their properties such as lattice constants, magnetic moments, reaction enthalpies, and band gaps accurately using DFT-based techniques for designing better materials. Recently, the r2SCAN metaGGA XC functional was proposed to exhibit the accuracy of its predecessor, SCAN, and the computational performance of rSCAN in main-group compounds, but the accuracy of r2SCAN was not rigorously tested on TM-based systems. Here, we assessed the numerical accuracy and computational performance of r2SCAN in binary 3d-TMOs, in calculating the lattice parameters, on-site magnetic moments, binary oxidation enthalpies, and band gaps against experimental data. Notably, we observed that r2SCAN exhibited similar qualitative trends as that of SCAN, with marginally larger estimations of lattice parameters than SCAN, while the on-site magnetic moments and band gap calculations are marginally smaller than SCAN. While both r2SCAN and SCAN underestimated the band gaps in wide gap TMOs, with SCAN offering slightly better accuracy, they failed to predict the correct ground state electronic configurations of narrow band gap TMOs (e.g., Mn2O3).
On analysing the addition of Hubbard U-correction to improve the accuracy of the r2SCAN functional, we observed that a lower optimal U value, based on experimental oxidation enthalpies, was required in a r2SCAN+U framework for Ti, Mn, Co and Ni oxides, when compared to a SCAN+U framework. The optimal U values were identical in both r2SCAN+U and SCAN+U frameworks for V and Fe oxides, while we did not observe the need for a U correction in Cr and Cu oxides with r2SCAN, similar to SCAN. Moreover, introducing the U-correction to SCAN and r2SCAN increased the calculated lattice parameters, on-site magnetic moments and the band gaps of the TMOs.
r2SCAN+U and SCAN+U successfully opened a band gap for narrow gap TMOs (except VO2 and Mn2O3 with r2SCAN+U). Upon testing the optimal U values with r2SCAN+U on oxides with different oxidation states and/or coordination environments, we found that the U values derived in this work are in general transferable to other TM-containing oxides as well. Furthermore, we observed that r2SCAN(+U) took less overall computational time (ionic+electronic steps) to converge when compared to SCAN, which indicated that r2SCAN(+U) was computationally more efficient than SCAN(+U). Since r2SCAN+U offers a reasonably accurate prediction of material properties at a lower computational expense than SCAN+U, we observe that r2SCAN+U can be used in high-throughput materials discovery, after adequate benchmarking tests are done in each new chemical space explored.
Acknowledgments
G.S.G. acknowledges the Indian Institute of Science (IISc) Seed Grant, SG/MHRD/20/0020 and SR/MHRD/20/0013 and the Science and Engineering Research Board (SERB) of the Department of Science and Technology, Government of India, under sanction numbers SRG/2021/000201 and IPA/2021/000007 for financial support. R.D. thanks the Ministry of Human Resource Development, Government of India, for financial assistance. S.S. acknowledges financial support from SERB under IPA/2021/000007. All the authors acknowledge the computational resources provided by the Supercomputer Education and Research Centre, IISc, for enabling some of the density functional theory calculations showcased in this work.
Author Contributions
G.S.G. envisioned and designed the work. S.S. and R.D. performed the calculations. All authors contributed in data analysis and writing the paper.
Conflicts of Interest
The authors declare no competing financial or non-financial interests.
Availability of data
The data that support the findings of this study are openly available at https://github.com/sai-mat-group/r2SCAN-U-benchmarking.
Supplementary Materials
Electronic Supporting Information is available online at , with details on the crystal structures used for calculations, oxidation energetics of Cr and Cu oxides, densities of states of all systems not showcased in the main text, and details on computational time calculations.
References
- [1] W. Kohn, A. D. Becke, and R. G. Parr. Density functional theory of electronic structure. J. Phys. Chem, 100(31):12974–12980, 1996.
- [2] Anubhav Jain, Yongwoo Shin, and Kristin A. Persson. Computational predictions of energy materials using density functional theory. Nat. Rev. Mater., 1(1):15004, 2016.
- [3] Guo-Xu Zhang, Anthony M. Reilly, Alexandre Tkatchenko, and Matthias Scheffler. Performance of various density-functional approximations for cohesive properties of 64 bulk solids. New J. Phys., 20(6):063020, 2018.
- [4] Pieremanuele Canepa, Shou-Hang Bo, Gopalakrishnan Sai Gautam, Baris Key, William D Richards, Tan Shi, Yaosen Tian, Yan Wang, Juchuan Li, and Gerbrand Ceder. High magnesium mobility in ternary spinel chalcogenides. Nat. Commun, 8(1):1–8, 2017.
- [5] Artem R. Oganov, Chris .J Pickard, Qiang Zhu, and Richard J. Needs. Structure prediction drives materials discovery. Nat. Rev. Mater., 4(5):331–348, 2019.
- [6] Scott Kirklin, Bryce Meredig, and Chris Wolverton. High-throughput computational screening of new Li-ion battery anode materials. Adv. Energy Mater., 3(2):252–262, 2013.
- [7] Evgeni S Penev, Nicola Marzari, and Boris I Yakobson. Theoretical prediction of two-dimensional materials, behavior, and properties. ACS Nano, 15(4):5959–5976, 2021.
- [8] Meenesh R. Singh, Jason D. Goodpaster, Adam Z. Weber, Martin Head-Gordon, and Alexis T. Bell. Mechanistic insights into electrochemical reduction of CO2 over Ag using density functional theory and transport models. Proceedings of the National Academy of Sciences of the United States of America, 114(42):E8812–E8821, 2017.
- [9] Philip J. Hasnip, Keith Refson, Matt I.J. Probert, Jonathan R. Yates, Stewart J. Clark, and Chris J. Pickard. Density functional theory in the solid state. Philosophical Transactions of the Royal Society A: Mathematical, Physical and Engineering Sciences, 372(2011):20130270, 2014.
- [10] Maria KY Chan, Chris Wolverton, and Jeffrey P Greeley. First principles simulations of the electrochemical lithiation and delithiation of faceted crystalline silicon. J. Am. Chem. Soc., 134(35):14362–14374, 2012.
- [11] Jin-Jian Zhou, Jinsoo Park, Iurii Timrov, Andrea Floris, Matteo Cococcioni, Nicola Marzari, and Marco Bernardi. Ab initio electron-phonon interactions in correlated electron systems. Phys. Rev. Lett., 127(12):126404, 2021.
- [12] Jishnu Bhattacharya and Anton Van der Ven. First-principles study of competing mechanisms of nondilute Li diffusion in spinel LixTiS2. Phys. Rev. B, 83(14):144302, 2011.
- [13] Peter Schindler, Evan R. Antoniuk, Gowoon Cheon, Yanbing Zhu, and Evan J. Reed. Discovery of materials with extreme work functions by high-throughput density functional theory and machine learning. arXiv preprint arXiv:2011.10905, 2020.
- [14] Sheng Gong, Shuo Wang, Tian Xie, Woo Hyun Chae, Runze Liu, and Jeffrey C Grossman. Calibrating DFT formation enthalpy calculations by multi-fidelity machine learning. arXiv preprint arXiv:2110.13308, 2021.
- [15] Runhai Ouyang, Emre Ahmetcik, Christian Carbogno, Matthias Scheffler, and Luca M Ghiringhelli. Simultaneous learning of several materials properties from incomplete databases with multi-task SISSO. J. Phys. Mater., 2(2):024002, 2019.
- [16] Cheol Woo Park and Chris Wolverton. Developing an improved crystal graph convolutional neural network framework for accelerated materials discovery. Phys. Rev. Mater., 4(6):063801, 2020.
- [17] Chenru Duan, Fang Liu, Aditya Nandy, and Heather J. Kulik. Putting density functional theory to the test in machine-learning-accelerated materials discovery. J. Phys. Chem. Lett., 12(19):4628–4637, 2021.
- [18] Fabien Tran, Julia Stelzl, and Peter Blaha. Rungs 1 to 4 of DFT jacob’s ladder: Extensive test on the lattice constant, bulk modulus, and cohesive energy of solids. J. Chem. Phys., 144(20):204120, 2016.
- [19] John P. Perdew and Karla Schmidt. Jacob’s ladder of density functional approximations for the exchange-correlation energy. AIP Conference Proceedings, 577(1):1–20, 2001.
- [20] John P. Perdew, Kieron Burke, and Matthias Ernzerhof. Generalized gradient approximation made simple. Phys. Rev. Lett., 77(18):3865–3868, 1996.
- [21] Holger Dietrich Saïnick and Caterina Cocchi. Electronic structure of cesium-based photocathode materials from density functional theory: Performance of PBE, SCAN, and HSE06 functionals. Electron. struct., 3(2):027001, 2021.
- [22] Zinab Jadidi, Tina Chen, Penghao Xiao, Alexander Urban, and Gerbrand Ceder. Effect of fluorination and Li-excess on the Li migration barrier in Mn-based cathode materials. J. Mater. Chem. A, 8(38):19965–19974, 2020.
- [23] Qi Zhang, Abhishek Khetan, and Süleyman Er. Comparison of computational chemistry methods for the discovery of quinone-based electroactive compounds for energy storage. Sci. Rep., 10(1):22149, 2020.
- [24] Kamal Sharkas, Kamal Wagle, Biswajit Santra, Sharmin Akter, Rajendra R Zope, Tunna Baruah, Koblar A Jackson, John P Perdew, and Juan E Peralta. Self-interaction error overbinds water clusters but cancels in structural energy differences. Proceedings of the National Academy of Sciences, 117(21):11283–11288, 2020.
- [25] Jorge Vargas, Peter Ufondu, Tunna Baruah, Yoh Yamamoto, Koblar A Jackson, and Rajendra R Zope. Importance of self-interaction-error removal in density functional calculations on water cluster anions. Phys. Chem. Chem. Phys., 22(7):3789–3799, 2020.
- [26] Eric B. Isaacs and Chris Wolverton. Phys. Rev. Mater., 2(6):063801, 2018.
- [27] Rafael Sarmiento-Perez, Silvana Botti, and Miguel AL Marques. Optimized exchange and correlation semilocal functional for the calculation of energies of formation. J. Chem. Theory Comput., 11(8):3844–3850, 2015.
- [28] Zeng-hui Yang, Haowei Peng, Jianwei Sun, and John P Perdew. More realistic band gaps from meta-generalized gradient approximations: Only in a generalized Kohn-Sham scheme. Phys. Rev. B, 93(20):205205, 2016.
- [29] John P Perdew, Adrienn Ruzsinszky, Gábor I Csonka, Oleg A Vydrov, Gustavo E Scuseria, Lucian A Constantin, Xiaolan Zhou, and Kieron Burke. Restoring the density-gradient expansion for exchange in solids and surfaces. Phys. Rev. Lett., 100(13):136406, 2008.
- [30] Jianwei Sun, Adrienn Ruzsinszky, and Johnp Perdew. Strongly constrained and appropriately normed semilocal density functional. Phys. Rev. Lett., 115(3):036402, 2015.
- [31] Daniel Mejía-Rodríguez and S. B. Trickey. Meta-GGA performance in solids at almost GGA cost. Phys. Rev. B, 102(12):121109, 2020.
- [32] James W. Furness, Aaron D. Kaplan, Jinliang Ning, John P. Perdew, and Jianwei Sun. Accurate and numerically efficient r2SCAN meta-generalized gradient approximation. J. Phys. Chem. Lett., 11(19):8208–8215, 2020.
- [33] Sebastian Ehlert, Uwe Huniar, Jinliang Ning, James W. Furness, Jianwei Sun, Aaron D. Kaplan, John P. Perdew, and Jan Gerit Brandenburg. r2SCAN-D4: Dispersion corrected meta-generalized gradient approximation for general chemical applications. J. Chem. Phys., 154(6):061101, 2021.
- [34] Albert P. Bartók and Jonathan R. Yates. Regularized SCAN functional. J. Chem. Phys., 150(16):161101, 2019.
- [35] James W. Furness, Aaron D. Kaplan, Jinliang Ning, John P. Perdew, and Jianwei Sun. Construction of meta-GGA functionals through restoration of exact constraint adherence to regularized SCAN functionals. J. Chem. Phys., 156(3):034109, 2022.
- [36] Ryan Kingsbury, Ayush S. Gupta, Christopher J. Bartel, Jason M Munro, Shyam Dwaraknath, Matthew Horton, and Kristin A. Persson. Performance comparison of r2SCAN and SCAN metaGGA density functionals for solid materials via an automated, high-throughput computational workflow. Phys. Rev. Mater., 6(1):013801, 2022.
- [37] Gopalakrishnan Sai Gautam and Emily A. Carter. Evaluating transition metal oxides within DFT-SCAN and SCAN+U frameworks for solar thermochemical applications. Phys. Rev. Mater., 2(9):095401, 2018.
- [38] Olivia Y. Long, Gopalakrishnan Sai Gautam, and Emily A. Carter. Evaluating optimal U for 3d transition-metal oxides within the SCAN+U framework. Phys. Rev. Mater., 4(4):045401, 2020.
- [39] Vladimir I. Anisimov, Jan Zaanen, and Ole K. Andersen. Band theory and Mott insulators: Hubbard U instead of Stoner I. Phys. Rev. B, 44(3):943–954, 1991.
- [40] C. Franchini, R. Podloucky, J. Paier, M. Marsman, and G. Kresse. Ground-state properties of multivalent manganese oxides: Density functional and hybrid density functional calculations. Phys. Rev. B, 75(19):195128, 2007.
- [41] Iurii Timrov, Nicola Marzari, and Matteo Cococcioni. Hubbard parameters from density-functional perturbation theory. Phys. Rev. B, 98(8):085127, 2018.
- [42] Matteo Cococcioni and Stefane De Gironcoli. Linear response approach to the calculation of the effective interaction parameters in the LDA+U method. Phys. Rev. B, 71(3):035105, 2005.
- [43] F. Zhou, M. Cococcioni, C. A. Marianetti, D. Morgan, and G. Ceder. First-principles prediction of redox potentials in transition-metal compounds with LDA+U. Phys. Rev. B, 70(23):235121, 2004.
- [44] Guy C. Moore, Matthew K. Horton, Alexander M. Ganose, Martin Siron, and Kristin A. Persson. High-throughput determination of Hubbard U and Hund J values for transition metal oxides via linear response formalism. arXiv preprint arXiv:2201.04213, 2022.
- [45] Nicholas J. Mosey and Emily A. Carter. Ab initio evaluation of Coulomb and exchange parameters for DFT+U calculations. Phys. Rev. B, 76(15):155123, 2007.
- [46] Nicholas J. Mosey, Peilin Liao, and Emily A. Carter. Rotationally invariant ab initio evaluation of Coulomb and exchange parameters for DFT+U calculations. J. Chem. Phys., 129(1):014103, 2008.
- [47] Maituo Yu, Shuyang Yang, Chunzhi Wu, and Noa Marom. Machine learning the Hubbard U parameter in DFT+U using Bayesian optimization. npj Comput. Mater., 6(1):180, 2020.
- [48] J. Hafner and G. Kresse. The Vienna Ab-Initio Simulation Program VASP: An efficient and versatile tool for studying the structural, dynamic, and electronic properties of materials. pages 69–82, 1997.
- [49] G. Kresse and J. Hafner. Ab initio molecular dynamics for liquid metals. Phys. Rev. B, 47(1):558–561, 1993.
- [50] G. Kresse and J. Furthmüller. Efficient iterative schemes for ab initio total-energy calculations using a plane-wave basis set. Phys. Rev. B, 54(16):11169–11186, 1996.
- [51] G. Kresse and D. Joubert. From ultrasoft pseudopotentials to the projector augmented-wave method. Phys. Rev. B, 59(3):1758–1775, 1999.
- [52] Hendrik J. Monkhorst and James D. Pack. Special points for Brillouin-zone integrations. Phys. Rev. B, 13(12):5188–5192, 1976.
- [53] S. L. Dudarev, G. A. Botton, S. Y. Savrasov, C. J. Humphreys, and A. P. Sutton. Electron-energy-loss spectra and the structural stability of nickel oxide: An LSDA+U study. Phys. Rev. B, 57(3):1505–1509, 1998.
- [54] Daniil A. Kitchaev, Haowei Peng, Yun Liu, Jianwei Sun, John P. Perdew, and Gerbrand Ceder. Energetics of MnO2 polymorphs in density functional theory. Phys. Rev. B, 93(4):045132, 2016.
- [55] John P. Perdew, Weitao Yang, Kieron Burke, Zenghui Yang, Eberhard K.U. Gross, Matthias Scheffler, Gustavo E. Scuseria, Thomas M. Henderson, Igor Ying Zhang, Adrienn Ruzsinszky, Haowei Peng, Jianwei Sun, Egor Trushin, and Andreas Görling. Understanding band gaps of solids in generalized Kohn-Sham theory. Proceedings of the National Academy of Sciences of the United States of America, 114(11):2801–2806, 2017.
- [56] Oswald Kubaschewski and Charles B Alcock. Materials Thermochemistry. Pergamon Press Ltd, Headington Hill Hall, Oxford, 1993.
- [57] V.B. Parker R.H. Schumm I. Halow S.M. Bailey K.L. Churney D.D. Wagman, W.H. Evans and R.L Nuttall. The NBS Tables of Chemical Thermodynamic Properties: Selected Values for Inorganic and C1 and C2 Organic Substances in SI Units, volume 11. American Chemical Society and the American Institute of Physics for the National Bureau of Standards, Washington, DC, 1982.
- [58] Ihsan Barin. Thermochemical Data of Pure Substances. John Wiley & Sons Ltd., New York, USA 1995.
- [59] Mariette Hellenbrandt. The Inorganic Crystal Structure Database (ICSD)—Present and Future. Crystallogr. Rev., 10(1):17–22, 2004.
- [60] J.M.D. Coey and M. Venkatesan. Half-metallic ferromagnetism: Example of CrO2. J. Appl. Phys., 91(10):8345–8350, 2002.
- [61] K. D. Rogers. An X-ray diffraction study of semiconductor and metallic vanadium dioxide. Powder Diffr., 8(4):240–244, 1993.
- [62] Kiyoshi Fujino Satoshi Sasaki and Yoshio Takeuchi. X.Ray determination of electron density distributions in oxides, MgO, MnO, CoO, and NiO, and atomic scattering factors of their constituent atoms. Proceddings of Japan Academy, Series B, 55(2):43–48, 1979.
- [63] Masao Kuriyama and Sukeaki Hosoya. X-ray measurement of scattering factors of manganese and oxygen atoms in manganous oxide. J. Phys. Soc. Japan, 17(6):1022–1029, 1962.
- [64] W. Jauch, M. Reehuis, H. J. Bleif, F. Kubanek, and P. Pattison. Crystallographic symmetry and magnetic structure of CoO. Phys. Rev. B, 64(5):052102, 2001.
- [65] Z. X. Shen, R. S. List, D. S. Dessau, B. O. Wells, O. Jepsen, A. J. Arko, R. Barttlet, C. K. Shih, F. Parmigiani, J. C. Huang, and P. A.P. Lindberg. Electronic structure of NiO: Correlation and band effects. Phys. Rev. B, 44(8):3604–3626, 1991.
- [66] Helmer Fjellvåg, Fredrik Grønvold, Svein Stølen, and Bjørn Hauback. On the crystallographic and magnetic structures of nearly stoichiometric iron monoxide. J. Solid State Chem., 124(1):52–57, 1996.
- [67] Hellmuth Hartmann and Werner Mässung. Elektrolyse in phosphatschmelzen. IV. Über die Elektrolyse von Vanadin-, Niob-und Tantaloxyd in Phosphatschmelzen. Zeitschrift für anorganische und allgemeine Chemie, 266(1-3):98–104, 1951.
- [68] J. Ghijsen, L. H. Tjeng, J. Van Elp, H. Eskes, J. Westerink, G. A. Sawatzky, and M. T. Czyzyk. Electronic structure of Cu2O and CuO. Phys. Rev. B, 38(16):11322–11330, 1988.
- [69] R. Mittal, S. L. Chaplot, S. K. Mishra, and Preyoshi P. Bose. Inelastic neutron scattering and lattice dynamical calculation of negative thermal expansion compounds Cu2O and Ag2O. Phys. Rev. B, 75(17):174303, 2007.
- [70] M. Regulski, R. Przeniosło, I. Sosnowska, and J.-U. Hoffmann. Incommensurate magnetic structure of -MnO2. Phys. Rev. B, 68(17):172401, 2003.
- [71] RE Loehman, CN Ramachandra Rao, and Jurgen M Honig. Crystallography and defect chemistry of solid solutions of vanadium and titanium oxides. J. Phys. Chem., 73(6):1781–1784, 1969.
- [72] Patrick Rozier, Alicja Ratuszna, and Jean Galy. Comparative structural and electrical studies of V2O3 and V2-xNixO3 (0<x<0.75) solid solution. Zeitschrift für anorganische und allgemeine Chemie, 628(5):1236–1242, 2002.
- [73] J. Ashkenazi and T. Chuchem. Band structure of V2O3, and Ti2O3. Phil. Mag., 32(4):763–785, 1975.
- [74] E. N. Maslen, V. A. Streltsov, N. R. Streltsova, and N. Ishizawa. Synchrotron x‐ray study of the electron density in ‐Fe2O3. Acta Crystallogr. A Section B, 50(4):435–441, 1994.
- [75] B. N. Brockhouse. Antiferromagnetic structure in Cr2O3. J. Chem. Phys., 21(5):961–962, 1953.
- [76] S. C. Abrahams. Magnetic and crystal structure of titanium sesquioxide. Phys. Rev., 130(6):2230–2237, 1963.
- [77] E. J. W. Verwey. Electronic conduction of magnetite (Fe3O4) and its transition point at low temperatures. Nature, 144(3642):327–328, 1939.
- [78] S. K. Park, T. Ishikawa, and Y. Tokura. Charge-gap formation upon the Verwey transition in Fe3O4. Phys. Rev. B, 58(7):3717, 1998.
- [79] W. L. Smith and A. D. Hobson. The structure of cobalt oxide, Co3O4. Acta Crystallogr. A Section B Structural Crystallography and Crystal Chemistry, 29(2):362–363, 1973.
- [80] Osvald Knop, K.I.G. Reid, Sutarno, and Yasuaki Nakagawa. Chalkogenides of the transition elements. VI. X-Ray, neutron, and magnetic investigation of the spinels Co3O4, NiCo2O4, Co3S4, and NiCo2S4. Can. J. Chem., 46:3463, 1968.
- [81] W. L. Roth. The magnetic structure of Co3O4. J. Phys. Chem. Solids, 25(1):1–10, 1964.
- [82] Miaojun Wang and Alexandra Navrotsky. Enthalpy of formation of LiNiO2, LiCoO2 and their solid solution, LiNi1-xCoxO2. Solid State Ionics, 166(1-2):167–173, 2004.
- [83] Hasimur Rahaman, Radha M. Laha, Dilip K. Maiti, and Sujit Kumar Ghosh. Fabrication of Mn2O3 nanorods: an efficient catalyst for selective transformation of alcohols to aldehydes. RSC Adv., 5(43):33923–33929, 2015.
- [84] Qurat-ul-ain Javed, Wang Feng-Ping, M. Yasir Rafique, Arbab Mohammad Toufiq, and M. Zubair Iqbal. Canted antiferromagnetic and optical properties of nanostructures of Mn2O3 prepared by hydrothermal synthesis. Chin. Phys. B, 21(11):117311, 2012.
- [85] J. A. Bland. The crystal structure of barium orthotitanate, Ba2TiO4. Acta Crystallogr. A, 14(8):875–881, 1961.
- [86] Vishnu Shanker, Tokeer Ahmad, and Ashok K. Ganguli. Investigation of Ba2-xSrxTiO4: Structural aspects and dielectric properties. Bull. Mater. Sci., 27(5):421–427, October 2004.
- [87] Taifeng Liu, Xingfan Zhang, Jingcheng Guan, C. Richard A. Catlow, Aron Walsh, Alexey A. Sokol, and John Buckeridge. Insight into the Fergusonite–Scheelite Phase Transition of ABO4-Type Oxides by Density Functional Theory: A Case Study of the Subtleties of the Ground State of BiVO4. Chem. Mater., 34(12):5334–5343, June 2022.
- [88] A. K. Bhattacharya, K. K. Mallick, and A. Hartridge. Phase transition in BiVO4. Mater. Lett., 30(1):7–13, 1997.
- [89] Jason K. Cooper, Sheraz Gul, Francesca M. Toma, Le Chen, Per-Anders Glans, Jinghua Guo, Joel W. Ager, Junko Yano, and Ian D. Sharp. Electronic Structure of Monoclinic BiVO4. Chem. Mater., 26(18):5365–5373, September 2014.
- [90] Keith V. Lawler, Bradley C. Childs, Daniel S. Mast, Kenneth R. Czerwinski, Alfred P. Sattelberger, Frederic Poineau, and Paul M. Forster. Molecular and Electronic Structures of M2O7 (M = Mn, Tc, Re). Inorganic Chemistry, 56(5):2448–2458, March 2017.
- [91] Arndt Simon, Richard Dronskowski, Bernt Krebs, and Bernhard Hettich. The Crystal Structure of Mn2O7. Angewandte Chemie International Edition in English, 26(2):139–140, 1987.
- [92] R. Olazcuaga, J.-M. Reau, G. Leflem, and P. Hagenmuller. Préparation, Proprietés Cristallographiques et Magnétiques des Phases K3XO4 (X= V, Cr, Mn). Zeitschrift für anorganische und allgemeine Chemie, 412(3):271–280, 1975.
- [93] Gus J. Palenik. Crystal structure of potassium manganate. Inorganic Chemistry, 6(3):507–511, March 1967.
- [94] Takayoshi Takeda, Yasuo Yamaguchi, and Hiroshi Watanabe. Magnetic Structure of SrFeO3. J. Phys. Soc. Japan, 33(4):967–969, 1972.
- [95] I. R. Shein, K. I. Shein, V. L. Kozhevnikov, and A. L. Ivanovskii. Band structure and the magnetic and elastic properties of SrFeO3 and LaFeO3 perovskites. Phys. Solid State, 47(11):2082–2088, November 2005.
- [96] G. G. Amatucci, J. M. Tarascon, and L. C. Klein. CoO2, The End Member of the LixCoO2 Solid Solution. J. Electrochem. Soc., 143(3):1114–1123, March 1996.
- [97] C. Delmas, M. Ménétrier, L. Croguennec, S. Levasseur, J. P. Pérès, C. Pouillerie, G. Prado, L. Fournès, and F. Weill. Lithium batteries: a new tool in solid state chemistry. Int. J. Inorg. Mater., 1(1):11–19, 1999.
- [98] M. K. Aydinol, A. F. Kohan, G. Ceder, K. Cho, and J. Joannopoulos. Ab initio study of lithium intercalation in metal oxides and metal dichalcogenides. Phys. Rev. B, 56:1354–1365, Jul 1997.
- [99] Olivia Y. Long, Gopalakrishnan Sai Gautam, and Emily A. Carter. Assessing cathode property prediction via exchange-correlation functionals with and without long-range dispersion corrections. Phys. Chem. Chem. Phys., 23:24726–24737, 2021.
- [100] C. Delmas, M. Ménétrier, L. Croguennec, S. Levasseur, J.P. Pérès, C. Pouillerie, G. Prado, L. Fournès, and F. Weill. Lithium batteries: a new tool in solid state chemistry. Int. j. inorg. mater., 1(1):11–19, 1999.
- [101] Tsutomu Ohzuku and Atsushi Ueda. Why transition metal (di) oxides are the most attractive materials for batteries. Solid State Ionics, 69(3):201–211, 1994.
- [102] M.K. Aydinol, A.F. Kohan, and G. Ceder. Ab initio calculation of the intercalation voltage of lithium-transition-metal oxide electrodes for rechargeable batteries. J. Power Sources, 68(2):664–668, 1997. Proceedings of the Eighth International Meeting on Lithium Batteries.
- [103] M. E. Arroyo y de Dompablo, A. Van der Ven, and G. Ceder. First-principles calculations of lithium ordering and phase stability on . Phys. Rev. B, 66:064112, Aug 2002.