Performance Analysis of Priority-Aware NoCs with
Deflection Routing under Traffic Congestion
Abstract.
Priority-aware networks-on-chip (NoCs) are used in industry to achieve predictable latency under different workload conditions. These NoCs incorporate deflection routing to minimize queuing resources within routers and achieve low latency during low traffic load. However, deflected packets can exacerbate congestion during high traffic load since they consume the NoC bandwidth. State-of-the-art analytical models for priority-aware NoCs ignore deflected traffic despite its significant latency impact during congestion. This paper proposes a novel analytical approach to estimate end-to-end latency of priority-aware NoCs with deflection routing under bursty and heavy traffic scenarios. Experimental evaluations show that the proposed technique outperforms alternative approaches and estimates the average latency for real applications with less than 8% error compared to cycle-accurate simulations.
Emails: {skmandal, anish.n.krishnakumar, uogras}@wisc.edu; R. Ayoub and M. Kishinevsky, Intel Corporation, 2111 NE 25th Ave., Hillsboro, OR 97124; emails: {raid.ayoub, michael.kishinevsky}@intel.com Link to the short presentation: https://www.youtube.com/watch?v=rMZWC8imO8k&ab_channel=SumitKumarMandal Link to the full presentation: https://www.youtube.com/watch?v=OHqwSLxR2UU&ab_channel=SumitKumarMandal
1. Introduction
Pre-silicon design-space exploration and system-level simulations constitute a crucial component of the industrial design cycle (Palesi and Givargis, 2002; Ghosh and Givargis, 2003). They are used to confirm that new generation designs meet power-performance targets before labor- and time-intensive RTL implementation starts (Binkert et al., 2011). Furthermore, virtual platforms combine power-performance simulators and functional models to enable firmware and software development while hardware design is in progress (Leupers et al., 2011). These pre-silicon evaluation environments incorporate cycle-accurate NoC simulators due to the criticality of shared communication and memory resources in overall performance (Agarwal et al., 2009; Jiang et al., [n.d.]). However, slow cycle-accurate simulators have become the major bottleneck of pre-silicon evaluation. Similarly, exhaustive design-space exploration is not feasible due to the long simulation times. Therefore, there is a strong need for fast, yet accurate, analytical models to replace cycle-accurate simulations to increase the speed and scope of pre-silicon evaluations (Yoo et al., 2002).
Analytical NoC performance models are used primarily for fast design space exploration since they provide significant speed-up compared to detailed simulators (Ogras et al., 2010; Kiasari et al., 2013; Kashif and Patel, 2014; Qian et al., 2015). However, most existing analytical models fail to capture two important aspects of industrial NoCs (Jeffers et al., 2016). First, they do not model routers that employ priority arbitration. Second, existing analytical models assume that the destination nodes always sink the incoming packets. In reality, network interfaces between the routers and cores have finite (and typically limited) ingress buffers. Hence, packets bounce (i.e., they are deflected) at the destination nodes when the ingress queue is full. Recently proposed performance models target priority-aware NoCs (Mandal et al., 2019; Mandal et al., 2020). However, these ignore deflection due to finite buffers and uses the packet injection rate as the primary input. This is a significant limitation since the deflection probability () increases both the hop count and traffic congestion. Indeed, Figure 1 shows that the average NoC latency increases significantly with the probability of deflection. For example, the average latency varies from 6–70 cycles for an injection rate of 0.25 packets/cycle/source when varies from 0.1–0.5. Therefore, performance models for priority-aware NoCs have to account for deflection probability at the destinations.

This work proposes an accurate analytical model for priority-aware NoCs with deflection routing under bursty traffic. In addition to increasing the hop count, deflection routing also aggravates traffic congestion due to extra packets traveling in the network. Since the deflected packets also have a complex effect on the egress queues of the traffic sources, analytical modeling of priority-aware NoCs with deflection routing is challenging. To address this problem, we first need to approximate the probability distribution of inter-arrival time of deflected packets. Specifically, we compute the first two moments of inter-arrival time of deflected packets since we consider bursty traffic. To this end, the proposed approach starts with a canonical queuing system with deflection routing. We first model the distribution of deflected traffic and the average queuing delay for this system. However, this methodology is not scalable when the network has multiple queues with complex interactions between them. Therefore, we also propose a superposition-based technique to obtain the waiting time of the packets in arbitrarily sized industrial NoCs. This technique decomposes the queuing system into multiple subsystems. The structure of these subsystems is similar to the canonical queuing system. After deriving the analytical expressions for the parameters of the distribution model of deflected packets of individual subsystems, we superimpose the result to solve the original system with multiple queues. Thorough experimental evaluations with industrial NoCs and their cycle-accurate simulation models show that the proposed technique significantly outperforms prior approaches (Kiasari et al., 2013; Mandal et al., 2019). In particular, the proposed technique achieves less than 8% modeling error when tested with real applications from different benchmark suites. The major contributions of this work are as follows:
-
•
An accurate performance model for priority-aware NoCs with deflection routing under bursty traffic,
-
•
An algorithm to obtain end-to-end latency using the proposed performance model,
-
•
Detailed experimental evaluation with industrial priority-aware NoC under varying degrees of deflection.
The rest of this paper is organized as follows. Section 2 summarizes the related research. Section 3 presents the background and overview of the proposed work. Section 4 describes the proposed methodology to construct the analytical model for priority-aware NoCs, which considers deflection routing. Section 5 details experimental evaluations, and Section 6 concludes the paper.
2. Related Work
Deflection routing was first introduced in the domain of optical NoC as hot-potato routing (Borodin et al., 1997). Later, it was adapted for the NoCs used in high-performance SoCs to minimize buffer requirements and increase energy efficiency (Moscibroda and Mutlu, 2009; Fallin et al., 2011; Fallin et al., 2012). This routing mechanism always assigns the packets to a free output port of a router, even if the assignment does not result in minimum latency. This way, the buffer size requirement in the routers is minimized. Authors in (Lu et al., 2006) perform a thorough study on the effectiveness of deflection routing for different NoC topology and routing algorithm. Deflection routing is also used in industrial priority-aware NoC (Jeffers et al., 2016). Since arbitrary deflections can cause livelocks and unpredictable latency, industrial priority-aware NoCs deflect the packets only at the destination nodes when the ingress buffer is full. Furthermore, the deflected packets always remain within the same row or column, and they are guaranteed to be sunk after a fixed number of deflections.
NoC performance analysis techniques have been used for design space exploration and architectural studies such as buffer sizing (Ogras et al., 2010; Wu et al., 2010; Petracca et al., 2009). However, most of these techniques do not consider NoCs with priority arbitration and deflection routing, which are the key features of industrial NoCs (Jeffers et al., 2016). Performance analysis of priority-aware queuing networks has also been studied for off-chip networks (Bertsekas et al., 1992; Bolch et al., 2006; Walraevens, 2004). These analytical models consider the queuing networks in continuous time. However, each transaction in NoC happens at each clock cycle. Therefore, the underlying queuing system needs to be considered in the discrete time domain. A performance analysis technique for a priority-aware queuing network in discrete time domain is presented in (Walraevens, 2004). However, this technique suffers from high complexity for a complex queuing network, hence not applicable to industrial priority-aware NoCs.
A recent technique targets priority-aware NoCs (Kiasari et al., 2013), but it considers only a single class of packets in each queue of the network. In contrast, industrial priority-aware NoCs have multiple classes of packets that can exist in the same queue. NoCs with multiple priority traffic classes has recently been analyzed in (Mandal et al., 2019). However, this analysis assumes that the input traffic follows a geometric distribution. This technique has limited applications since industrial NoCs can experience bursty traffic. Furthermore, it does not consider deflection routing. Since deflection routing increases traffic congestion, it is crucial to incorporate this aspect while constructing performance models. An analytical bound on maximum delay in networks with deflection routing is presented in (Brassil and Cruz, 1995). However, evaluating maximum delay is not useful since it leads to significant overestimation. Another analytical model for NoCs with deflection routing is proposed in (Ghosh et al., 2010). The authors first compute the blocking probability at each port of a router using an M/G/1 queuing model. Then, they compute the contention matrix at each router port. The average waiting time of packets at each port is computed using the contention matrix. However, this analysis ignores different priority classes and applies to only continuous-time queuing systems.
In contrast to prior work, we propose a performance analysis technique that considers both priority-aware NoCs with deflection routing under bursty and high traffic load. The proposed technique applies the superposition principle to obtain the statistical distribution of the deflected packets. Using this distribution, it computes the average waiting time for each queue. To the best of our knowledge, this is the first analytical model for priority-aware industrial NoCs with deflection routing under high traffic load.
3. Background and Overview

3.1. Assumptions and Notations
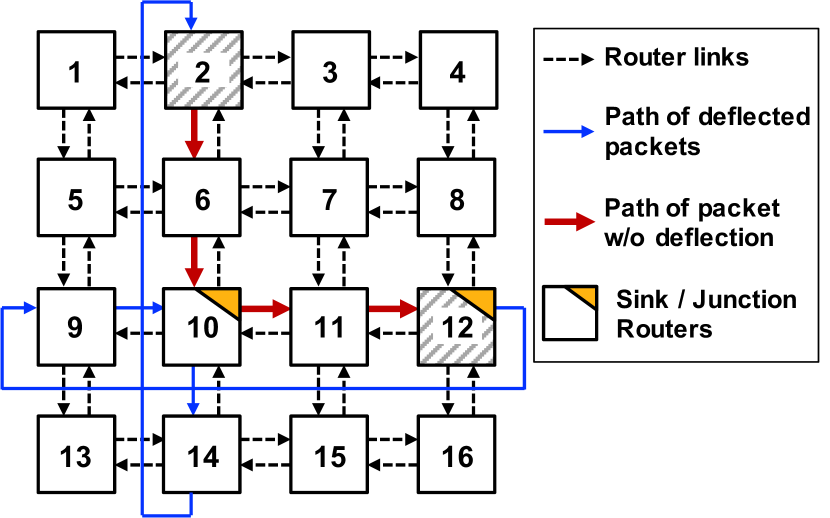
Architecture: This work considers priority-aware NoCs used in high-end servers and many core architectures (Jeffers et al., 2016). Each column of the NoC architecture, shown in Figure 2, is also used in client systems such as Intel i7 processors (Rotem, 2015). Hence, the proposed analysis technique is broadly applicable to a wide range of industrial NoCs.
In priority-aware NoCs, the packets already in the network have higher priority than the packets waiting in the egress queues of the sources. Assume that Node 2 in Figure 2 sends a packet to Node 12 following Y-X routing (highlighted by red arrows). Suppose that a packet in the egress queue of Node 6 collides with this packet. The packet from Node 2 to Node 12 will take precedence since the packets already in the NoC have higher priority. Hence, packets experience a queuing delay at the egress queues but have predictable latency until they reach the destination or turning point (Node 10 in Figure 2). Then, it competes with the packets already in the corresponding row. That is, the path from the source (Node 2) to the destination (Node 12) can be considered as two segments, which consist of a queuing delay followed by a predictable latency.
Deflection in priority-aware NoCs happens when the ingress queue at the turning point (Node 10) or final destination (Node 12) become full. This can happen if the receiving node, such as a cache controller, cannot process the packets fast enough. The probability of observing a full queue increases with smaller queues (needed to save area) and heavy traffic load from the cores. If the packet is deflected at the destination node, it circulates within the same row, as shown in Figure 2. Consequently, a combination of regular and deflected traffic can load the corresponding row and pressure the ingress queue at the turning point (Node 10). This, in turn, can lead to deflection on the column and propagates the congestion towards the source. Finally, if a packet is deflected more than a specific number of times, it reserves a slot in the ingress queue. This bounds the maximum number of deflections and avoids livelock.
Traffic: Industrial priority-aware NoCs can experience bursty traffic, which is characteristic of real applications (Bogdan and Marculescu, 2010; Qian et al., 2015). This work considers generalized geometric (GGeo) distribution for the input traffic, which takes burstiness into account (Kouvatsos, 1994). GGeo traffic is characterized by an average injection rate () and the coefficient of variation of inter-arrival time (). We define a traffic class as the traffic of each source-destination pair. The average injection rate and coefficient of variation of inter-arrival time of class- are denoted by and as respectively, as shown in Table 1. Finally, the mean service time and coefficient of variation of inter-departure time of class- are denoted as and .
3.2. Overview of the Proposed Approach
Our goal is to construct an accurate analytical model to compute the end-to-end latency for priority-aware NoCs with deflection routing. The proposed approach can be used to accelerate full system simulations and also to perform design space exploration. We assume that the parameters of the GGeo distribution of the input traffic to the NoC () are known from the knowledge of the application. The proposed model uses the deflection probability () as the second major input, in contrast to existing techniques that ignore deflection. Its range is found from architecture simulations as a function of the NoC architecture (topology, number of processors, and buffer sizes). Its analytical modeling is left for future work. The proposed analytical model utilizes the distribution of the input traffic to the NoC () and the deflection probability () to compute the average end-to-end latency as a sum of four components: (1) Queuing delay at the source, (2) the latency from the source router to the junction router, (3) queuing delay at the junction router, and (4) the latency from the junction router to the destination. Note that all these components account for deflection, and it is challenging to compute them, especially under high traffic load.
| Arrival rate of class- | |||
|---|---|---|---|
| Deflection probability at sink- | |||
| , | Original and modified mean service time of class- | ||
| Mean server utilization of class- (=) | |||
|
|||
|
|||
|
|||
|
|||
| Mean waiting time of class- |
4. Methodology
This section presents the proposed performance analysis technique for estimating the end-to-end latency for priority-aware NoCs with deflection routing. We first construct a model for a canonical system with a single traffic class, where the deflected traffic distribution is approximated using a GGeo distribution (Section 4.1). Subsequently, we introduce a scalable approach for a network with multiple traffic classes. In this approach, we first develop a solution for the canonical system. Then, employ the principle of superposition to extend the analytical model to larger and realistic NoCs with multiple traffic classes (Section 4.2). Finally, we propose an algorithm that uses our analytical models to compute the average end-to-end latency for a priority-aware NoC with deflection routing (Section 4.3).
4.1. An Illustration with a Single Traffic Class
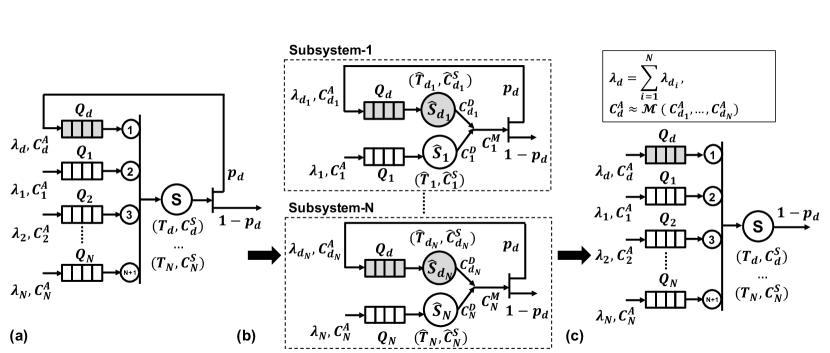
Figure 3(a) shows an example of a single class input traffic and egress queue that inject traffic to a network with deflection routing. The input packets are buffered in the egress queue (analogous to the packets stored in the egress queue of Node 2 in Figure 2). We denote the traffic of as class-, which is modeled using GGeo distribution with two parameters (). The packets in are dispatched to a priority arbiter and assigned a low priority, marked with . In contrast, the packets already in the network have a high priority, which are routed to the port marked with . The packet traverses a certain number of hops (similar to the latency from the source router to the junction router in Figure 2) and reaches the destination. Since the number of hops is constant for a particular traffic class, we omit these details in Figure 3(a) for simplicity. If the ingress queue at the destination is full (with probability ), the packet is deflected back into the network. Otherwise, it is consumed at the destination (with probability ). Deflected packets travel through the NoC (within the column or row as illustrated in Figure 2) and pass through the source router, but this time with higher priority. The profile of the deflected packets in the network is modeled by a buffer () in Figure 3(a), since they remain in order and have a fixed latency from the destination to the original source. This process continues until the destination can consume the deflected packets.
Our goal is to compute the average waiting time in the source queue, i.e., components 1 and 3 of the end-to-end latency described in Section 3.2. To obtain , we first need to derive the analytical expression for the rate of deflected packets of class- () and the coefficient of variation of inter-arrival time of the deflected packets () as follows.
Rate of deflected packets (): is obtained by calculating the average number of times a packet is deflected () until it is consumed at the destination as:
| (1) |
Therefore, can be expressed as:
| (2) |
Coefficient of variation of inter-arrival time of deflected packets (): To compute , the priority related interaction between the deflected traffic of and new injections in must be captured. This computation is more involved due to the priority arbitration between the packets in and that involve a circular dependency. We tackle this problem by transforming the system in Figure 3(a) into an approximate representation shown in Figure 3(b) to simplify the computations. The idea here is to transform the priority queuing with a shared resource into separate queue nodes (queue + server) with a modified server process. This transformation enables the decomposition of and and their shared server into individual queue nodes with servers and respectively. The departure traffic from these two nodes merge at the destination, consumed with a probability and deflected otherwise.
The input traffic to the egress queue, as well as the deflected traffic, may exhibit bursty behavior. Indeed, the deflected traffic distribution can be bursty because of the server-process effect and the priority interactions between the input traffic and the deflected traffic, even when the input traffic is not bursty. Therefore, we approximate the distribution of the deflected traffic via GGeo distribution. To compute the parameters of the GGeo traffic, we need to apply the principle of maximum entropy (ME) as shown in (Kouvatsos, 1994). To obtain the modified service process of class-, we first calculate the probability of no packets in and in its corresponding server (i.e., ) using ME as,
| (3) |
where and denote the utilization of the respective servers, and is the occupancy of class- in . Next, we apply Little’s law to compute the first order moment of modified service time () as:
| (4) |
Subsequently, we obtain the effective coefficient of variation as:
| (5) |
where . We follow similar steps (Equation 3 – Equation 5) for the deflected traffic to obtain and . With the modified service process, the coefficients of variation of inter-departure time of the packets in () and () are computed using the process merging method (Pujolle and Ai, 1986). Then, we find the coefficient of variation () of the merged traffic from queues and as:
| (6) |
We note that is a function of the coefficient of variation of the inter-arrival time of deflected traffic . Since part of this merged traffic is consumed at the sink, we apply the traffic splitting method from (Pujolle and Ai, 1986) to approximate as:
| (7) |
Finally, we extend the priority-aware formulations in continuous time domain (Bolch et al., 2006) to discrete time domain to obtain the average waiting time of the packets in and :
| (8) | ||||
| (9) |
4.2. Queuing System with Multiple Traffic Classes
The analytical model for the system with a single class presented in Section 4.1 becomes intractable with a higher number of traffic classes. This section introduces a scalable approach based on the superposition principle that builds upon our canonical system used in Section 4.1.
Figure 4(a) shows an example with priority arbitration and egress queues, one for each traffic class. We note that this queuing system is a simplified representation of a real system. The packets routed to port have higher priority than those routed to port for . The deflected traffic in the network is buffered in , which has the highest priority in the queuing system. The primary goal is to model the queuing time of the packets of each traffic class. Modeling the coefficient of variations of the deflected traffic becomes harder since deflected packets interact with all traffic classes rather than a single class. These interactions complicate the analytical expressions significantly.
Priority arbitration enables us to sort the queues in the order at which the packets are served. The queue of the deflected packets has the highest priority, while the rest are ordered with respect to their indices. Due to this inherent order between the priority classes, their impact on the deflected traffic distribution can be approximated as being independent of each other. This property enables us to decompose the queuing system into multiple subsystems and model each subsystem separately, as illustrated in Figure 4(b). Then, we apply the principle of superposition to obtain the parameters of the GGeo distribution of the deflected traffic. Note that each of these subsystems is identical to the canonical system analyzed in Section 4.1. Hence, we first compute and of each subsystem- following the procedure described in Section 4.1. Subsequently, we apply the superposition principle to and for to obtain the GGeo distribution parameters of the deflected traffic ().
In general, we obtain the GGeo distribution parameters of the deflected traffic corresponding to class- by setting all traffic classes to zero expect class-, (, ). The values of and can be expressed as:
| (10) |
Subsequently, we apply the principle of superposition to obtain the distribution parameters of as shown in Figure 4(c). First, we compute by adding all as:
| (11) |
The value of is approximated by applying the superposition-based traffic merging process (Pujolle and Ai, 1986) for each , as shown below:
| (12) |

Next, we use these distribution parameters () of the deflected packets to calculate the waiting time of the traffic classes in the system. The formulation of the priority-aware queuing system is applied to obtain the waiting time of each traffic class- () (Bertsekas et al., 1992):
| (13) |
The first term in Equation 4.2 denotes the effect of deflected traffic on class-; the second term denotes the effect of higher priority classes (class-, ) on class-; and the last term denotes the effect of class- itself. For more complex scenarios that include traffic splits, we apply an iterative decomposition algorithm (Mandal et al., 2020) to obtain the queuing time of different classes.
Figure 5 shows the average latency comparison between the proposed analytical model and simulation for the system in Figure 4. In this setup, we assume the number of classes is 5 (), , and input traffic distribution is geometric. The results show that the analytical model performs well against the simulation, with only 4% error on average. In contrast, the analytical model from (Kiasari et al., 2013) highly overestimates the latency as it does not consider multiple traffic classes. The performance model of the priority-aware NoC in (Mandal et al., 2019) accounts for multiple traffic classes, but it does not model deflection. Hence, it severely underestimates the average latency.
4.3. Summary & End-to-End Latency Estimation
Summary of the analytical modeling: We presented a scalable approach for the analytical model generation of end-to-end latency that handles multiple traffic classes of priority-aware NoCs with deflection routing. It applies the principle of superposition on subsystems where each subsystem is a canonical queuing system of a single traffic class to significantly simplify the approximation of the GGeo parameters of deflected traffic and in turn, the latency calculations.
End-to-End latency computation: Algorithm 1 describes the end-to-end latency computation with our proposed analytical model. The input parameters of the algorithm are the NoC topology, routing algorithm, service process of each server, input traffic distribution for each class, and deflection probability per sink. It outputs the average end-to-end latency (). First, the queuing system is decomposed into multiple subsystems as shown in Figure 4(b) and and for each subsystem- are computed. Subsequently, the proposed superposition methodology is applied to compute and , shown in lines 6–9 of the algorithm. Then, and are used to compute the average waiting time of the deflected packets (). Then, the average waiting time for class- in () is computed as shown in lines 13–14. The service time combined with static latency from source to destination () is added to to obtain the end-to-end latency. Finally, the average end-to-end latency () is computed by taking a weighted average of the latency of each class, as shown in line 16 of the algorithm.
5. Experimental Evaluations
This section validates the proposed analytical model against an industrial cycle-accurate NoC simulator under a wide range of traffic scenarios. The experiment scenarios include real applications and synthetic traffic that allow evaluations with varying injection rates and deflection probabilities. The evaluations include a 66 mesh NoC and a 61 ring as representative examples of high-end server CPUs (Jeffers et al., 2016) and high-end client CPUs (Rotem, 2015), respectively. In both cases, the traffic sources emulate high-end CPU cores with a 100% hit rate on the shared last level cache (LLC) to load the NoCs. The target platforms are more powerful than experimental (Vangal et al., 2008) and special-purpose (Wentzlaff et al., 2007) platforms with simple cores, although the mesh size is smaller. To further demonstrate the scalability of the proposed approach, we also present results with mesh sizes up to 1616. All cycle-accurate simulations run for 200K cycles, with a warm-up period of 20K cycles, to allow the NoC to reach the steady-state.


with bursty traffic arrival, and comparisons against prior work (Kiasari et al., 2013; Mandal et al., 2019). ‘E’ signifies error ¿100%.
| Topo. | 66 Mesh | 61 Ring | |||||||||||||||||||||||||||||||||||
|---|---|---|---|---|---|---|---|---|---|---|---|---|---|---|---|---|---|---|---|---|---|---|---|---|---|---|---|---|---|---|---|---|---|---|---|---|---|
| 0.1 | 0.2 | 0.3 | 0.1 | 0.2 | 0.3 | ||||||||||||||||||||||||||||||||
| 0.2 | 0.6 | 0.2 | 0.6 | 0.2 | 0.6 | 0.2 | 0.6 | 0.2 | 0.6 | 0.2 | 0.6 | ||||||||||||||||||||||||||
| 0.1 | 0.3 | 0.4 | 0.1 | 0.3 | 0.4 | 0.1 | 0.3 | 0.4 | 0.1 | 0.3 | 0.4 | 0.1 | 0.2 | 0.3 | 0.1 | 0.2 | 0.3 | 0.1 | 0.3 | 0.4 | 0.1 | 0.3 | 0.4 | 0.1 | 0.3 | 0.4 | 0.1 | 0.3 | 0.4 | 0.1 | 0.2 | 0.3 | 0.1 | 0.2 | 0.3 | ||
| Error(%) | Prop. | 7.3 | 9.6 | 8.1 | 14 | 13 | 14 | 8.9 | 8.0 | 7.7 | 13 | 12 | 12 | 9.6 | 9.2 | 6.5 | 11 | 12 | 13 | 1.0 | 4.1 | 5.8 | 4.6 | 5.2 | 5.5 | 0.7 | 2.3 | 4.2 | 6.3 | 7.3 | 8.6 | 0.7 | 0.9 | 3.3 | 6.3 | 8.5 | 8.6 |
| Ref(Kiasari et al., 2013) | 2.6 | E | E | 26 | E | E | 22 | E | E | 39 | E | E | 35 | 18 | E | 57 | E | E | 7.0 | E | E | 34 | E | E | 23 | E | E | 45 | E | E | 42 | E | E | 54 | E | E | |
| Ref(Mandal et al., 2019) | 12 | 15 | 23 | 3.1 | 18 | 23 | 28 | 41 | 65 | 19 | 33 | 49 | 42 | 45 | 55 | 39 | 35 | 31 | 15.3 | 18 | 22 | 18 | 24 | 33 | 30 | 38 | 67 | 31 | 44 | 54 | 41 | 50 | 73 | 42 | 50 | 58 | |
5.1. Estimation of Deflected Traffic
One of the key components of the proposed analytical model is estimating the average number of deflected packets. This section evaluates the accuracy of this estimation compared to simulation with a 66 mesh. To perform evaluations under heavy load, we set the deflection probability at each junction and sink to and injection rates at each source to 0.33 packets/cycle/source, which are relatively large values seen in actual systems. We first run cycle-accurate simulations to obtain the average number of deflected packets at each row and column of the mesh. Then, the analytical model estimates the same quantities for the 66 mesh. Figure 6 shows the estimation accuracy for all rows and columns. The average estimation accuracy across all rows and columns is 96% and the worst-case accuracy is 92%. Overall, this evaluation shows that the proposed model accurately estimates the average number of deflected packets.
5.2. Evaluations with Geometric Traffic Input
This section evaluates the accuracy of our latency estimation technique when the sources inject packets following a geometric traffic distribution. We note that our technique can also handle bursty traffic, which is significantly harder. However, we start with this assumption to make a fair comparison to two state-of-the-art techniques from the literature (Kiasari et al., 2013; Mandal et al., 2019). The model presented in (Kiasari et al., 2013) does not incorporate multiple traffic classes and deflection routing. On the other hand, the model presented in (Mandal et al., 2019) considers multiple traffic classes but does not consider bursty traffic and deflection routing.
The evaluations are performed first on the server-like 66 mesh for deflection probabilities 0.1 and 0.3 while sweeping the packet injection rates. Figure 7(a) and Figure 7(b) show that the proposed technique follows the simulation results closely for all injections. More specifically, the proposed analytical model has only 7% and 6% percentage error on average for deflection probabilities of 0.1 and 0.3, respectively. In sharp contrast, the analytical model proposed in (Kiasari et al., 2013) significantly overestimates the latency starting with moderate injection rates, since it does not consider multiple traffic classes. Its performance degrades even further with larger deflection probability, as depicted in Figure 7(b). We note that it also slightly underestimates the latency at low injection rates since it ignores deflection. Unlike this approach, the technique presented in (Mandal et al., 2019) considers multiple traffic classes in the same queue, but it ignores deflected packets. Consequently, it severely underestimates the latency impact of deflection, as shown in Figure 7.
We repeated the same evaluation on a 61 priority-aware ring NoC which follows a high-end industrial quad-core CPU with an integrated GPU and memory-controller (Jeffers et al., 2016). The average error between the proposed analytical model and simulations are 7% and 4% for deflection probabilities of 0.1 and 0.3, respectively. In contrast, the model presented in (Kiasari et al., 2013) underestimates the latency at low injection rates and significantly overestimates it under high traffic load similar to the 66 results in Figure 7. Similarly, the analytical model presented in (Mandal et al., 2019) severely underestimates the average latency. It leads to an average 43% error with respect to simulation. The plots of these results are not included for space considerations since they closely follow the results in Figure 7.

5.3. Latency Estimation with Bursty Traffic Input
Since real applications exhibit burstiness, it is crucial to perform accurate analytical modeling under bursty traffic. Therefore, this section presents the comparison of our proposed analytical model with respect to simulation under bursty traffic. For an extensive and thorough validation, we sweep the packet injection rate (), probability of burstiness (), and deflection probability (). The injection rates cover a wide range to capture various traffic congestion scenarios in the network. Likewise, we report evaluation results for two different burstiness ( {0.2,0.6}), and three different deflection probabilities ( {0.1,0.2,0.3}). The coefficient of variation for the input traffic (), the final input to the model, is then computed as a function of and (Kouvatsos and Luker, 1984). We simulate the 66 mesh and 61 ring NoCs using their cycle-accurate models for all input parameter values mentioned above. Then, we estimate the average packet latencies using the proposed technique, as well as the most relevant prior work (Kiasari et al., 2013; Mandal et al., 2019).
The estimation error of all three performance analysis techniques is reported in Table 2 for all input parameters. The mean and median estimation errors of our proposed technique are 9.3% and 9.5%, respectively. Furthermore, we do not observe more than 14% error even with relatively higher traffic load, probability of deflection, and burstiness than seen in real applications (presented in the following section). In strong contrast, the analytical models proposed in (Kiasari et al., 2013) severely overestimate the latency similar to the results presented in Section 5.2. The estimation error is more than 100% for most cases since the impact of multiple traffic classes and deflected packet become more significant under these challenging scenarios. Similarly, the model proposed in (Mandal et al., 2019) underestimates the latency because it does not model bursty traffic.
The right-hand side of Table 2 summarizes the estimation errors obtained on the 61 ring NoC that follows high-end client systems. In most cases, the error with the proposed analytical model is within 10% of simulation, and the error is as low as 1%. With , and , the error is 14%, which is acceptable, considering that the network is severely congested. In contrast, the analytical models proposed in (Kiasari et al., 2013) overestimate the latency, whereas the models in (Mandal et al., 2019) underestimate the latency which conforms the results with geometric traffic, as in the 66 mesh results.
5.4. Experiments with Real Applications
In addition to the synthetic traffic, the proposed analytical model is evaluated with applications from SPEC CPU®2006 (Henning, 2006), SPEC CPU®2017 benchmark suites (Bucek et al., 2018), and the SYSmark®2014 application ((BAPCo), [n.d.]). Specifically, the evaluation includes SYSmark14, gcc, bwaves, mcf, GemsFDTD, OMNeT++, Xalan, and perlbench applications. The chosen applications represent a variety of injection rates for each source in the NoC and different levels of burstiness. Each application is profiled offline to find the input traffic parameters. Of note, the probability of burstiness for these applications ranges from 0.25 to 0.55, which is aligned with the evaluations in Section 5.3.
The benchmark applications are executed on both 66 mesh and 61 ring architectures. The comparison of average latency between simulation and proposed analytical model for the 66 mesh is shown in Figure 8. The proposed model follows the simulation results very closely for deflection probability 0.1 and 0.3, as shown in Figure 8(a) and Figure 8(b), respectively. These plots show the average packet latencies normalized to the smallest latency from the 61 ring simulations due to the confidentiality of the results. On average, the proposed analytical model achieves less than 5% modeling error. In contrast, the analytical models which do not consider deflection routing (Kiasari et al., 2013; Mandal et al., 2019) underestimate the latency, since the injection rates of these applications are in the range of 0.02–0.1 flits/cycle/source (low injection region).
We observe similar results for the 61 ring NoC. The average estimation error of our proposed technique is less than 8% for all applications. In contrast, the prior techniques underestimate the latency by more than 2 since they ignore deflected packets, and the average traffic loads are small. In conclusion, the proposed technique outperforms state-of-the-art for real applications and a wide range of synthetic traffic inputs.

5.5. Scalability Analysis
Finally, we evaluate the scalability of the proposed technique for larger NoCs. We note that accuracy results for larger NoCs are not available since they do not have detailed cycle-accurate simulation models. We implemented the analytical model in C. Figure 9 shows that the analysis completes in the order of seconds for up to 1616 mesh. In comparison, cycle-accurate simulations take hours with this size, even considering linear scaling. When we scale the mesh size aggressively to 1616, the analysis completes in about 5 seconds, which is orders of magnitude faster than cycle-accurate simulations of NoCs of this size.
6. Conclusions
Industrial NoCs incorporate priority-arbitration and deflection routing to minimize buffer requirement and achieve predictable latency. Analytical performance modeling of these NoCs is needed to perform design space exploration, fast system simulations, and tuning architectural parameters. However, state-of-the-art performance analysis models for NoCs do not incorporate priority arbitration and deflection routing together. This paper presented a performance analysis technique for industrial priority aware NoCs with deflection routing under heavy traffic. Experimental evaluations with industrial NoCs show that the proposed technique significantly outperforms existing analytical models under both real application and a wide range of synthetic traffic workloads.
References
- (1)
- Agarwal et al. (2009) Niket Agarwal, Tushar Krishna, Li-Shiuan Peh, and Niraj K Jha. 2009. GARNET: A Detailed on-chip Network Model inside a Full-System Simulator. In 2009 IEEE International Symposium on Performance Analysis of Systems and Software. 33–42.
- (BAPCo) ([n.d.]) Business Applications Performance Corporation (BAPCo). [n.d.]. Benchmark, SYSmark2014. http://bapco.com/products/sysmark-2014, accessed 27 May 2020.
- Bertsekas et al. (1992) Dimitri P Bertsekas, Robert G Gallager, and Pierre Humblet. 1992. Data Networks. Vol. 2. Prentice-Hall International New Jersey.
- Binkert et al. (2011) Nathan Binkert et al. 2011. The Gem5 Simulator. SIGARCH Computer Architecture News (May. 2011).
- Bogdan and Marculescu (2010) Paul Bogdan and Radu Marculescu. 2010. Workload Characterization and Its Impact on Multicore Platform Design. In 2010 IEEE/ACM/IFIP International Conference on Hardware/Software Codesign and System Synthesis (CODES+ ISSS). 231–240.
- Bolch et al. (2006) Gunter Bolch, Stefan Greiner, Hermann De Meer, and Kishor S Trivedi. 2006. Queueing Networks and Markov Chains: Modeling and Performance Evaluation with Computer Science Applications. John Wiley & Sons.
- Borodin et al. (1997) Allan Borodin, Yuval Rabani, and Baruch Schieber. 1997. Deterministic Many-to-Many Hot Potato Routing. IEEE Transactions on Parallel and Distributed Systems 8, 6 (1997), 587–596.
- Brassil and Cruz (1995) Jack T Brassil and Rene L. Cruz. 1995. Bounds on Maximum Delay in Networks with Deflection Routing. IEEE Transactions on Parallel and Distributed Systems 6, 7 (1995), 724–732.
- Bucek et al. (2018) James Bucek, Klaus-Dieter Lange, and Jóakim v. Kistowski. 2018. SPEC CPU2017: Next-Generation Compute Benchmark. In Companion of the 2018 ACM/SPEC International Conference on Performance Engineering. 41–42.
- Fallin et al. (2011) Chris Fallin, Chris Craik, and Onur Mutlu. 2011. CHIPPER: A Low-Complexity Bufferless Deflection Router. In 2011 IEEE 17th International Symposium on High Performance Computer Architecture. 144–155.
- Fallin et al. (2012) Chris Fallin, Greg Nazario, Xiangyao Yu, Kevin Chang, Rachata Ausavarungnirun, and Onur Mutlu. 2012. MinBD: Minimally-buffered Deflection Routing for Energy-efficient Interconnect. In 2012 IEEE/ACM Sixth International Symposium on Networks-on-Chip. 1–10.
- Ghosh and Givargis (2003) Arijit Ghosh and Tony Givargis. 2003. Analytical Design Space Exploration of Caches for Embedded Systems. In 2003 Design, Automation and Test in Europe Conference and Exhibition. 650–655.
- Ghosh et al. (2010) Pavel Ghosh, Arvind Ravi, and Arunabha Sen. 2010. An Analytical Framework with Bounded Deflection Adaptive Routing for Networks-on-Chip. In 2010 IEEE Computer Society Annual Symposium on VLSI. 363–368.
- Henning (2006) John L Henning. 2006. SPEC CPU2006 Benchmark Descriptions. ACM SIGARCH Computer Architecture News 34, 4 (2006), 1–17.
- Jeffers et al. (2016) James Jeffers, James Reinders, and Avinash Sodani. 2016. Intel Xeon Phi Processor High Performance Programming: Knights Landing Edition. Morgan Kaufmann.
- Jiang et al. ([n.d.]) Nan Jiang et al. [n.d.]. A Detailed and Flexible Cycle-accurate Network-on-chip Simulator. In 2013 IEEE Intl. Symp. on Performance Analysis of Systems and Software (ISPASS). 86–96.
- Kashif and Patel (2014) Hany Kashif and Hiren Patel. 2014. Bounding Buffer Space Requirements for Real-time Priority-aware Networks. In 2014 19th Asia and South Pacific Design Automation Conference (ASP-DAC). 113–118.
- Kiasari et al. (2013) Abbas Eslami Kiasari, Zhonghai Lu, and Axel Jantsch. 2013. An Analytical Latency Model for Networks-on-Chip. IEEE Transactions on Very Large Scale Integration (VLSI) Systems 21, 1 (2013), 113–123.
- Kouvatsos and Luker (1984) DD Kouvatsos and PA Luker. 1984. ON THE ANALYSIS OF QUEUEING NETWORK MODELS: MAXIMUM ENTROPY AND SIMULATION. In UKSC 84. 488–496.
- Kouvatsos (1994) Demetres D Kouvatsos. 1994. Entropy Maximisation and Queuing Network Models. Annals of Operations Research 48, 1 (1994), 63–126.
- Leupers et al. (2011) Rainer Leupers, Lieven Eeckhout, Grant Martin, Frank Schirrmeister, Nigel Topham, and Xiaotao Chen. 2011. Virtual Manycore Platforms: Moving Towards 100+ Processor Cores. In 2011 Design, Automation & Test in Europe. IEEE, 1–6.
- Lu et al. (2006) Zhonghai Lu, Mingchen Zhong, and Axel Jantsch. 2006. Evaluation of On-chip Networks using Deflection Routing. In Proceedings of the 16th ACM Great Lakes Symposium on VLSI. 296–301.
- Mandal et al. (2020) Sumit K Mandal, Raid Ayoub, Michael Kishinevsky, Mohammad M Islam, and Umit Y Ogras. 2020. Analytical Performance Modeling of NoCs under Priority Arbitration and Bursty Traffic. IEEE Embedded Systems Letters (2020).
- Mandal et al. (2019) Sumit K Mandal, Raid Ayoub, Michael Kishinevsky, and Umit Y Ogras. 2019. Analytical Performance Models for NoCs with Multiple Priority Traffic Classes. ACM Transactions on Embedded Computing Systems (TECS) 18, 5s (2019).
- Moscibroda and Mutlu (2009) Thomas Moscibroda and Onur Mutlu. 2009. A Case for Bufferless Routing in On-chip Networks. In Proceedings of the 36th Annual International Symposium on Computer Architecture. 196–207.
- Ogras et al. (2010) Umit Y Ogras, Paul Bogdan, and Radu Marculescu. 2010. An Analytical Approach for Network-on-Chip Performance Analysis. IEEE Transactions on Computer-Aided Design of Integrated Circuits and Systems 29, 12 (2010), 2001–2013.
- Palesi and Givargis (2002) Maurizio Palesi and Tony Givargis. 2002. Multi-objective Design Space Exploration using Genetic Algorithms. In Proceedings of the tenth international symposium on Hardware/software codesign. 67–72.
- Petracca et al. (2009) Michele Petracca, Benjamin G Lee, Keren Bergman, and Luca P Carloni. 2009. Photonic NoCs: System-Level Design Exploration. IEEE Micro 29, 4 (2009), 74–85.
- Pujolle and Ai (1986) Guy Pujolle and Wu Ai. 1986. A Solution for Multiserver and Multiclass Open Queueing Networks. INFOR: Information Systems and Operational Research 24, 3 (1986), 221–230.
- Qian et al. (2015) Zhi-Liang Qian, Da-Cheng Juan, Paul Bogdan, Chi-Ying Tsui, Diana Marculescu, and Radu Marculescu. 2015. A Support Vector Regression (SVR)-based Latency Model for Network-on-Chip (NoC) Architectures. IEEE Transactions on Computer-Aided Design of Integrated Circuits and Systems 35, 3 (2015), 471–484.
- Rotem (2015) Efraim Rotem. 2015. Intel Architecture, Code Name Skylake Deep Dive: A New Architecture to Manage Power Performance and Energy Efficiency. In Intel Developer Forum.
- Vangal et al. (2008) Sriram R Vangal et al. 2008. An 80-tile sub-100-w teraflops processor in 65-nm cmos. IEEE Journal of Solid-State Circuits 43, 1 (2008), 29–41.
- Walraevens (2004) Joris Walraevens. 2004. Discrete-time Queueing Models with Priorities. Ph.D. Dissertation. Ghent University.
- Wentzlaff et al. (2007) David Wentzlaff et al. 2007. On-chip Interconnection Architecture of the Tile Processor. IEEE micro 27, 5 (2007), 15–31.
- Wu et al. (2010) Yulei Wu, Yulei Wu, Geyong Min, Mohamed Ould-Khaoua, Hao Yin, and Lan Wang. 2010. Analytical Modelling of Networks in Multicomputer Systems under Bursty and Batch Arrival Traffic. The Journal of Supercomputing 51, 2 (2010), 115–130.
- Yoo et al. (2002) Sungjoo Yoo, Gabriela Nicolescu, Lovic Gauthier, and Ahmed Amine Jerraya. 2002. Automatic Generation of Fast Timed Simulation Models for Operating Systems in SoC Design. In Proceedings 2002 Design, Automation and Test in Europe Conference and Exhibition. 620–627.