Penetration of a supersonic particle at the interface in a binary complex plasma
Abstract
The penetration of a supersonic particle at the interface was studied in a binary complex plasma. Inspired by the experiments performed in the PK-3 Plus Laboratory on board the International Space Station, Langevin dynamics simulations were carried out. The evolution of Mach cone at the interface was observed, where a kink of the lateral wake front was observed at the interface. By comparing the evolution of axial and radial velocity, we show that the interface solitary wave is non-linear. The dependence of the background particle dynamics in the vicinity of the interface on the penetration direction reveals that the disparity of the mobility may be the cause of various interface effects.
pacs:
52.27.Lw, 52.35.Mw, 68.35.JaA complex plasma is a weakly ionized gas containing small solid particles Fortov et al. (2005); Morfill and Ivlev (2009). The particles are highly charged by collecting ions and electrons. Using video microscopy, localized structures and dynamics can be directly recorded in the experiments. Various phenomena such as formation of crystal lattice Chu and I (1994); Thomas et al. (1994), wave phenomena Lin and I (2018); Schwabe et al. (2007); Merlino (2014); Bandyopadhyay et al. (2008); Thomas (2006); Williams (2014), and instabilities Schwabe et al. (2009); Couëdel et al. (2010) can be studied in complex plasmas. A binary complex plasma contains two types of microparticles of different sizes, which can either be mixed Huang et al. (2019); Du et al. (2019) or form a phase separated system Wysocki et al. (2010); Jiang et al. (2011); Du et al. (2012a). It was discovered that phase separation can still occur due to the different force balance for microparticles of different sizes under microgravity conditions despite the criteria of spinodal decomposition not being fulfilled Sütterlin et al. (2009); Killer et al. (2016). An interface between separated phases emerges and various interfacial phenomena are investigated Yang et al. (2017); Sun et al. (2018).
Recently, wakes excited by a moving disturbance in complex plasmas have attracted much attention Dubin (2000); Zhdanov et al. (2016); Nosenko et al. (2007); Du et al. (2014); Khrapak et al. (2019); Zhukhovitskii et al. (2015) since the first theoretical predictions Havnes et al. (1995, 1996). The disturbance can be imposed by either a laser beam Melzer et al. (2000); Nosenko et al. (2002) or extra particles Jiang et al. (2009); Caliebe et al. (2011); Schwabe et al. (2017). If the disturbance moves faster than the sound speed in the complex plasma, the wakes exhibit a V-shaped structure in two-dimensional (2D) case Samsonov et al. (1999, 2000) and a conical structure in three-dimensional (3D) case Jiang et al. (2009); Schwabe et al. (2011); Caliebe et al. (2011), known as Mach cone. In the ground laboratory, the particles are levitated in the (pre)sheath and form a 2D plasma crystal in the case of strong coupling conditions. The extra particles can travel either above or below the particle layer, exciting a repulsive or attractive Mach cone, respectively Samsonov et al. (1999); Du et al. (2012b). Under microgravity conditions, the particles form a relatively homogeneous 3D complex plasma. The penetration of the extra particles results in a moving disturbance inside the particle cloud, generating a 3D Mach cone if moving faster than the speed of sound Jiang et al. (2009); Schwabe et al. (2011); Zhukhovitskii et al. (2012); Zaehringer et al. (2018).
In this paper, we present a numerical simulation to study the evolution of a lateral wake excited by a supersonic extra particle at the interface, inspired by an experiment observation under microgravity conditions. The experiment was performed in the PK-3 Plus Laboratory on board the International Space Station (ISS). Technical details of the setup can be found in the Ref. Thomas et al. (2008). A neon plasma was produced by a capacitively-coupled radio-frequency (rf) generator in push-pull mode at MHz. The binary complex plasma was prepared by injecting two types of particles. The first type is melamine formaldehyde (MF) particles of a diameter of m, while the second type is SiO2 particles of a diameter of m. In addition, agglomerated larger particles were present on the outside of the particle cloud. Using video microscopy Thomas et al. (2008), a cross section of particle cloud (illuminated by a laser sheet) was recorded at a rate of frame-per-second (fps). The gas pressure was set at Pa, and the discharge voltage was set at V.
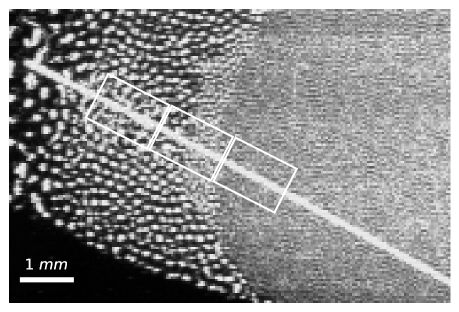
As we can see in Fig. 1, the particles of two types were phase-separated, mainly due to the difference of the ion drag force Killer et al. (2016). The small particles were confined on the right side, while the big particles were on the left side. The extra particle moved from the left to the right, leaving a straight trajectory across the interface. The driving force is still not fully understood Schwabe et al. (2011). It might be due to a rocket force acting on the extra particle Nosenko et al. (2010).
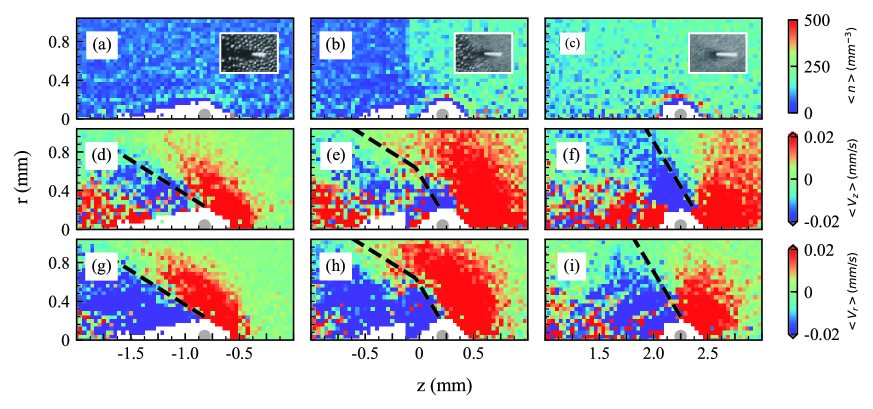
We employed the python library based on the SIFT feature detector algorithm Lowe (2004) to track the penetrating particle. It accelerated from mm/s to mm/s, and the velocity near the interface was mm/s 111The acceleration can also be revealed by the prolongation of the shape of the extra particle in the snapshot.. As we see in the insets of Fig. 2(a-c), a cavity around the supersonic particle appeared. The Mach cone structure of the lateral wake emerged as the extra particle crossed the interface. The structure became evident as its velocity reached mm/s, where the cone angle decreased dramatically.
However, due to the high density of the background particles, it is difficult to obtain the full details of individual particles in the cross section. In order to study the dynamics of this phenomenon quantitatively, we performed Langevin dynamics simulations, where the positions and velocities of each particle can be acquired easily Hou et al. (2009); Schwabe and Graves (2013). The equation of motion including damping from the neutral gas is given as
| (1) |
where is the position of the particle , is the mass, is the damping rate, and is the Langvin force. The Langevin force is defined by and , where is the temperature of the heat bath, is the delta function, and is the unit matrix. The particles interact with each other via the Yukawa potential,
| (2) |
where is the Debye length, is the charge of particle and the charge of a neighboring particle , separated by interparticle distance . The particle cloud was confined by the ion drag force directed in the negative z direction, and the confinement force resulted from the confinement potential . The ion drag force was assumed to be constant for small particles and for big particles, respectively. The confinement potential was assumed to be parabolic, i.e., , with a constant . As result, the particle cloud was phase separated with the small particles located to the right of the big particles, as we see in Fig. 1. The Langevin dynamics simulations were performed with small particles and big particles, using LAMMPS in NVE ensemble Plimpton (1995). The rest of the parameters were set as in Table 1 Thomas et al. (2008); Schwabe et al. (2018); Yang et al. (2017). Note that the simulation was performed in the Cartesian coordinate system, while the analysis was performed in cylindrical coordinates, considering the symmetry of the system.
. type [kg] [e] [s-1] [fN] [V/m2] [m] MF SiO2 extra - - - -
Despite the fact that the extra particle accelerated along its trajectory in the experiment, we set the velocity of the extra particle as constant in the simulation for simplicity. To focus on the effect of the extra particle on the interface, we select the penetration velocity as mm/s. The density distribution is shown in Fig. 2(a-c). Particle-free cavities are clearly seen around the extra particle, which are caused by its repulsion on the surrounding particles Khrapak et al. (2019). The cavity in the big particle cloud has a more elongated shape than that in the small particle cloud. However, it is truncated into two separated parts at the interface. This remarkable feature is caused by the fact that the small particles are much more mobile than the big particles so that they fill in the cavity at the interface before the big particles in the rear do. The radial and the axial velocity distribution of the background particles are shown in Fig. 2(b-d) and (g-i), respectively. Clearly, the sound speed in the big particle cloud is smaller than that in the small particle cloud, which results in a smaller angle of the Mach cone. The lateral wake front is kinked at the interface, highlighted by the dashed lines in Fig. 2(e,h).
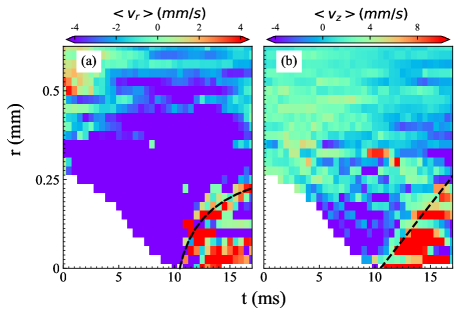
The penetration of the extra particle at the interface excited a solitary wave, propagating along the interface. We select all small particles within m from the interface in the simulation and obtain the evolution of the axial and radial velocity. For better resolution, the simulation was repeated times with different initial conditions, and the results were averaged. The results are shown in the periodgram in Fig. 3. As the extra particle left the interface, the cavity shrank instantaneously. The small particles moved towards the territory of the big particles, shown by the blue fraction in Fig. 2(b). As soon as the cavity was closed, a highly dissipative solitary wave was excited, propagating along the interface outwards. The propagation of this solitary wave was revealed by both the evolution of the radial and axial velocity, however, at a different pace. While the evolution of the axial velocity shows that the wave propagated at a constant speed, the evolution of the radial velocity shows the propagation slowed down. This implies the non-linearity of this solitary wave, whose propagation range is below m before it was dissipated.
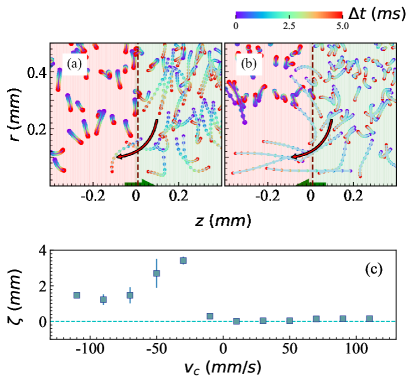
It is interesting to study the dependence of the reaction of the background particles in the vicinity of the interface on the penetration direction and speed. For this purpose, we performed a series of additional simulations in which we varied the speed and direction of the extra particle. We define the penetration depth as the maximal distance of the small particles entering the large particle cloud from the interface. A positive speed means that the extra particle moves from the cloud of big particles into that of small particles. As we can see in Fig. 4(c), for positive penetration speeds, the small particles barely crossed the interface and intruded into the territory of the big particles. In contrast, for negative speeds, the small particles followed the extra particle, filled the cavity, and intruded into the territory of the big particles. At mm/s, the small particles reached the deepest depth. However, when the speed of the penetrating particles became even faster, the depth decreased and finally reached saturation. This is caused by the differences of the particles on the two sides of the interface, in terms of the mass, damping rate, as well as the strength of the interaction. These factors lead to the disparity of the particle mobility so that the small particles react with greater magnitude than big particles to the disturbances in the stimulations. In fact, this may be the essential cause of various interface effects such as reflection of waves at interfaces.
In conclusion, we performed Langevin dynamics simulations to study the penetration of a supersonic particle at an interface in a binary complex plasma. The Mach cone structure was observed, where a kink emerged at the interface. By studying the dependence of the reaction of the background particles in the vicinity of the interface on the penetration direction and speed, we show that the disparity of the mobility may be the cause of various interface effects.
The authors acknowledge support from the National Natural Science Foundation of China (NSFC), Grant No. 11975073. The PK-3 Plus project was funded by the space agency of the Deutsches Zentrum für Luft- und Raumfahrt e.V. with funds from the Federal Ministry for Economy and Technology according to a resolution of the Deutscher Bundestag under Grant No. 50WP1203. The authors acknowledge Roscosmos provided the PK-3 Plus laboratory launch and operation onboard of ISS. We would like to thank V. Nosenko for carefully checking the manuscript.
References
- Fortov et al. (2005) V. Fortov, A. Ivlev, S. Khrapak, A. Khrapak, and G. Morfill, Physics Reports 421, 1 (2005), ISSN 0370-1573, URL http://www.sciencedirect.com/science/article/pii/S0370157305003339.
- Morfill and Ivlev (2009) G. E. Morfill and A. V. Ivlev, Rev. Mod. Phys. 81, 1353 (2009), URL https://link.aps.org/doi/10.1103/RevModPhys.81.1353.
- Chu and I (1994) J. H. Chu and L. I, Phys. Rev. Lett. 72, 4009 (1994), URL https://link.aps.org/doi/10.1103/PhysRevLett.72.4009.
- Thomas et al. (1994) H. Thomas, G. E. Morfill, V. Demmel, J. Goree, B. Feuerbacher, and D. Möhlmann, Phys. Rev. Lett. 73, 652 (1994), URL https://link.aps.org/doi/10.1103/PhysRevLett.73.652.
- Lin and I (2018) P.-C. Lin and L. I, Phys. Rev. Lett. 120, 135004 (2018), URL https://link.aps.org/doi/10.1103/PhysRevLett.120.135004.
- Schwabe et al. (2007) M. Schwabe, M. Rubin-Zuzic, S. Zhdanov, H. M. Thomas, and G. E. Morfill, Phys. Rev. Lett. 99, 095002 (2007).
- Merlino (2014) R. L. Merlino, Journal of Plasma Physics 80, 773 (2014).
- Bandyopadhyay et al. (2008) P. Bandyopadhyay, G. Prasad, A. Sen, and P. K. Kaw, Phys. Rev. Lett. 101, 065006 (2008).
- Thomas (2006) E. Thomas, Physics of Plasmas 13, 042107 (2006).
- Williams (2014) J. D. Williams, Phys. Rev. E 89, 023105 (2014).
- Schwabe et al. (2009) M. Schwabe, M. Rubin-Zuzic, S. Zhdanov, A. V. Ivlev, H. M. Thomas, and G. E. Morfill, Phys. Rev. Lett. 102, 255005 (2009), URL https://link.aps.org/doi/10.1103/PhysRevLett.102.255005.
- Couëdel et al. (2010) L. Couëdel, V. Nosenko, A. V. Ivlev, S. K. Zhdanov, H. M. Thomas, and G. E. Morfill, Phys. Rev. Lett. 104, 195001 (2010), URL https://link.aps.org/doi/10.1103/PhysRevLett.104.195001.
- Huang et al. (2019) H. Huang, A. V. Ivlev, V. Nosenko, Y.-F. Lin, and C.-R. Du, Physics of Plasmas 26, 013702 (2019), eprint https://doi.org/10.1063/1.5079289, URL https://doi.org/10.1063/1.5079289.
- Du et al. (2019) C.-R. Du, V. Nosenko, H. M. Thomas, Y.-F. Lin, G. E. Morfill, and A. V. Ivlev, Phys. Rev. Lett. 123, 185002 (2019), URL https://link.aps.org/doi/10.1103/PhysRevLett.123.185002.
- Wysocki et al. (2010) A. Wysocki, C. Räth, A. V. Ivlev, K. R. Sütterlin, H. M. Thomas, S. Khrapak, S. Zhdanov, V. E. Fortov, A. M. Lipaev, V. I. Molotkov, et al., Phys. Rev. Lett. 105, 045001 (2010), URL https://link.aps.org/doi/10.1103/PhysRevLett.105.045001.
- Jiang et al. (2011) K. Jiang, L. Hou, A. V. Ivlev, Y. Li, K. R. Sutterlin, H. M. Thomas, and G. E. Morfill, IEEE Transactions on Plasma Science 39, 2752 (2011), ISSN 1939-9375.
- Du et al. (2012a) C.-R. Du, K. R. Sütterlin, K. Jiang, C. Räth, A. V. Ivlev, S. Khrapak, M. Schwabe, H. M. Thomas, V. E. Fortov, A. M. Lipaev, et al., New Journal of Physics 14, 073058 (2012a), URL https://doi.org/10.1088/2F1367-2630/2F14/2F7/2F073058.
- Sütterlin et al. (2009) K. R. Sütterlin, A. Wysocki, A. V. Ivlev, C. Räth, H. M. Thomas, M. Rubin-Zuzic, W. J. Goedheer, V. E. Fortov, A. M. Lipaev, V. I. Molotkov, et al., Phys. Rev. Lett. 102, 085003 (2009), URL https://link.aps.org/doi/10.1103/PhysRevLett.102.085003.
- Killer et al. (2016) C. Killer, T. Bockwoldt, S. Schütt, M. Himpel, A. Melzer, and A. Piel, Phys. Rev. Lett. 116, 115002 (2016), URL https://link.aps.org/doi/10.1103/PhysRevLett.116.115002.
- Yang et al. (2017) L. Yang, M. Schwabe, S. Zhdanov, H. M. Thomas, A. M. Lipaev, V. I. Molotkov, V. E. Fortov, J. Zhang, and C.-R. Du, EPL (Europhysics Letters) 117, 25001 (2017), URL https://doi.org/10.1209/2F0295-5075/2F117/2F25001.
- Sun et al. (2018) W. Sun, M. Schwabe, H. M. Thomas, A. M. Lipaev, V. I. Molotkov, V. E. Fortov, Y. Feng, Y.-F. Lin, J. Zhang, Y. Guo, et al., EPL (Europhysics Letters) 122, 55001 (2018), URL https://doi.org/10.1209/2F0295-5075/2F122/2F55001.
- Dubin (2000) D. H. E. Dubin, Physics of Plasmas 7, 3895 (2000), eprint https://aip.scitation.org/doi/pdf/10.1063/1.1308078, URL https://aip.scitation.org/doi/abs/10.1063/1.1308078.
- Zhdanov et al. (2016) S. Zhdanov, C.-R. Du, M. Schwabe, V. Nosenko, H. M. Thomas, and G. E. Morfill, EPL (Europhysics Letters) 114, 55002 (2016), URL https://doi.org/10.1209/2F0295-5075/2F114%2F55002.
- Nosenko et al. (2007) V. Nosenko, S. Zhdanov, and G. Morfill, Phys. Rev. Lett. 99, 025002 (2007), URL https://link.aps.org/doi/10.1103/PhysRevLett.99.025002.
- Du et al. (2014) C.-R. Du, V. Nosenko, S. Zhdanov, H. M. Thomas, and G. E. Morfill, Phys. Rev. E 89, 021101 (2014), URL https://link.aps.org/doi/10.1103/PhysRevE.89.021101.
- Khrapak et al. (2019) S. Khrapak, P. Huber, H. Thomas, V. Naumkin, V. Molotkov, and A. Lipaev, Phys. Rev. E 99, 053210 (2019), URL https://link.aps.org/doi/10.1103/PhysRevE.99.053210.
- Zhukhovitskii et al. (2015) D. I. Zhukhovitskii, V. E. Fortov, V. I. Molotkov, A. M. Lipaev, V. N. Naumkin, H. M. Thomas, A. V. Ivlev, M. Schwabe, and G. E. Morfill, Physics of Plasmas 22, 023701 (2015), eprint https://doi.org/10.1063/1.4907221, URL https://doi.org/10.1063/1.4907221.
- Havnes et al. (1995) O. Havnes, T. Aslaksen, T. W. Hartquist, F. Li, F. Melandso, G. E. Morfill, and T. Nitter, Journal of Geophysical Research: Space Physics 100, 1731 (1995), URL https://agupubs.onlinelibrary.wiley.com/doi/abs/10.1029/94JA02729.
- Havnes et al. (1996) O. Havnes, F. Li, F. Melandso, T. Aslaksen, T. W. Hartquist, G. E. Morfill, T. Nitter, and V. Tsytovich, Journal of Vacuum Science & Technology A 14, 525 (1996), eprint https://doi.org/10.1116/1.580119, URL https://doi.org/10.1116/1.580119.
- Melzer et al. (2000) A. Melzer, S. Nunomura, D. Samsonov, Z. W. Ma, and J. Goree, Phys. Rev. E 62, 4162 (2000), URL https://link.aps.org/doi/10.1103/PhysRevE.62.4162.
- Nosenko et al. (2002) V. Nosenko, J. Goree, Z. W. Ma, and A. Piel, Phys. Rev. Lett. 88, 135001 (2002), URL https://link.aps.org/doi/10.1103/PhysRevLett.88.135001.
- Jiang et al. (2009) K. Jiang, V. Nosenko, Y. F. Li, M. Schwabe, U. Konopka, A. V. Ivlev, V. E. Fortov, V. I. Molotkov, A. M. Lipaev, O. F. Petrov, et al., EPL (Europhysics Letters) 85, 45002 (2009).
- Caliebe et al. (2011) D. Caliebe, O. Arp, and A. Piel, Physics of Plasmas 18, 073702 (2011), eprint https://doi.org/10.1063/1.3606468, URL https://doi.org/10.1063/1.3606468.
- Schwabe et al. (2017) M. Schwabe, S. Zhdanov, T. Hagl, P. Huber, A. M. Lipaev, V. I. Molotkov, V. N. Naumkin, M. Rubin-Zuzic, P. V. Vinogradov, E. Zaehringer, et al., New Journal of Physics 19, 103019 (2017), URL https://doi.org/10.1088/2F1367-2630/2Faa868c.
- Samsonov et al. (1999) D. Samsonov, J. Goree, Z. W. Ma, A. Bhattacharjee, H. M. Thomas, and G. E. Morfill, Phys. Rev. Lett. 83, 3649 (1999), URL https://link.aps.org/doi/10.1103/PhysRevLett.83.3649.
- Samsonov et al. (2000) D. Samsonov, J. Goree, H. M. Thomas, and G. E. Morfill, Phys. Rev. E 61, 5557 (2000), URL https://link.aps.org/doi/10.1103/PhysRevE.61.5557.
- Schwabe et al. (2011) M. Schwabe, K. Jiang, S. Zhdanov, T. Hagl, P. Huber, A. V. Ivlev, A. M. Lipaev, V. I. Molotkov, V. N. Naumkin, K. R. Sütterlin, et al., EPL (Europhysics Letters) 96, 55001 (2011), URL https://doi.org/10.1209/2F0295-5075/2F96/2F55001.
- Du et al. (2012b) C.-R. Du, V. Nosenko, S. Zhdanov, H. M. Thomas, and G. E. Morfill, EPL (Europhysics Letters) 99, 55001 (2012b), URL https://doi.org/10.1209/2F0295-5075/2F99/2F55001.
- Zhukhovitskii et al. (2012) D. I. Zhukhovitskii, V. E. Fortov, V. I. Molotkov, A. M. Lipaev, V. N. Naumkin, H. M. Thomas, A. V. Ivlev, M. Schwabe, and G. E. Morfill, Phys. Rev. E 86, 016401 (2012).
- Zaehringer et al. (2018) E. Zaehringer, M. Schwabe, S. Zhdanov, D. P. Mohr, C. A. Knapek, P. Huber, I. L. Semenov, and H. M. Thomas, Physics of Plasmas 25, 033703 (2018), eprint https://doi.org/10.1063/1.5022773, URL https://doi.org/10.1063/1.5022773.
- Thomas et al. (2008) H. M. Thomas, G. E. Morfill, V. E. Fortov, A. V. Ivlev, V. I. Molotkov, A. M. Lipaev, T. Hagl, H. Rothermel, S. A. Khrapak, R. K. Sütterlin, et al., New Journal of Physics 10, 033036 (2008), URL https://doi.org/10.1088/2F1367-2630/2F10/2F3/2F033036.
- Nosenko et al. (2010) V. Nosenko, A. V. Ivlev, and G. E. Morfill, Phys. Plasmas 17, 123705 (2010).
- Lowe (2004) D. G. Lowe, International Journal of Computer Vision 60, 91 (2004), ISSN 1573-1405, URL https://doi.org/10.1023/B:VISI.0000029664.99615.94.
- Hou et al. (2009) L. J. Hou, Z. L. Miskovic, A. Piel, and P. K. Shukla, Physics of Plasmas 16, 053705 (2009), eprint https://doi.org/10.1063/1.3138746, URL https://doi.org/10.1063/1.3138746.
- Schwabe and Graves (2013) M. Schwabe and D. B. Graves, Phys. Rev. E 88, 023101 (2013), URL https://link.aps.org/doi/10.1103/PhysRevE.88.023101.
- Plimpton (1995) S. Plimpton, Journal of Computational Physics 117, 1 (1995), ISSN 0021-9991, URL http://www.sciencedirect.com/science/article/pii/S002199918571039X.
- Schwabe et al. (2018) M. Schwabe, C.-R. Du, P. Huber, A. M. Lipaev, V. I. Molotkov, V. N. Naumkin, S. K. Zhdanov, D. I. Zhukhovitskii, V. E. Fortov, and H. M. Thomas, Microgravity Science and Technology 30, 581 (2018), ISSN 1875-0494, URL https://doi.org/10.1007/s12217-018-9602-0.