Optimizing Product Provenance Verification
using Data Valuation Methods
Abstract.
Determining and verifying product provenance remains a critical challenge in global supply chains, particularly as geopolitical conflicts and shifting borders create new incentives for misrepresentation of commodities, such as hiding the origin of illegally harvested timber or agriculture grown on illegally cleared land. Stable Isotope Ratio Analysis (SIRA), combined with Gaussian process regression-based isoscapes, has emerged as a powerful tool for geographic origin verification. However, the effectiveness of these models is often constrained by data scarcity and suboptimal dataset selection. In this work, we introduce a novel data valuation framework designed to enhance the selection and utilization of training data for machine learning models applied in SIRA. By prioritizing high-informative samples, our approach improves model robustness and predictive accuracy across diverse datasets and geographies. We validate our methodology with extensive experiments, demonstrating its potential to significantly enhance provenance verification, mitigate fraudulent trade practices, and strengthen regulatory enforcement of global supply chains.
1. Introduction
Global natural resource supply chains are opaque, especially since natural resources are often transformed from raw materials into finished consumer-facing products. These complex supply chains often involve multiple countries, with intermediate outputs being traded internationally and being used as inputs into further manufacturing processes. In addition to business-commerce decisions driving supply chain sourcing, the economics of natural resource trade are often closely linked with geopolitics. Determining and verifying product provenance is a challenge in global supply chains, as geopolitics and the lure of “don’t ask, don’t tell” with respect to the ecological and social cost creates incentives for misrepresentation of commodities, such as hiding the origin of illegally harvested timber or agriculture grown on illegally cleared land.
Product identification and provenance verification of traded natural resources have emerged as promising research areas, with various combinations of methods used based on the specific natural resource sector and the level of granularity of species identification and origin-provenance determination. For example, for wood and forest products, determining species identification and geographic harvest provenance requires utilizing multiple testing methods and tools (Corruption, 2021; Schmitz et al., 2020; Dormontt et al., 2015). Specific to geographic origin verification, Stable Isotope Ratio Analysis (SIRA), combined with Gaussian process regression-based isoscapes has emerged as a powerful tool (Truszkowski et al., 2025; Mortier et al., 2024).
SIRA can be useful for understanding the origin of organic products. Stable isotopes are chemical variants of elements that do not undergo radioactive decay. The ratio of stable isotopes denotes the relative enrichment of different elemental stable isotopes in a sample which is typically measured by mass spectrometry (Barrie and Prosser, 1996) and allows us to understand the enrichment of these isotopes in that sample. The natural variation observed for this ratio is determined by underlying mechanisms that are affected by a range of different factors including but not limited to environmental, atmospheric, soil, metabolic fraction, or other characteristics specific to a species (Siegwolf et al., 2022; Wang et al., 2021; Vystavna et al., 2021). Previous work has shown how it can be used to trace the origin of items such as timber, seafood, agricultural products, and cotton (Truszkowski et al., 2025; Mortier et al., 2024; Watkinson et al., 2022; Cusa et al., 2022; Wang et al., 2020; Meier-Augenstein et al., 2014).
However, the effectiveness of these models is often constrained by data scarcity and suboptimal dataset selection. The use of SIRA to identify origin is limited by several factors, though chief among them is the limited number of reference samples used as input data for modeling isoscapes. Reference sampling campaigns are expensive, and often sampling locations are chosen based on ease of sampling rather than areas that yield a gain in model prediction accuracy (Gasson et al., 2021). There is a need to optimize reference sample collection efforts, in such a way that would enable the ability to “value” reference samples thus enabling more judicious sample collection campaigns.
Here, we introduce a novel data valuation framework designed to enhance the selection and utilization of training data for machine learning models applied to SIRA. Our key contributions are:
-
(1)
We bring the growing literature on data valuation in machine learning to bear upon the pressing problem of optimizing product provenance verification. By prioritizing highly informative samples, our approach improves model robustness and predictive accuracy across diverse datasets and geographies.
-
(2)
We have deployed our approach of optimizing the selection of training samples which improves our model accuracy. These new models are being used by European enforcement agencies to stop the trade in sanctioned Russian timber by demonstrating that a claimed harvest location other than Russia is not viable. See coverage of our work from the New York Times (Nazaryan, 2024). Due to confidentiality reasons, we use a global dataset of Oak (Quercus spp.) reference samples to illustrate our methodology.
-
(3)
We validate our methodology with extensive experiments, demonstrating its potential to significantly enhance valuation of data, improve the configuration of models, and in this manner strengthen regulatory enforcement of global supply chains.
2. Related Work
SIRA has been widely employed to discriminate geographic origin of various plant and animal-based products in global supply chains, such as garlic (Pianezze et al., 2019), Chinese tea (Liu et al., 2020), olive oil (Bontempo et al., 2019), cheese (Camin et al., 2004), and timber (Mortier et al., 2024; Truszkowski et al., 2025). By bringing data valuation methods to bear upon SIRA pipelines we aim to improve the verification of product provenance.
Prior work in data valuation is typically seen in the context of explainable machine learning and enhancing model performance (Wu et al., 2024; Covert et al., 2024). Existing methods primarily rely on leave-one-out retraining and influence functions (Koh and Liang, 2017), Shapley values (Jia et al., 2019; Ghorbani and Zou, 2019; Wang and Jia, 2023), Least Cores (Yan and Procaccia, 2021), the Banzhaf value (Wang and Jia, 2022), Beta Shapley (Kwon and Zou, 2021), and reinforcement learning (Yoon et al., 2020). Furthermore, data valuation has been applied across various domains to enhance model development and interpretability, including health data (Pandl et al., 2021), medical imaging (Tang et al., 2021), and the Internet of Things (Shi and Duan, 2024). This paper is the first to formally apply data valuation techniques to SIRA.
3. Methods
3.1. Notation
Let be a set of locations where data is collected, where typically is specified by a longitude and latitude. Let be the set of measurements made over , here denoting stable isotope ratio values (e.g. , , , , ), or trace element values (e.g. Si, Cu, S, Ba, Rb). We denote and as functions of interest (defined below). For evaluation purposes, we split our data into training and test datasets, where represents the training dataset with data points and . Similarly, denotes the test dataset with data points. We let denote the performance of the model trained on a dataset and evaluated on the dataset , where would return a numerical value, . In cases when the function and the test dataset are known, we drop the dependence in the notation to simply say .
3.2. Forward and Backward Models
Forward Models.
For the forward model, the task is to predict the stable isotope values for a given location, i.e., . The motivation is to verify whether the characteristics of the location (denoting specified harvest origin) would align with general isotopic values associated with the specified location. Such models can be decision trees, random forests, or XGBoost to fit such functions. Recent works have proposed using Gaussian process regression models with high performance (Truszkowski et al., 2025; Mortier et al., 2024).
Backward Models.
In the backward case, one wants to identify the location given measured stable isotope values. We model this relation as . The fitted model would help identify whether the declared harvest location of a species sample aligns with the predicted location from . Similarly, here, one can use a range of machine learning models to fit this function. Moreover, Mortier et al. (2024) reversed the fitted Gaussian process regression models using the Bayes’ rule to predict locations from measured isotope ratios.
Atmospheric Variables.
In addition, to support either forward or backward models, we often have available a range of atmospheric variables associated with locations. Such variables can be used as either additional inputs to a forward model or auxiliary information in a backward model.
Random Forest Models.
Random forests (RF) offer a robust and versatile approach for both forward and backward modeling in this context. As an ensemble learning method, it leverages the power of multiple decision trees to improve prediction accuracy and reduce overfitting. For the forward model , an RF constructs decision trees . Each tree is trained on a bootstrap sample of the training dataset , where is obtained by randomly sampling data points from with replacement. Furthermore, during the construction of each tree , specifically at each node split, a random subset of features is considered from the full feature space . Let be the number of features randomly sampled at each split (). For a given location , each tree provides a prediction . The final RF prediction is then obtained by aggregating these individual predictions, typically through averaging for regression tasks:
where denotes the prediction of the -th tree trained on bootstrap dataset and using random feature subsets at each split. Similarly, for the backward model , an RF comprised of trees can be trained. Each tree is trained on a bootstrap sample of to predict the location based on features , again using random feature subsets from at each split. The ensemble prediction for the backward model given a feature vector is calculated as:
Here, represents the prediction of the -th tree for the backward model, trained on bootstrap sample and using random feature subsets during tree construction. The performance and can then be evaluated for the forward and backward random forest models, respectively, using the provided metric .
Gaussian Process Regression Models.
Gaussian process regression (GPR) models, as explored by (Truszkowski et al., 2025; Mortier et al., 2024), offer a powerful approach for both forward and backward modeling settings. For the forward model , GPR can be used to predict isotope ratios at a given location . We can construct “isoscapes” by fitting independent GP regression models to each feature in . Considering our training dataset , for each feature , a GP model is trained to predict isotope values at a new location . The predicted distribution for the feature at location is Gaussian, with a mean and variance given by:
Here, represents the training locations and are the values of the -th feature in the training set. is the baseline mean for feature , is the covariance matrix evaluated at all pairs of training locations, is the covariance vector between the test location and the training locations, is the covariance of with itself, and is the noise variance for feature . For the backward model , we leverage Bayesian inference to reverse the prediction. Given a set of features from a location of unknown origin, the posterior probability of its origin being location is calculated using Bayes’ theorem:
The likelihood is derived from the forward GP model, assuming independence of features and using the predicted Gaussian distributions:
The prior can incorporate prior knowledge about the distribution of tree harvest locations. This Bayesian approach provides a posterior probability map over , indicating the most likely origin locations for an observation with features . The performance of both forward and backward GPR models can be assessed using the metric , where is the GPR model ( or ).
Performance Metrics.
The primary metric we will employ is:
where is the great circle distance. Comparing RMSE across different GP models helps identify which model minimizes large prediction errors and provides overall reliable estimates.
3.3. Data Valuation
Data valuation is crucial for understanding the contribution of individual training samples to the performance of trained models for timber provenance. The Shapley value, introduced by (Shapley, 1953), offers a principled approach to quantify this contribution, identifying both highly informative and potentially detrimental data points. The Shapley value, , for a data point is computed as the weighted average of its marginal contribution to model performance across all possible subsets of the training data:
Here, is the full training set, is a subset excluding , and is the model performance (e.g., negative mean absolute error) when trained on subset . High positive Shapley values indicate highly valuable data points that significantly improve performance, while low or negative values suggest redundancy or detrimental effects, possibly due to outliers, measurement errors, or model misspecification. The Shapley value is not an arbitrary metric; it is uniquely characterized by satisfying a set of desirable axioms, ensuring fairness and consistency in data valuation:
-
(1)
Efficiency: The sum of the Shapley values for all data points equals the difference in performance between the model trained on the full dataset and the model trained on an empty dataset: . This means the total value is fully distributed among the data points.
-
(2)
Symmetry (or Null Player): If a data point has zero marginal contribution to every possible subset (i.e., for all ), then its Shapley value is zero: . Useless data points receive zero value.
-
(3)
Linearity: If the performance metric is a linear combination of two other performance metrics, , then the Shapley values for are the same linear combination of the Shapley values for and . This ensures consistency across different performance measures.
-
(4)
Dummy: if two data points and always have the same marginal contribution to every subset of then their Shapley value must be equal. .
These axioms provide a strong theoretical justification for using the Shapley value. Furthermore, the Shapley value can be equivalently expressed as a sum over permutations of the dataset (Shapley, 1953):
where is the set of all permutations of data points in , is a permutation sampled uniformly at random from , and is the set of data points preceding instance in permutation .
Truncated Monte Carlo Shapley Value. The exact computation of Shapley values is computationally prohibitive due to the factorial term, requiring evaluation of subsets. We address this shortcoming by employing the Truncated Monte Carlo Shapley estimation. This method, proposed in (Ghorbani and Zou, 2019), approximates the Shapley values by randomly sampling a limited number of subsets instead of exhaustively considering all possibilities. The key idea is that each random permutation provides an unbiased estimate of the marginal contribution of each data point. By averaging these estimates over multiple permutations, the approximation converges to the true Shapley values. The number of iterations controls the trade-off between computational cost and accuracy. Algorithm 1 shows each step in detail.
By employing the data Shapley value, particularly with the Truncated Monte Carlo approximation, we can gain valuable insights into the training data, identify influential samples, diagnose potential issues, and ultimately improve the accuracy and robustness of their GP-based timber provenance models. This data-centric approach, grounded in a strong axiomatic foundation, complements model-centric evaluations and facilitates a more efficient use of resources for data collection and model refinement.
3.4. Data Selection with Shapley Values
Acquiring high-quality isotope values for model training is a significant expense. Furthermore, standard data valuation techniques reveal a critical issue: not all data points contribute equally to predictive performance. In fact, some points may even be detrimental. Therefore, our objective is to strategically select a subset from the original training data that maximizes model accuracy for both forward and backward prediction tasks. We propose to leverage Shapley values computed once on the full dataset to identify data point importance. We hypothesize that by using these initial global valuations, we can efficiently identify and sequentially remove less valuable samples. Our data selection methodology consists of three distinct steps. Initially, we compute data values for all points in using the entire dataset. Subsequently, we sort the data points and remove the least valuable one according to these pre-calculated values. Finally, we evaluate the model’s performance using the test dataset. This sequential removal process continues as long as model performance improves, relying on the initial single valuation. Please refer to Algorithm 2 for a detailed algorithmic description. This simplified data selection method offers a computationally efficient approach to valuation, aiming to maximize model performance while minimizing the need for costly and potentially redundant data acquisition through a single valuation and sequential removal strategy.
4. Experiments
Our experiments are aimed at answering the below questions:
-
(1)
RQ1: What is the role of data Shapley values in the domain of SIRA? (Section 4.3)
-
(2)
RQ2: How does model architecture influence data Shapley values and the performance of the proposed data valuation framework? (Section 4.4)
-
(3)
RQ3: Can the proposed data valuation framework enhance outcomes in cases involving data imputation for missing or noisy data? (Section 4.5)
-
(4)
RQ4: Can data selection methods based on data valuation improve the performance of both directions in SIRA? (Section 4.6)
-
(5)
RQ5: Given a specific model and data valuation framework, what level of granularity is optimal for effective data selection? (Section 4.7)
-
(6)
RQ6: Do different genera and species within the dataset exhibit varying data Shapley values? Can we identify the most and least important genera or species within the dataset? (Section 4.8)
4.1. Datasets
We utilized data from two datasets of the genus Quercus, collected from various regions worldwide. Two broad datasets were combined in this study with the first dataset comprising tree samples distributed globally, while the second dataset was focuses specifically on European countries. Stable isotope ratio measurements were performed following the protocols outlined in (Watkinson et al., 2020; Boner et al., 2007).


4.2. Data Valuation and Selection
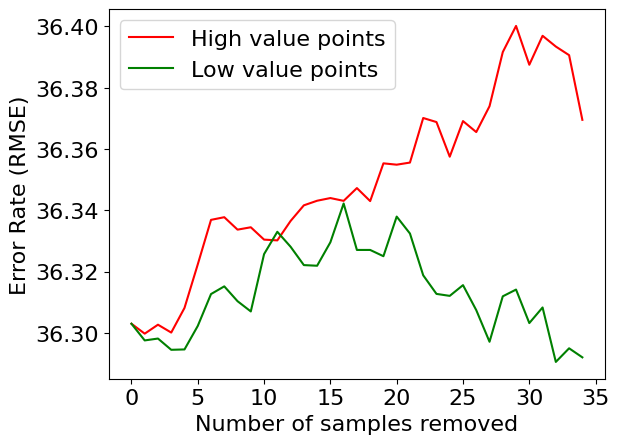
As described in Section 3, the objective of data valuation is to strategically select subsets of the dataset that maximize model performance. Instead of solely selecting the most valuable data points, we implement an iterative approach. Given a dataset consisting of data points and their corresponding data Shapley values , we conduct experiments by removing the low value data points , where the data Shapley value satisfies , or equivalently, . Furthermore, we extend our experiments by investigating the opposite case: removing the high-value data points , where the Shapley value satisfies , or equivalently, . We then evaluate model performance and analyze how the data valuation framework influences the overall model behavior. We report the root mean square error (RMSE) for all performance plots, defined as , where and represent the actual and predicted multivariate outputs involving variables or , on both forward and backward directions.
4.3. RQ1: Role of Data Shapley Values in SIRA
For this experiment, we explore the relevance and application of data Shapley values in the context of SIRA. Fig. 1 presents distribution plots for one subset of the dataset, evaluated in both directions of SIRA analysis, i.e., forward and backward, as described in Section 3. This analysis highlights a significant variation in data Shapley values depending on the dataset and the machine learning model utilized. These results indicate that subsets with Shapley values exhibiting greater extremities will correspond to larger performance gains following the data selection process.
4.4. RQ2: Influence of Model Architecture
We conducted two types of experiments, removing both high value and low value data points, as described in Section 4.2. We present the error plots showing the effect of removing these two types of data points for Gaussian process regression and random forest models. In both models, the RMSE increases (indicating performance degradation) when data points with high Shapley values are removed. Similarly, the RMSE decreases (indicating performance improvement) or remains stable when data points with low Shapley values are removed (Figure 2(a) and Figure 2(b)). Figure 2(c) illustrates one such case, where performance improves by removing specific data points (marked as red x on the map).
We further investigate whether the Shapley values from two different models agree with each other. We present three types of rank comparison plots in Figure 2(d-f). All three representations demonstrate a high degree of agreement between the two models in this experiment, indicating that data value ranks can remain consistent across different model architectures.
4.5. RQ3: Data Valuation to support Missing Data Imputation
We conduct experiments with two types of approaches for handling missing data: (i) median imputation, where missing values are replaced with the median of the dataset, and (ii) listwise deletion, where data points containing missing values are excluded entirely from the training process. Additionally, we perform data selection experiments by removing both high-value and low-value data points and comparing the corresponding performance rankings.
We conducted experiments involving the removal of both high-value and low-value data points, as described in Section 4.2. The error plots (Figures 3(a) and 3(b)) illustrate the effects of removing these data points under both missing data handling strategies. For both strategies, the RMSE increases (indicating performance degradation) when data points with high Shapley values are removed. Conversely, the RMSE decreases (indicating performance improvement) or remains stable when data points with low Shapley values are removed.
We observe significant performance improvements when low-value data points are removed from both strategies, with the improvement being more pronounced for median imputation (26.66%) compared to listwise deletion (5.88%). This result demonstrates the effectiveness of data valuation as a strategy for improving missing data handling. Moreover, the Shapley values for the median imputation strategy exhibit higher magnitudes compared to listwise deletion (Figures 3(c) and 3(d)), which aligns with the greater performance improvements observed for median imputation.
4.6. RQ4: Data Selection Methods for Forward and Backward directions in SIRA
In this experiment, we investigate whether selecting data based on valuation metrics can improve performance in both directions of SIRA. For this analysis, we present the results of applying the random forest model in both forward and backward directions using two distinct datasets: USA-only data and Europe-only data.
USA-only data: We present the error plots showing the effect of removing high-value versus low-value data points on the performance of the random forest model. In both directions, the RMSE increases (indicating performance degradation) when data points with high Shapley values, are removed. Similarly, the RMSE either decreases (indicating performance improvement) or remains stable when data points with low Shapley values, are removed (Figures 5(a) and 5(b)). Figure 5(c) illustrates a specific case where performance improves following the removal of certain data points, marked as red x on the map.
We observe performance improvements when low-value data points are removed from the dataset, with the improvement being more pronounced in the backward direction (27.13%) compared to the forward direction (0.14%). This finding demonstrates that performance improvement can indeed vary depending on the direction of SIRA. Moreover, consistent with the observations made in Section 4.5, the Shapley values associated with the backward direction exhibit higher magnitudes compared to the forward direction (Figure 1), which aligns with the greater performance improvements observed for the backward direction.
We further investigate whether the Shapley values from both directions show agreement. To this end, we present three types of rank comparison plots in Figure 5(d-f). All three representations indicate a high degree of agreement between the two directions, suggesting that data value ranks remain relatively consistent across different directions of SIRA.
Europe-only data: We conduct the same set of experiments and analyses on the Europe-only dataset. Similar patterns of performance improvement and deterioration are observed when low-value and high-value data points are removed, respectively (Figure 6). In the backward direction, performance improved by 5.08%, while in the forward direction, it improved by 7.81%.
We also compared the Shapley value ranks of the data points. For the Europe-only dataset, the similarities were less ideal than other cases, indicating that the ranking of data importance can differ across directions in different datasets. Figure 6(d-f) illustrates the corresponding plots for this case.
4.7. RQ5: Optimal Granularity in Data Selection
Here, we analyze the appropriate level of granularity for data selection to maximize performance when using a specific model and a data valuation framework. Instead of removing one data point at a time, we consider clusters of fixed distances (in kilometers) and remove all data points within that distance if a data point is selected for removal during the data selection process. We performed this location-based data selection for both high value (Figure 4(b)) and low value (Figure 4(a)) data points to understand the impact on model performance.
Consistent with the results of previous experiments, we observe performance improvements when low-value data points are removed. Furthermore, the cluster-based removal approach enhances the model’s performance more effectively than the one-by-one removal approach. This finding suggests that certain regions within the dataset are not essential for the best-performing model, or the improvements may be attributed to errors in the data extraction pipelines affecting specific regions.
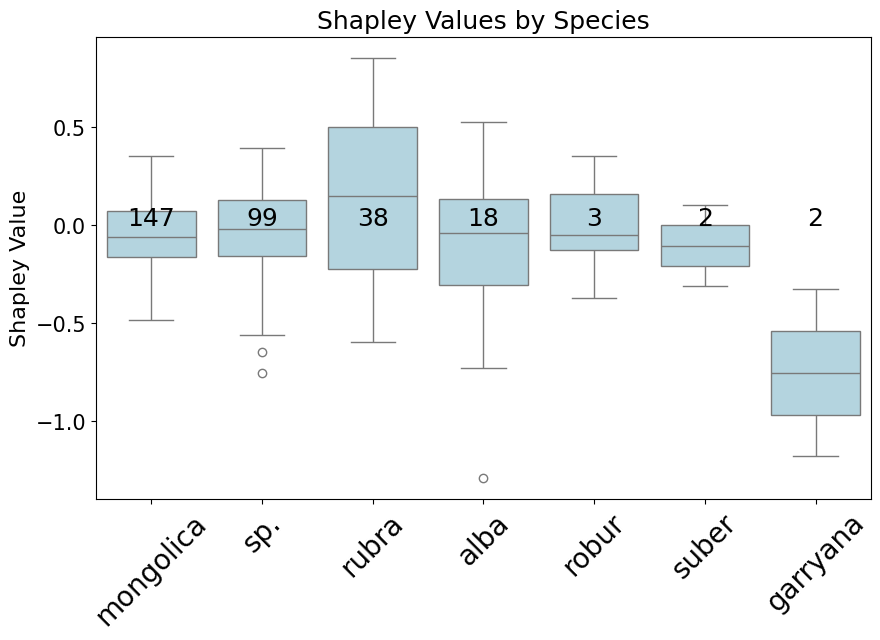
4.8. RQ6: Species-Specific Data Shapley Values and Their Implications
For this experiment, we explore the variations in data Shapley values across different genera and species, aiming to identify the most and least significant contributors within the dataset. We present a sample distribution plot of data Shapley values for individual species within one dataset (Figure 4(c)). The plot demonstrates that certain species exhibit significantly higher data Shapley values compared to others, indicating their greater contribution to the model’s performance.
5. Description of Deployment
As described earlier, our approach is part of a deployed ML pipeline that supports provenance identification for timber products. Our framework is in use by European enforcement agencies to assist claims verification of wood suspected of being in violation of sanctions against Russia by demonstrating that a claimed harvest location other than Russia is not viable. See coverage of our work from the New York Times (Nazaryan, 2024). Due to confidentiality reasons, we have presented results on a Quercus dataset.
6. Conclusion and Future Work
Data valuation based on Shapley values demonstrates promising results in SIRA analytics. Additionally, region-based data selection has been shown to further enhance model performance by effectively removing low-value data clusters. Our analysis highlights that the greatest performance improvements are observed when low-value data points with higher absolute Shapley values are removed, and similarly, larger performance drops occur when high-value data points with higher absolute Shapley values are excluded. This demonstrates that data values inferred by our approach are meaningful and can be contextualized for use in product provenance verification. Future work is aimed at generalizing data valuation methodologies to span more parts of natural resource supply chains.
References
- (1)
- Barrie and Prosser (1996) Andrew Barrie and SJ Prosser. 1996. Automated analysis of light-element stable isotopes by isotope ratio mass spectrometry. Mass spectrometry of soils. New York, Marcel Dekker (1996), 1–46.
- Boner et al. (2007) M Boner, Th Sommer, C Erven, and Hilmar Förstel. 2007. Stable isotopes as a tool to trace back the origin of wood. In Proceedings of the international workshop “Fingerprinting methods for the identification of timber origins. 3–5.
- Bontempo et al. (2019) Luana Bontempo, Mauro Paolini, Pietro Franceschi, Luca Ziller, Diego L. García-González, and Federica Camin. 2019. Characterisation and attempted differentiation of European and extra-European olive oils using stable isotope ratio analysis. Food Chemistry 276 (March 2019), 782–789. doi:10.1016/j.foodchem.2018.10.077
- Camin et al. (2004) Federica Camin, Karine Wietzerbin, Anaisabel Blanch Cortes, Georg Haberhauer, Michéle Lees, and Giuseppe Versini. 2004. Application of Multielement Stable Isotope Ratio Analysis to the Characterization of French, Italian, and Spanish Cheeses. Journal of Agricultural and Food Chemistry 52, 21 (Oct. 2004), 6592–6601. doi:10.1021/jf040062z
- Corruption (2021) Targeting Natural Resource Corruption. 2021. Using Wood Forensic Science to Deter Corruption and Illegality in the Timber Trade. https://www.worldwildlife.org/pages/tnrc-topic-brief-using-wood-forensic-science-to-deter-corruption-and-illegality-in-the-timber-trade
- Covert et al. (2024) Ian Covert, Chanwoo Kim, Su-In Lee, James Zou, and Tatsunori Hashimoto. 2024. Stochastic Amortization: A Unified Approach to Accelerate Feature and Data Attribution. arXiv preprint arXiv:2401.15866 (2024).
- Cusa et al. (2022) Marine Cusa, Katie St John Glew, Clive Trueman, Stefano Mariani, Leah Buckley, Francis Neat, and Catherine Longo. 2022. A future for seafood point-of-origin testing using DNA and stable isotope signatures. Reviews in Fish Biology and Fisheries 32, 2 (June 2022), 597–621. doi:10.1007/s11160-021-09680-w
- Dormontt et al. (2015) Eleanor E Dormontt, Markus Boner, Birgit Braun, Gerhard Breulmann, Bernd Degen, Edgard Espinoza, Shelley Gardner, Phil Guillery, John C Hermanson, Gerald Koch, et al. 2015. Forensic timber identification: It’s time to integrate disciplines to combat illegal logging. Biological Conservation 191 (2015), 790–798.
- Gasson et al. (2021) Peter E Gasson, Cady A Lancaster, Roger Young, Sara Redstone, Isabella A Miles-Bunch, Gareth Rees, R Philip Guillery, Meaghan Parker-Forney, and Elizabeth T Lebow. 2021. WorldForestID: Addressing the need for standardized wood reference collections to support authentication analysis technologies; a way forward for checking the origin and identity of traded timber. Plants, People, Planet 3, 2 (2021), 130–141.
- Ghorbani and Zou (2019) Amirata Ghorbani and James Zou. 2019. Data shapley: Equitable valuation of data for machine learning. In International conference on machine learning. PMLR, 2242–2251.
- Jia et al. (2019) Ruoxi Jia, David Dao, Boxin Wang, Frances Ann Hubis, Nick Hynes, Nezihe Merve Gürel, Bo Li, Ce Zhang, Dawn Song, and Costas J Spanos. 2019. Towards efficient data valuation based on the shapley value. In The 22nd International Conference on Artificial Intelligence and Statistics. PMLR, 1167–1176.
- Koh and Liang (2017) Pang Wei Koh and Percy Liang. 2017. Understanding black-box predictions via influence functions. In International conference on machine learning. PMLR, 1885–1894.
- Kwon and Zou (2021) Yongchan Kwon and James Zou. 2021. Beta shapley: a unified and noise-reduced data valuation framework for machine learning. arXiv preprint arXiv:2110.14049 (2021).
- Liu et al. (2020) Honglin Liu, Yitao Zeng, Jingna Yan, Rui Huang, Xin Zhao, Xiaoling Zheng, Min Mo, Siyun Tan, and Huarong Tong. 2020. C N H O and mineral element stable isotope ratio analysis for authentication in tea. Journal of Food Composition and Analysis 91 (Aug. 2020), 103513. doi:10.1016/j.jfca.2020.103513
- Meier-Augenstein et al. (2014) Wolfram Meier-Augenstein, Helen F. Kemp, Emily R. Schenk, and Jose R. Almirall. 2014. Discrimination of unprocessed cotton on the basis of geographic origin using multi-element stable isotope signatures. Rapid communications in mass spectrometry: RCM 28, 5 (March 2014), 545–552. doi:10.1002/rcm.6811
- Mortier et al. (2024) Thomas Mortier, Jakub Truszkowski, Marigold Norman, Markus Boner, Bogdan Buliga, Caspar Chater, Henry Jennings, Jade Saunders, Rosie Sibley, Alexandre Antonelli, et al. 2024. A framework for tracing timber following the Ukraine invasion. Nature Plants 10, 3 (2024), 390–401.
- Nazaryan (2024) Alexander Nazaryan. 2024. New Method That Pinpoints Wood’s Origin May Curb Illegal Timber. The New York Times (April 2024). https://www.nytimes.com/2024/04/09/science/conflict-timber-russia-europe.html
- Pandl et al. (2021) Konstantin D Pandl, Fabian Feiland, Scott Thiebes, and Ali Sunyaev. 2021. Trustworthy machine learning for health care: scalable data valuation with the shapley value. In Proceedings of the Conference on Health, Inference, and Learning. 47–57.
- Pianezze et al. (2019) Silvia Pianezze, Matteo Perini, Luana Bontempo, Luca Ziller, and Angelo Antonio D’Archivio. 2019. Geographical discrimination of garlic (Allium Sativum L.) based on Stable isotope ratio analysis coupled with statistical methods: The Italian case study. Food and Chemical Toxicology 134 (Dec. 2019), 110862. doi:10.1016/j.fct.2019.110862
- Schmitz et al. (2020) Nele Schmitz, Hans Beeckman, Celine Blanc-Jolivet, Laura Boeschoten, Jez W.B. Braga, José Antonio Cabezas, Gilles Chaix, Simon Crameri, Victor Deklerck, Bernd Degen, Eleanor Dormontt, Edgard Espinoza, Peter Gasson, Volker Haag, Stephanie Helmling, Micha Horacek, Gerald Koch, Cady Lancaster, Frederic Lens, Andrew Lowe, Sandra Martínez-Jarquín, Justyna Anna Nowakowska, Andrea Olbrich, Kathelyn Paredes-Villanueva, Tereza C.M Pastore, Tahiana Ramananantoandro, Andriambelo Radonirina Razafimahatratra, Prabu Ravindran, Gareth Rees, Liz F. Soares, Niklas Tysklind, Mart Vlam, Charlie Watkinson, Elisabeth A. Wheeler, Robert Winkler, Alex C. Widenhoeft, Valentina Th. Zemke, and Pieter A Zuidema. 2020. Overview of current practices in data analysis for wood identification. A guide for the different timber tracking methods. https://hal.inrae.fr/hal-02936035
- Shapley (1953) Lloyd S Shapley. 1953. A value for n-person games. Contribution to the Theory of Games 2 (1953).
- Shi and Duan (2024) Xinyi Shi and Haihan Duan. 2024. Data Valuation and Pricing in Internet of Things: Survey and Vision. In 2024 IEEE International Conference on Smart Internet of Things (SmartIoT). IEEE, 547–554.
- Siegwolf et al. (2022) Rolf T. W. Siegwolf, J. Renée Brooks, John Roden, and Matthias Saurer (Eds.). 2022. Stable Isotopes in Tree Rings: Inferring Physiological, Climatic and Environmental Responses. Tree Physiology, Vol. 8. Springer International Publishing, Cham. doi:10.1007/978-3-030-92698-4
- Tang et al. (2021) Siyi Tang, Amirata Ghorbani, Rikiya Yamashita, Sameer Rehman, Jared A Dunnmon, James Zou, and Daniel L Rubin. 2021. Data valuation for medical imaging using Shapley value and application to a large-scale chest X-ray dataset. Scientific reports 11, 1 (2021), 8366.
- Truszkowski et al. (2025) Jakub Truszkowski, Roi Maor, Raquib Bin Yousuf, Subhodip Biswas, Caspar Chater, Peter Gasson, Scot McQueen, Marigold Norman, Jade Saunders, John Simeone, Naren Ramakrishnan, Alexandre Antonelli, and Victor Deklerck. 2025. A probabilistic approach to estimating timber harvest location. Ecological Applications 35, 1 (2025), e3077. doi:10.1002/eap.3077 arXiv:https://esajournals.onlinelibrary.wiley.com/doi/pdf/10.1002/eap.3077
- Vystavna et al. (2021) Y Vystavna, I Matiatos, and LI Wassenaar. 2021. Temperature and precipitation effects on the isotopic composition of global precipitation reveal long-term climate dynamics. Scientific reports 11, 1 (2021), 18503.
- Wang et al. (2020) Jishi Wang, Tianjin Chen, Weixing Zhang, Yan Zhao, Shuming Yang, and Ailiang Chen. 2020. Tracing the geographical origin of rice by stable isotopic analyses combined with chemometrics. Food chemistry 313 (2020), 126093.
- Wang and Jia (2023) Jiachen T Wang and Ruoxi Jia. 2023. A Note on” Towards Efficient Data Valuation Based on the Shapley Value”. arXiv preprint arXiv:2302.11431 (2023).
- Wang et al. (2021) Liuwei Wang, Yuanliang Jin, Dominik J Weiss, Nina J Schleicher, Wolfgang Wilcke, Longhua Wu, Qingjun Guo, Jiubin Chen, David O’Connor, and Deyi Hou. 2021. Possible application of stable isotope compositions for the identification of metal sources in soil. Journal of Hazardous Materials 407 (2021), 124812.
- Wang and Jia (2022) Tianhao Wang and Ruoxi Jia. 2022. Data banzhaf: A data valuation framework with maximal robustness to learning stochasticity. arXiv preprint arXiv:2205.15466 19 (2022).
- Watkinson et al. (2020) Charles J Watkinson, Peter Gasson, Gareth O Rees, and Markus Boner. 2020. The development and use of isoscapes to determine the geographical origin of Quercus spp. in the United States. Forests 11, 8 (2020), 862.
- Watkinson et al. (2022) Charles J Watkinson, Gareth O Rees, Sabine Hofem, Lina Michely, Peter Gasson, and Markus Boner. 2022. A case study to establish a basis for evaluating geographic origin claims of timber from the Solomon Islands using stable isotope ratio analysis. Frontiers in Forests and Global Change 4 (2022), 645222.
- Wu et al. (2024) Ou Wu, Weiyao Zhu, and Mengyang Li. 2024. Is Data Valuation Learnable and Interpretable? arXiv preprint arXiv:2406.02612 (2024).
- Yan and Procaccia (2021) Tom Yan and Ariel D Procaccia. 2021. If you like shapley then you’ll love the core. In Proceedings of the AAAI Conference on Artificial Intelligence, Vol. 35. 5751–5759.
- Yoon et al. (2020) Jinsung Yoon, Sercan Arik, and Tomas Pfister. 2020. Data valuation using reinforcement learning. In International Conference on Machine Learning. PMLR, 10842–10851.