Optimizing OOD Detection in Molecular Graphs: A Novel Approach with Diffusion Models
Abstract.
Despite the recent progress of molecular representation learning, its effectiveness is assumed on the close-world assumptions that training and testing graphs are from identical distribution. The open-world test dataset is often mixed with out-of-distribution (OOD) samples, where the deployed models will struggle to make accurate predictions. The misleading estimations of molecules’ properties in drug screening or design can result in the tremendous waste of wet-lab resources and delay the discovery of novel therapies. Traditional detection methods need to trade off OOD detection and in-distribution (ID) classification performance since they share the same representation learning model. In this work, we propose to detect OOD molecules by adopting an auxiliary diffusion model-based framework, which compares similarities between input molecules and reconstructed graphs. Due to the generative bias towards reconstructing ID training samples, the similarity scores of OOD molecules will be much lower to facilitate detection. Although it is conceptually simple, extending this vanilla framework to practical detection applications is still limited by two significant challenges. First, the popular similarity metrics based on Euclidian distance fail to consider the complex graph structure. Second, the generative model involving iterative denoising steps is notoriously time-consuming especially when it runs on the enormous pool of drugs. To address these challenges, our research pioneers an approach of Prototypical Graph Reconstruction for Molecular OOd Detection, dubbed as PGR-MOOD. Specifically, PGR-MOOD hinges on three innovations: i) An effective metric to comprehensively quantify the matching degree of input and reconstructed molecules according to their discrete edges and continuous node features; ii) A creative graph generator to construct a list of prototypical graphs that are in line with ID distribution but away from OOD one; iii) An efficient and scalable OOD detector to compare the similarity between test samples and pre-constructed prototypical graphs and omit the generative process on every new molecule. Extensive experiments on ten benchmark datasets and six baselines are conducted to demonstrate our superiority: PGR-MOOD achieves more than of average improvement in terms of detection AUC and AUPR accompanied by the reduced cost of testing time and memory consumption. The anonymous code is in: https://anonymous.4open.science/r/PGR-MOOD-53B3.
1. Introduction
Molecular representation learning, which transforms molecules into low-dimensional vectors, has emerged as a critical and essential part of many biochemical problems, such as drug property prediction (Huber et al., 2007; Wang et al., 2024) and drug design (Li et al., 2018). For handling the non-Euclidean molecules, graph neural networks (GNNs) have been widely applied to encode both node features and structural information based on message-passing strategy (Gilmer et al., 2017). The embedding vectors of atoms and/or edges are then summarized to represent the underlying molecules and adopted to various downstream tasks (Hamilton et al., 2017; Xu et al., 2018; Cai et al., 2021).


The recent successes of molecular representation learning are often built on the assumption that training and testing graphs are from identical distribution. However, out-of-distribution (OOD) molecular graphs with different scaffolds or sizes, as shown in Fig. 1a, is unavoidable when the model is deployed in real-world scenarios (Ji et al., 2023). Taking antibiotics screening as example, the training data consists of drugs inhibiting the growth of Gram-negative pathogens, while the testing data is mixed with antibiotics against Gram-positive ones (Liu et al., 2023a). Because of the different pharmacological mechanisms in treating bacteria, a reliable drug screening model should not only accurately identify more the in-distribution (ID) samples (e.g., Gram-negative), but also detect “unknown” OOD inputs (e.g., Gram-positive) to avoid misleading predictions during inference. As illustrated in Fig. 1b, a notable decline in GNNs’ prediction accuracy is observed with OOD samples. This highlights the significance of OOD detection, which discerns between ID and OOD inputs, allowing the model to adopt appropriate precautions (Hendrycks and Gimpel, 2016).
Prior arts of graph OOD detection can be roughly grouped into two categories. One line of the existing work aims to leverage the original classifier and fine-tune it to improve its detection ability (Li et al., 2022; Liu et al., 2023b). The another line is to redesign the scoring function to indicate ID and OOD cases (Guo et al., 2023; Wu et al., 2023). Nevertheless, these methods inevitably require modifications to the original molecular representation learning model, leading to a trade-off between OOD detection and ID prediction (Gao et al., 2023). Recent advancements in computer vision have proposed the use of a diffusion model-based reconstruction approach for the unsupervised OOD detection, which typically involves an auxiliary generative model that approximates the ID distribution to reconstruct the input samples during testing phase (Graham et al., 2023; Gao et al., 2023; Liu et al., 2023d). Since the distribution of reconstructed samples is more biased towards ID than OOD, the disparity between original inputs and reconstructed outputs can be used as a judge metric for OOD detection. However, this kind of approach has never been practiced in the field of molecular graphs.

We first design a naive model called GR-MOOD as shown in Fig. 2, to verify the feasibility of the reconstruction method for molecular OOD detection and draw a positive conclusion through experiments. However, the inherent complexity of molecular graphs, which are characterized by non-Euclidean structures, poses two significant challenges. First, this nature of molecular graphs renders conventional similarity metrics (e.g., Euclidean distance) less effective to quantify the closeness between original and reconstructed graphs. Meanwhile, the different molecules often undergo distribution shifts that include both structural and feature changes, further complicating the assessment of similarity. This leads to Challenge 1: Identifying an effective metric to evaluate the similarity between the original input and the reconstruction. More importantly, the diffusion models require hundreds or thousands of sampling steps to denoise from a normal standard distribution towards generating new graphs, which introduces additional complexity. Such extensive requirement becomes impractical, especially when performing reconstructing for a large volume of test samples. This leads to Challenge 2: Addressing the additional complexity of diffusion model required for reconstruction. Thus we propose a critical research question: How can we adopt reconstruction method to effectively and efficiently handle the unique properties of molecular graphs for OOD detection?
In this paper, we introduce a groundbreaking OOD detection model, Prototypical Graph Reconstruction for Molecular OOd Detection (PGR-MOOD for short). For Challenge 1, concerning the identification of an effective metric for assessing the similarity between the original input and its reconstruction, PGR-MOOD adopts Fused Gromov-Wasserstein (FGW) distance (Titouan et al., 2019), which utilizes both the structural and feature information of molecular graphs to enhance the measurement of their matching degree. To efficiently address Challenge 2, PGR-MOOD proposes to create a series of prototypical graphs that are closer to ID samples and away from OOD ones. We reduce the need of reconstructing every test graph and just compare its similarities with the prepared prototypical graphs. With this procedure, we can extend to the large-scale OOD detection. Our contributions are summarized as follows:
-
•
GR-MOOD Framework: We propose to detect OOD graphs from a novel perspective, i.e., via comparing the original molecules with their reconstructed outputs based on the diffusion model. The technical feasibility and challenges are analyzed empirically for this new framework.
-
•
PGR-MOOD Framework: To overcome the challenges of reconstruction measurement and generation efficiency, we propose a molecular detection method that contains a prototypical graphs generator and a similarity function based on FGW distance. In the testing phase, one only needs to measure the similarity between the prototypical graphs and the current inputs to identify OOD with lower values.
-
•
SOTA Experimental Results: We conduct extensive analysis on ten benchmark molecule datasets and compare with six baselines. PGR-MOOD obtains the consistent superiority over other state-of-the-art models, delivering the average improvements of AUC and AUPR by and , reduction on FPR95, and substantial savings in time and memory consumption.
2. related work
2.1. Graph Neural Networks
Since graph neural networks can use the topological structure and node properties of graphs for representation learning, they have become the most powerful method for processing graph data (Feng et al., 2022; Zhao et al., 2021; Bevilacqua et al., 2021; Zhou et al., 2020), especially molecular graphs (Wang et al., 2022; Wieder et al., 2020). GCN (Kipf and Welling, 2016), the simplest but most efficient method, has been proved to be equivalent to the first-order approximation filter on graphs (He et al., 2021) and thus performs well in node classification (Hamilton et al., 2017) and link prediction (Cai et al., 2021). On graph instance-related tasks, GIN (Xu et al., 2018) proves that GNN is as powerful as the 1-WL test and leverages an injective summation operation to increase performance. More and more researchers have proposed more representational methods, but they all ignore the performance and trustworthiness issues brought by OOD distribution (Wang et al., 2021; Wu et al., 2022).
2.2. Graph Generative Models
Graph generative models aim to learn the distribution of the graph data and sample from it to generate novel graphs (Zhu et al., 2022), especially for molecular graphs since it is related to many science issues (Li et al., 2017; Reiser et al., 2022; Ingraham et al., 2019). Some graph generation methods are inspired by auto-regressive models, such as VAE-based (Mitton et al., 2021) or normalizing flow-based models (Kuznetsov and Polykovskiy, 2021). However, they are limited by the high computational cost and inability to model permutation invariance of graph (Jo et al., 2022). Inspired by the diffusion models in computer vision (Song et al., 2021), the same insight on graphs has developed in recent years (Niu et al., 2020; Vignac et al., 2022; Chen et al., 2023). Although diffusion models achieve state-of-the-art performance, they still suffer from inefficiencies caused by slow denoising processes (Limnios et al., 2023).
2.3. OOD Detection on Graphs
Recently, many studies focus on graph OOD detection due to its importance. GOOD-D is the pioneering work for unsupervised OOD graph detection, which performs hierarchical contrastive learning to capture latent ID patterns and detects OOD graphs based on their semantic inconsistency (Liu et al., 2023b). GraphDE determines ID and OOD by inferring the environment variables of the graph generation process (Li et al., 2022). AAGOD aims to learn a parameterized amplifier matrix to emphasize the key patterns which helpful for graph OOD detection, thereby enlarging the gap between OOD and ID graphs (Guo et al., 2023). Anomaly graph detection can also be seen as a special case of OOD detection, since anomaly graphs with anomaly structures and features can be caused by distribution shifts and many methods have been proposed to solve it (Qiu et al., 2022; Ma et al., 2022). All of the above methods require redesigning or training well-performing GNNs on the ID datasets and inevitably lead to a trade-off between OOD detection and ID prediction.
3. Preliminaries
We define an undirected graph with nodes, where is adjacency matrix to represent the graph topology, is feature matrix of all nodes with the dimensionality of . can also be re-written by Optimal transmission (OT) format (Vincent-Cuaz et al., 2022) to represent as a tuple , where is a vector of weights modeling the relative importance of the nodes and we define it as a uniform weight . In addition, we define as the training dataset that usually consists of ID graphs, and define as the test dataset, which can be divided into in-distribution subset and out of distribution subset .
3.1. Out of Distribution Detection
For OOD detection task, we aim to design a detector to distinguish whether the input graph is an OOD sample or not:
| (3) |
where denotes a judging function to score the input molecules and denotes threshold for identifying the OOD samples. A desired OOD detector should assign judge scores with the maximum gap between ID and OOD samples. This target can be described as the following optimization:
| (4) |
Supposing the judge score distributions of ID and OOD have significant divergence, we can distinguish them with a simple intermediate threshold. For reconstruction-based OOD detection as shown in Fig. 2, the similarity between the input and the output molecules of diffusion model is often adopted as the judge function:
| (5) |
where is the reconstructed output and is the similarity function. OOD inputs correspond to the lower reconstruction quality and therefore the lower similarity, while the similarity measurement is higher for the ID inputs.
3.2. Graph Neural Networks
The typical GNNs are based on message passing paradigm. Specifically, the final representation of graph for a -layer GNNs is:
| (6) | ||||
| (7) |
where is raw node feature, represents a set of neighbor nodes with respect to node , and is the message passing process that aggregates neighborhood features (e.g., sum, mean, or max) and combines them with the local node. GNNs iteratively perform to learn the effective node representations and utilize function to map all the node representations into the graph representations, which is a single vector.
3.3. Graph Generative Model
The generative method based on the diffusion model consists of a forward diffusion process and a reverse denoising process. At the forward process, the model progressively adds noise to the original data until a standard normal distribution. At the reverse process, the model learns the score function (i.e., a neural network) to remove the perturbed noise with the same amount of steps (Croitoru et al., 2023; Liu et al., 2023c; Song et al., 2021).
Given a graph , we can use continuous time to index the diffusion trajectory , such that is the original input graph and approximately follows the normal distribution. The forward process transforms to through a stochastic differential equation (SDE):
| (8) |
where is standard Wiener process (Jo et al., 2022), is linear drift coefficient, is a scalar function which represents the diffusion coefficient. and relate to the amount of noise added to the graph at each infinitesimal step . In order to generate graphs that follow the distribution of , we start from and utilize a reverse-time SDE for denoising from to :
| (9) |
where is score function to estimate the scores of perturbed graphs and is the marginal distribution under the forward process at time . In practice, two GNNs are utilized as the score function to denoise both node features and graph structures. is a reverse time standard Wiener process.

4. Reconstruction of Prototypical Graph for ood detection
In this section, we first propose a naive graph reconstruction method, termed as GR-MOOD, to analyze its potential and limitations for molecular graph OOD detection. Then, we propose a novel approach of PGR-MOOD to reconstruct the prototypical graphs of ID samples for effective and efficient OOD detection.
4.1. GR-MOOD
Inspired by the generative methods (Liu et al., 2023d; Gao et al., 2023), we design a vanilla graph reconstruction model (GR-MOOD) for molecular graph OOD detection. GR-MOOD is pre-trained on a large-scale compound dataset (e.g., QM9 or ZINC) and fine-tuned on . Considering input graph , we utilize GR-MOOD to perturb and reconstruct it via:
| (10) | |||
| (11) |
where is the parameters of GR-MOOD, and is the iteration numbers. Function applies Eq. (8) to introduce perturbations that transform into a noised state , while function utilizes Eq. (9) to reverse the process, effectively denoising to generate reconstruction graph .
Upon acquiring the reconstruction graph , we utilize a GNN well-trained on the ID dataset to encode both the feature and structure information of and , whose representations are denoted as and , respectively. The cosine similarity between them is treated as OOD judge score and is defined in Eq. (5):
| (12) |

To validate GR-MOOD effectiveness, we conduct experiments on two DrugOOD datasets (Ji et al., 2023). As shown in Fig. 3, the performance of GR-MOOD is comparable (e.g., AUROC and AUPR) or even outperforming (e.g., the smaller score of FPR95 is better) than the SOTA method of GOOD-D (Liu et al., 2023b). The underlying principle is that since GR-MOOD is trained to reconstruct graphs that align with the ID distribution, OOD samples, due to their inherent dissimilarity from the ID distribution, will typically undergo poorer reconstruction when being processed. Such discrepancy is quantified as a lower judge score, which signals the presence of an OOD sample. This mechanism highlights the critical role of diffusion model based reconstruction method in identifying graphs that do not conform to the expected distribution, thereby providing a quantitative basis for distinguishing between ID and OOD samples.
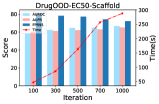
Limitation of GR-MOOD: Despite the intuitive promise of GR-MOOD, our evaluation reveals the non-negligible limitations in terms of its time efficiency and reconstruction quality measurement. First, the primary constraint of GR-MOOD is due to the inherent structural complexity of molecular graphs. As illustrated in Fig. 4a, this complexity requires the diffusion model to take an extensive amount of denoising steps to fulfill the reconstruction, improving model performance at the expense of efficiency. Even worse, repeating the generation process for each molecules makes it challenging to scale in the testing phase, which has to screen on a large pool of molecule candidates. Second, another issue pertains to the adequacy of the similarity function employed in our model. As depicted in Fig. 4b, the reconstruction similarity distributions of ID and OOD samples calculated based on Eq. (12) are not significantly different 111There are similar sub-structures among the molecular graphs (e.g., functional groups like benzene rings), resulting in close representations of the OOD and ID samples.. Since graphs embody as non-Euclidean data, the standard metrics such as cosine similarity impedes the ability to accurately capture the nuances of molecular structure and node features among the molecules. This limitation can result in the consequential loss of detection accuracy.

4.2. PGR-MOOD
To address the limitations of GR-MOOD, we propose a novel approach based upon diffusion model, PGR-MOOD (Prototypical Graph Reconstruction for Molecular OOD Detection). The innovation of PGR-MOOD has three aspects: A strong similarity function, a prototypical graphs generator, and an efficient and scalable OOD detector. The architecture of PGR-MOOD is shown in Fig. 5.
A Strong Similarity Function based on FGW. The cosine similarity metric is oriented towards quantifying the angular divergence between two vectors, while it is not suitable for non-Euclidean data such as graphs. In fact, measuring the similarity between graphs is equivalent to calculating the their matching degree, the higher the matching degree, the more similar they are. Fused Gromov-Wasserstein () distance has been proved particularly advantageous for the measurement between graphs. It achieves a balance between the optimal transport (OT) distance with a cost on node features and the Gromov-Wasserstein (GW) distance among the toplogical structures.
Specifically, treats the graph associated with topology and node feature as a probability distribution. It allows for the computation of costs between two distributions with optimal coupling, serving as a distance measure between graphs. For two graphs represented in OT format, and , their distance is defined as:
| (13) | ||||
where represents the element of the -th row and -th column in , represents the th row vector of , is a parameter to balance the structure term and the feature term, is the set of all admissible couplings between and .
metric exhibits optimal performance in directly discerning both structural variances and feature disparities between graphs.
A Prototypical Graphs Generator. The naive diffusion model of GR-MOOD reconstructs graph that favors the distribution of the input samples, instead of following the distribution learned during the training phase. It misleads the detector’s judgment on the OOD samples. To address this challenge, we propose a prototypical graphs generator, which generates prototypical graphs satisfying the following two properties: ➀ For any input graph , where represents all ID graphs, the prototypical graph ought to closely resemble the graph . ➁ For any input , where represents all OOD graphs, the prototypical graph should exhibit significant deviation from the graph . Consequently, the goal is to generate a prototypical graph which is close to the ID graphs and far away from the OOD graphs.
To satisfy Property ➀, Eq. (13) is utilized as the distance metric, and the loss function is formulated to guide the denosing process at the generator:
| (14) |
Similarly to comply with Property ➁, we introduce loss function to enhance the distance between from OOD samples:
| (15) |
Note that OOD graphs are unreachable during the training phase, precluding the direct formulation of . Consequently, it becomes imperative to synthesize graphs as proxies for the absent OOD samples. Recalling the pre-trained diffusion model in Eq. (9), it adopts socre function to generate graph. The parameter weights of is given by , where represent the parameters of the -th score function. We propose to directly perturb parameters for generating OOD graphs :
| (16) |
where is perturbation strength, is identity matrix, and is perturbation matrix. By perturbing the parameters , a new score function is derived. Experimental observations (w/o of Table 2) reveal that can induce a deviation in the denoising trajectory away from the original data distribution, thereby enabling the diffusion model to generate during the training phase. In light of these researches, a composite loss function is formulated by integrating both and :
| (17) |
It is leveraged to guides the training of Prototypical Graphs Generator , which has the same architecture and initial parameters with , to generate prototypical graph . The generation of by unfolds in two phases: Firstly, in contrast to generating directly from Gaussian noise, a graph from is randomly chosen as the start point of generation. We then add -step noise according to Eq. (8) to get the final noise graph (i.e., ). Secondly, guides the denoising step of diffusion model to generate prototype graph :
| (18) | |||
where is the indicator of the denoise step and varies from to .
The prototype graph generated by the above equation can be viewed as the reconstruction of both ID and OOD graphs, but has better discrimination than the reconstruction generated in GR-MOOD. To further reduce the computation, rather than utilizing the entirety of , a fixed batch-size dataset is employed for the computation of . Each can generate one , and they are combined to formulate a list , .
An Efficient and Scalable OOD Detector. Diffusion models require significant time and memory resources during the testing phases because they need to generate a reconstructed graph for each input. To alleviate this computational burden, PGR-MOOD eliminates the necessity of graph reconstruction in the testing phase via preparing the prototypical graphs in the training phase. PGR-MOOD leverages the within list to conduct the similarity measurement with every new test sample. The maximum similarity is employed as the definitive judge score for OOD detection:
| (19) |
where () is the similarity function based on the inverse of distance.
| DrugOOD-IC50 | |||||||||
|---|---|---|---|---|---|---|---|---|---|
| Scafflod | Size | Assay | |||||||
| OOD Detector | AUROC | AUPR | FPR95 | AUROC | AUPR | FPR95 | AUROC | AUPR | FPR95 |
| MSP | 54.57±9.18 | 52.43±6.85 | 90.76±4.95 | 52.57±9.07 | 57.23±3.25 | 88.60±4.75 | 58.19±7.23 | 56.38±5.75 | 89.20±3.05 |
| GOOD-D | 85.40±1.23 | 87.13±2.31 | 27.40±2.37 | 91.55±1.10 | 87.91±3.74 | 16.95±0.47 | 81.35±1.74 | 79.05±0.79 | 75.02±0.57 |
| GraphDE | 69.15±1.11 | 67.40±0.51 | 80.30±0.33 | 78.72±1.78 | 79.36±1.24 | 78.97±0.75 | 68.56±1.08 | 66.56±0.31 | 82.20±0.93 |
| AAGOD | 84.23±2.97 | 83.96±1.34 | 21.56±1.08 | 84.75±1.23 | 83.32±1.61 | 19.80±0.93 | 71.94±1.45 | 72.86±1.84 | 85.62±2.71 |
| OCGIN | 68.39±4.77 | 66.05±5.11 | 82.80±7.50 | 70.94±5.09 | 68.99±3.72 | 74.80±6.46 | 67.53±4.61 | 66.95±5.23 | 79.80±4.60 |
| GLocalKD | 63.42±0.60 | 58.03±0.64 | 70.28±1.83 | 69.44±0.58 | 67.29±0.77 | 81.13±1.46 | 62.08±0.76 | 61.93±0.61 | 82.70±1.98 |
| GR-MOOD | 78.82±2.31 | 77.35±1.94 | 25.43±1.72 | 68.51±2.65 | 69.19±3.01 | 70.78±2.33 | 61.91±1.87 | 62.95±1.54 | 84.87±1.39 |
| PGR-MOOD | 91.57±1.32 | 90.12±0.71 | 19.42±0.22 | 93.84±1.53 | 94.85±2.03 | 15.57±1.03 | 83.72±2.51 | 80.31±1.44 | 64.65±0.57 |
| Improve | +7.22% | +3.43% | -9.89% | +2.50% | +7.08% | -8.41% | +2.91% | +1.52% | -13.80% |
| DrugOOD-EC50 | |||||||||
|---|---|---|---|---|---|---|---|---|---|
| Scafflod | Size | Assay | |||||||
| OOD Detector | AUROC | AUPR | FPR95 | AUROC | AUPR | FPR95 | AUROC | AUPR | FPR95 |
| MSP | 57.26±7.25 | 57.08±5.94 | 87.26±5.12 | 59.18±8.77 | 58.41±4.95 | 83.76±5.60 | 48.19±9.18 | 46.38±6.85 | 89.26±4.95 |
| GOOD-D | 82.51±1.31 | 81.98±2.71 | 63.21±2.89 | 92.50±1.32 | 88.37±1.26 | 19.20±0.51 | 65.20±1.48 | 67.22±1.61 | 92.24±3.56 |
| GraphDE | 68.55±1.03 | 66.56±1.90 | 82.20±0.74 | 79.64±1.16 | 77.75±1.48 | 59.25±0.57 | 66.24±1.79 | 66.28±0.98 | 80.29±1.04 |
| AAGOD | 77.17±5.52 | 75.32±5.56 | 72.76±4.95 | 78.72±6.59 | 79.23±6.30 | 68.66±5.43 | 74.57±9.18 | 72.43±6.85 | 71.83±4.43 |
| OCGIN | 69.01±3.98 | 67.83±4.87 | 74.79±7.50 | 78.45±5.17 | 74.30±3.96 | 81.53±5.64 | 71.33±2.85 | 70.94±3.69 | 80.93±3.55 |
| GLocalKD | 66.59±0.71 | 68.64±0.45 | 71.22±1.01 | 69.59±0.98 | 68.72±0.83 | 68.70±1.36 | 73.32±1.65 | 69.23±1.57 | 75.39±2.19 |
| GR-MOOD | 71.15±2.50 | 73.02±3.21 | 81.79±3.58 | 73.80±2.95 | 78.49±1.63 | 70.96±1.82 | 60.17±1.56 | 61.69±10.27 | 79.09±1.33 |
| PGR-MOOD | 87.53±1.31 | 86.16±0.72 | 62.82±2.21 | 97.67±1.54 | 96.32±1.47 | 13.79±1.23 | 86.73±3.34 | 83.56±3.28 | 63.74±2.59 |
| Improve | +6.02% | +5.09% | -3.70% | +5.58% | +8.41% | -28.10% | +16.30% | +15.36% | +11.22% |
| AUROC | AUPR | FPR95 | |||||||
|---|---|---|---|---|---|---|---|---|---|
| Dataset | w/o | w/o | w/o | w/o | w/o | w/o | w/o | w/o | w/o |
| DrugOOD-EC50 | -4.57 | -2.43 | -0.76 | -7.72 | -2.32 | -4.75 | +5.74 | +2.22 | +1.63 |
| DrugOOD-IC50 | -5.14 | -1.75 | -1.24 | -4.26 | -1.98 | -3.62 | +6.83 | +1.77 | +2.36 |
| GOOD-HIV | -3.26 | -2.58 | -0.54 | -5.83 | -2.43 | -3.18 | +4.72 | +2.03 | +2.61 |
| GOOD-PCBA | -5.89 | -1.08 | -2.07 | -6.44 | -3.70 | -4.81 | +3.62 | +1.12 | +2.14 |
5. experiment
In this section, we verify the effectiveness of PGR-MOOD and GR-MOOD by performing experiments on two graph OOD benchmarks.
5.1. Experiment Setup
5.1.1. Datasets
With the increasing attention on OOD detection in the molecular graphs, two benchmarks are proposed, GOOD (Gui et al., 2022) and DrugOOD (Ji et al., 2023), respectively. These two benchmarks provide the detailed rules to distinguish between ID and OOD. GOOD is built based on the scaffold and size of the molecular graph, and DrugOOD adds an assay on the basis of these two distribution shifts. We take six datasets from DrugOOD and four datasets from GOOD as our experimental datasets. Please see Appendix A.1 for details.
5.1.2. Baselines Methods
To verify the performance of our methods, namely GR-MOOD and PGR-MOOD, we use the GNNs’ Max Softmax Score (MSP) (Hendrycks and Gimpel, 2016) as a vanilla baseline and then compare with three SOTA graph OOD detection methods (GOOD-D (Liu et al., 2023b), AAGOD (Guo et al., 2023), and GraphDE (Li et al., 2022)). Meanwhile, two graph anomaly detection methods, namely OCGIN (Qiu et al., 2022) and GLocalKD (Ma et al., 2022), are introduced as the baseline. In addition, as the first molecular graph OOD detection method based on the diffusion model, we also compare the PGR-MOOD with the naive solution GR-MOOD to verify whether its limitations have been solved. Please see Appendix A.2 for details.
5.1.3. Implementation Details
For our methods, we utilize the diffusion model GDSS (Jo et al., 2022) as the backbone which achieves stat-of-the-art performance on graph generation. GDSS is pre-trained on the QM9 dataset, which comprises a large collection of organic molecules with 113k samples. Following the setting of GraphDE, we perform 10 random trials and report the average accuracy on the test set, along with confidence intervals. During training, we set to to balance the topological structure and node features when computing the FGW distance. We set to 128 and the number of perturbation steps to reduce memory allocation and computation complexity. For all baseline methods, we follow settings reported in their papers. All the experiments are implemented by PyTorch, and run on an NVIDIA TITAN-RTX (24G) GPU.
5.2. Performance Analysis
Q: Whether PGR-MOOD achieves the best performance on the OOD detection in molecular graphs? Yes, we utilize the new loss function to guide the diffusion model to generate prototypical graphs that are more representative of all ID samples, and more easily detect OOD samples.
Comparison with the naive solution. As shown in Table 1 and Table 3, compared with GR-MOOD on six datasets of DrugOOD, PGR-MOOD enhances the average AUC and AUPR by and , and reduces the average FPR95 by . These results demonstrate that the prototypical graphs of PGR-MOOD generated with the FGW similarity function are more suitable for distinguishing the original input graphs in the testing phase.
Comparison with the State-of-the-art Methods. To verify the superiority of our method, we compare it with the previous SOTA methods. As shown in the last row of Table 1 and Table 3, our method achieves SOTA results on all datasets. The average improvements against the previous SOTA are of AUC and of AUPR, and the average reduction on FPR95 is . We attribute these results to the fact that the prototypical graphs generated by PGR-MOOD can enlarge the judge score gap between ID and OOD which satisfies the requirement of optimal OOD detector.
| GOOD-HIV | ||||||||||
| Dataset | Metric | MSP | GOOD-D | GraphDE | AAGOD | OCGIN | GLocalKD | GR-MOOD | PGR-MOOD | Improve |
| Scaffold | AUROC | 58.55±9.18 | 62.42±1.89 | 65.66±1.69 | 74.81±1.56 | 66.29±4.35 | 64.76±0.34 | 61.22±2.68 | 85.57±1.32 | +14.38% |
| AUPR | 58.34±6.85 | 69.60±2.03 | 60.94±0.48 | 72.51±1.99 | 65.45±5.98 | 65.92±0.64 | 60.53±1.94 | 85.12±0.71 | +12.61% | |
| FPR95 | 93.40±4.95 | 87.75±0.35 | 88.40±0.43 | 76.71±1.82 | 85.65±6.74 | 83.98±0.89 | 87.35±1.66 | 66.50±2.01 | -13.31% | |
| Size | AUROC | 54.96±9.07 | 72.23±1.54 | 66.72±1.13 | 63.44±1.92 | 65.04±4.65 | 68.49±1.22 | 69.67±2.71 | 88.43±2.37 | +22.47% |
| AUPR | 54.09±3.25 | 76.12±1.26 | 65.55±0.30 | 60.02±1.88 | 64.67±4.03 | 68.23±0.97 | 71.76±2.39 | 87.77±2.18 | +15.30% | |
| FPR95 | 97.80±4.75 | 68.74±3.25 | 72.20±0.89 | 75.97±1.15 | 73.64±5.86 | 76.13±1.55 | 60.56±2.91 | 65.17±2.21 | -5.17% | |
| GOOD-PCBA | ||||||||||
| Dataset | Metric | MSP | GOOD-D | GraphDE | AAGOD | OCGIN | GLocalKD | GR-MOOD | PGR-MOOD | Improve |
| Scaffold | AUROC | 54.57±9.07 | 85.69±1.16 | 68.45±1.23 | 79.06±0.48 | 69.50±3.17 | 70.90±1.68 | 70.07±0.60 | 86.57±1.32 | +1.02% |
| AUPR | 52.43±6.21 | 86.97±1.76 | 66.07±0.32 | 72.70±0.30 | 68.34±4.11 | 73.56±1.64 | 71.90±0.64 | 88.12±0.71 | +1.32% | |
| FPR95 | 90.76±4.36 | 16.04±1.90 | 82.34±0.67 | 60.37±0.58 | 87.94±6.98 | 39.57±1.44 | 55.42±1.89 | 15.01±0.32 | -6.04% | |
| Size | AUROC | 58.57±8.99 | 78.31±1.19 | 66.24±1.90 | 64.90±1.71 | 70.61±3.25 | 73.58±0.50 | 71.49±0.78 | 83.84±1.53 | +7.06% |
| AUPR | 57.23±3.25 | 76.21±1.61 | 64.58±0.21 | 67.24±0.87 | 72.21±3.91 | 67.40±0.91 | 75.31±1.09 | 84.85±2.03 | +11.33% | |
| FPR95 | 88.60±4.75 | 27.30±1.72 | 88.45±0.29 | 60.03±1.06 | 63.80±4.47 | 60.29±0.89 | 46.37±1.29 | 17.01±0.17 | -37.61% | |
5.3. Visualization of Score Gap
Q: Whether PGR-MOOD can enlarge the judge score gap between ID and OOD graphs? Yes, we calculate the similarity between the prototypical graphs and test graphs, which has a massive difference for ID and OOD. A more significant gap between ID and OOD graphs corresponds to a better graph OOD detector. We present the scoring distributions on two datasets in Fig. 6. The ID and OOD are perfectly separated into two distinct distributions, so we can use a simple threshold for OOD detection and achieve SOTA performance.
5.4. Ablation Experiment
Q: Whether each module in PGR-MOOD contribute to effectively discriminating OOD molecular graphs? Yes, we conduct experiments on four datasets to verify the role of , , and modules in PRG-MGOD. The results are shown in Table 2.
Ablation on and . We remove and in the respectively to explore their impacts on the performance of OOD detection. We find that merely enlarging the distance between the prototypical graph from OOD samples (w/o ) or bringing it closer to ID samples (w/o ) significantly undermines the performance of PGR-MOOD. This fully confirms that the Property➀ and Property➁ are valid and correct. These results demonstrate that the composition of and can generate prototypical graphs with different similarity measurement for ID and OOD graphs in the testing phase.


Ablation on . We replace the function based on in Eq. (19) with Eq. (12) of GR-MOOD to explore its importance on the performance of OOD detection. We find that the is even more influential than on all datasets with different metrics. These experimental results demonstrate that a proper similarity measurement is necessary and the can thoroughly evaluate the similarity between two graphs by considering both their structure and features.
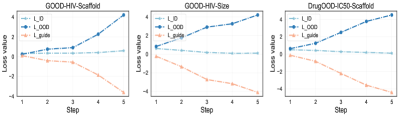
Q: Whether the prototypical graphs generated by -guided PGR-MOOD follow the Properties ➀ and ➁ ? Yes, the prototypical graphs effectively reduce the distance with the ID graphs and significantly increase the separation from the OOD graphs. To validate the impact of , its trend is monitored throughout the generation phase, as depicted in Fig. 7. Here, and are computed using Eq. (14) and Eq. (15) and they represent the distance between and all graphs belong to ID and OOD, respectively. As the generation progresses, steadily decreases towards 0, whereas escalates sharply. This observation aligns seamlessly with the foundational principles of PGR-MOOD.

5.5. Computational Complexity Comparison
Q: Whether the PGR-MOOD reduces the complexity of time and space in the training and testing phases? Yes, to validate the efficiency and scalability of PGR-MOOD, we conduct comprehensive comparisons against the SOTA method GOOD-D and a baseline GR-MOOD. The comparative results are illustrated in Fig. 8. Although PGR-MOOD slightly trails GOOD-D in testing time, it markedly surpasses it in all other aspects.
Efficiency on execution time. During the training phase, PGR-MOOD exhibits a substantially reduced training duration compared to both GOOD-D and GR-MOOD. This efficiency stems from GOOD-D’s reliance on a time-consuming contrastive learning approach for model training, whereas GR-MOOD necessitates fine-tuning of the diffusion model on the training set. In contrast, PGR-MOOD requires the generation of only a limited set of prototype graphs, thereby enhancing its training efficiency. During the testing phase, GOOD-D leverages its trained model to directly classify input graphs, while PGR-MOOD’s method, which entails calculating the similarity between input graphs and the set of prototypical graphs individually. Consequently, PGR-MOOD is marginally slower than GOOD-D. However, it significantly outpaces GR-MOOD, which requires the regeneration of reconstructed graphs for each input.
Scalability in memory allocation. To assess the memory efficiency of our method, we evaluate memory allocation during the testing phase. PGR-MOOD, which eschews the need for any model for OOD detection, only loads the set of prototypical graphs and demands the least memory allocation. In contrast, the GOOD-D method requires loading GNNs, and GR-MOOD necessitates loading a diffusion model for reconstruction graphs, thereby increasing their memory requirements. The experimental findings underscore that our approachcan significantly mitigate memory consumption and enhance model scalability.
6. conclusion
This study explores OOD detection for molecular graphs, starting with a basic diffusion model-based approach, GR-MOOD, and identifying key challenges. We introduce PGR-MOOD, an advanced OOD detection method for molecular graphs that addresses GR-MOOD’s limitations by using a diffusion model to create prototypical graphs. These graphs closely resemble ID inputs while distinctly diverging from OOD inputs. PGR-MOOD utilizes the Fused Gromov-Wasserstein distance for efficient similarity measurement and OOD scoring, significantly reducing computational load. Our approach demonstrates SOTA results across ten datasets, proving its effectiveness.
References
- (1)
- Bevilacqua et al. (2021) Beatrice Bevilacqua, Fabrizio Frasca, Derek Lim, Balasubramaniam Srinivasan, Chen Cai, Gopinath Balamurugan, Michael M Bronstein, and Haggai Maron. 2021. Equivariant subgraph aggregation networks. arXiv preprint arXiv:2110.02910 (2021).
- Cai et al. (2021) Lei Cai, Jundong Li, Jie Wang, and Shuiwang Ji. 2021. Line graph neural networks for link prediction. IEEE Transactions on Pattern Analysis and Machine Intelligence 44, 9 (2021), 5103–5113.
- Chen et al. (2023) Xiaohui Chen, Jiaxing He, Xu Han, and Liping Liu. 2023. Efficient and Degree-Guided Graph Generation via Discrete Diffusion Modeling. (2023).
- Croitoru et al. (2023) Florinel-Alin Croitoru, Vlad Hondru, Radu Tudor Ionescu, and Mubarak Shah. 2023. Diffusion models in vision: A survey. IEEE Transactions on Pattern Analysis and Machine Intelligence (2023).
- Feng et al. (2022) Jiarui Feng, Yixin Chen, Fuhai Li, Anindya Sarkar, and Muhan Zhang. 2022. How powerful are k-hop message passing graph neural networks. Advances in Neural Information Processing Systems 35 (2022), 4776–4790.
- Gao et al. (2023) Ruiyuan Gao, Chenchen Zhao, Lanqing Hong, and Qiang Xu. 2023. DiffGuard: Semantic Mismatch-Guided Out-of-Distribution Detection using Pre-trained Diffusion Models. In Proceedings of the IEEE/CVF International Conference on Computer Vision. 1579–1589.
- Gilmer et al. (2017) Justin Gilmer, Samuel S Schoenholz, Patrick F Riley, Oriol Vinyals, and George E Dahl. 2017. Neural message passing for quantum chemistry. In International conference on machine learning. PMLR, 1263–1272.
- Graham et al. (2023) Mark S Graham, Walter HL Pinaya, Petru-Daniel Tudosiu, Parashkev Nachev, Sebastien Ourselin, and Jorge Cardoso. 2023. Denoising diffusion models for out-of-distribution detection. In Proceedings of the IEEE/CVF Conference on Computer Vision and Pattern Recognition. 2947–2956.
- Gui et al. (2022) Shurui Gui, Xiner Li, Limei Wang, and Shuiwang Ji. 2022. Good: A graph out-of-distribution benchmark. Advances in Neural Information Processing Systems 35 (2022), 2059–2073.
- Guo et al. (2023) Yuxin Guo, Cheng Yang, Yuluo Chen, Jixi Liu, Chuan Shi, and Junping Du. 2023. A Data-centric Framework to Endow Graph Neural Networks with Out-Of-Distribution Detection Ability. (2023).
- Hamilton et al. (2017) Will Hamilton, Zhitao Ying, and Jure Leskovec. 2017. Inductive representation learning on large graphs. Advances in neural information processing systems 30 (2017).
- He et al. (2021) Mingguo He, Zhewei Wei, Hongteng Xu, et al. 2021. Bernnet: Learning arbitrary graph spectral filters via bernstein approximation. Advances in Neural Information Processing Systems 34 (2021), 14239–14251.
- Hendrycks and Gimpel (2016) Dan Hendrycks and Kevin Gimpel. 2016. A baseline for detecting misclassified and out-of-distribution examples in neural networks. arXiv preprint arXiv:1610.02136 (2016).
- Huber et al. (2007) Wolfgang Huber, Vincent J Carey, Li Long, Seth Falcon, and Robert Gentleman. 2007. Graphs in molecular biology. BMC bioinformatics 8, 6 (2007), 1–14.
- Ingraham et al. (2019) John Ingraham, Vikas Garg, Regina Barzilay, and Tommi Jaakkola. 2019. Generative models for graph-based protein design. Advances in neural information processing systems 32 (2019).
- Ji et al. (2023) Yuanfeng Ji, Lu Zhang, Jiaxiang Wu, Bingzhe Wu, Lanqing Li, Long-Kai Huang, Tingyang Xu, Yu Rong, Jie Ren, Ding Xue, et al. 2023. Drugood: Out-of-distribution dataset curator and benchmark for ai-aided drug discovery–a focus on affinity prediction problems with noise annotations. In Proceedings of the AAAI Conference on Artificial Intelligence, Vol. 37. 8023–8031.
- Jo et al. (2022) Jaehyeong Jo, Seul Lee, and Sung Ju Hwang. 2022. Score-based generative modeling of graphs via the system of stochastic differential equations. In International Conference on Machine Learning. PMLR, 10362–10383.
- Kipf and Welling (2016) Thomas N Kipf and Max Welling. 2016. Semi-Supervised Classification with Graph Convolutional Networks. In International Conference on Learning Representations.
- Kuznetsov and Polykovskiy (2021) Maksim Kuznetsov and Daniil Polykovskiy. 2021. MolGrow: A graph normalizing flow for hierarchical molecular generation. In Proceedings of the AAAI Conference on Artificial Intelligence, Vol. 35. 8226–8234.
- Li et al. (2017) Junying Li, Deng Cai, and Xiaofei He. 2017. Learning graph-level representation for drug discovery. arXiv preprint arXiv:1709.03741 (2017).
- Li et al. (2018) Yibo Li, Liangren Zhang, and Zhenming Liu. 2018. Multi-objective de novo drug design with conditional graph generative model. Journal of cheminformatics 10 (2018), 1–24.
- Li et al. (2022) Zenan Li, Qitian Wu, Fan Nie, and Junchi Yan. 2022. Graphde: A generative framework for debiased learning and out-of-distribution detection on graphs. Advances in Neural Information Processing Systems 35 (2022), 30277–30290.
- Limnios et al. (2023) Stratis Limnios, Praveen Selvaraj, Mihai Cucuringu, Carsten Maple, Gesine Reinert, and Andrew Elliott. 2023. Sagess: Sampling graph denoising diffusion model for scalable graph generation. arXiv preprint arXiv:2306.16827 (2023).
- Liu et al. (2023a) Gary Liu, Denise B Catacutan, Khushi Rathod, Kyle Swanson, Wengong Jin, Jody C Mohammed, Anush Chiappino-Pepe, Saad A Syed, Meghan Fragis, Kenneth Rachwalski, et al. 2023a. Deep learning-guided discovery of an antibiotic targeting Acinetobacter baumannii. Nature Chemical Biology (2023), 1–9.
- Liu et al. (2023c) Gang Liu, Eric Inae, Tong Zhao, Jiaxin Xu, Tengfei Luo, and Meng Jiang. 2023c. Data-Centric Learning from Unlabeled Graphs with Diffusion Model. arXiv preprint arXiv:2303.10108 (2023).
- Liu et al. (2023b) Yixin Liu, Kaize Ding, Huan Liu, and Shirui Pan. 2023b. Good-d: On unsupervised graph out-of-distribution detection. In Proceedings of the Sixteenth ACM International Conference on Web Search and Data Mining. 339–347.
- Liu et al. (2023d) Zhenzhen Liu, Jin Peng Zhou, Yufan Wang, and Kilian Q Weinberger. 2023d. Unsupervised Out-of-Distribution Detection with Diffusion Inpainting. arXiv preprint arXiv:2302.10326 (2023).
- Ma et al. (2022) Rongrong Ma, Guansong Pang, Ling Chen, and Anton van den Hengel. 2022. Deep graph-level anomaly detection by glocal knowledge distillation. In Proceedings of the Fifteenth ACM International Conference on Web Search and Data Mining. 704–714.
- Mitton et al. (2021) Joshua Mitton, Hans M Senn, Klaas Wynne, and Roderick Murray-Smith. 2021. A graph vae and graph transformer approach to generating molecular graphs. arXiv preprint arXiv:2104.04345 (2021).
- Niu et al. (2020) Chenhao Niu, Yang Song, Jiaming Song, Shengjia Zhao, Aditya Grover, and Stefano Ermon. 2020. Permutation invariant graph generation via score-based generative modeling. In International Conference on Artificial Intelligence and Statistics. PMLR, 4474–4484.
- Qiu et al. (2022) Chen Qiu, Marius Kloft, Stephan Mandt, and Maja Rudolph. 2022. Raising the bar in graph-level anomaly detection. arXiv preprint arXiv:2205.13845 (2022).
- Reiser et al. (2022) Patrick Reiser, Marlen Neubert, André Eberhard, Luca Torresi, Chen Zhou, Chen Shao, Houssam Metni, Clint van Hoesel, Henrik Schopmans, Timo Sommer, et al. 2022. Graph neural networks for materials science and chemistry. Communications Materials 3, 1 (2022), 93.
- Ruff et al. (2018) Lukas Ruff, Robert Vandermeulen, Nico Goernitz, Lucas Deecke, Shoaib Ahmed Siddiqui, Alexander Binder, Emmanuel Müller, and Marius Kloft. 2018. Deep one-class classification. In International conference on machine learning. PMLR, 4393–4402.
- Song et al. (2021) Yang Song, Conor Durkan, Iain Murray, and Stefano Ermon. 2021. Maximum likelihood training of score-based diffusion models. Advances in Neural Information Processing Systems 34 (2021), 1415–1428.
- Titouan et al. (2019) Vayer Titouan, Nicolas Courty, Romain Tavenard, and Rémi Flamary. 2019. Optimal transport for structured data with application on graphs. In International Conference on Machine Learning. PMLR, 6275–6284.
- Vignac et al. (2022) Clement Vignac, Igor Krawczuk, Antoine Siraudin, Bohan Wang, Volkan Cevher, and Pascal Frossard. 2022. DiGress: Discrete Denoising diffusion for graph generation. In The Eleventh International Conference on Learning Representations.
- Vincent-Cuaz et al. (2022) Cédric Vincent-Cuaz, Rémi Flamary, Marco Corneli, Titouan Vayer, and Nicolas Courty. 2022. Template based graph neural network with optimal transport distances. Advances in Neural Information Processing Systems 35 (2022), 11800–11814.
- Wang et al. (2021) Xiao Wang, Hongrui Liu, Chuan Shi, and Cheng Yang. 2021. Be confident! towards trustworthy graph neural networks via confidence calibration. Advances in Neural Information Processing Systems 34 (2021), 23768–23779.
- Wang et al. (2022) Yuyang Wang, Jianren Wang, Zhonglin Cao, and Amir Barati Farimani. 2022. Molecular contrastive learning of representations via graph neural networks. Nature Machine Intelligence 4, 3 (2022), 279–287.
- Wang et al. (2024) Yili Wang, Kaixiong Zhou, Ninghao Liu, Ying Wang, and Xin Wang. 2024. Efficient Sharpness-Aware Minimization for Molecular Graph Transformer Models. In The Twelfth International Conference on Learning Representations. https://openreview.net/forum?id=Od39h4XQ3Y
- Wieder et al. (2020) Oliver Wieder, Stefan Kohlbacher, Mélaine Kuenemann, Arthur Garon, Pierre Ducrot, Thomas Seidel, and Thierry Langer. 2020. A compact review of molecular property prediction with graph neural networks. Drug Discovery Today: Technologies 37 (2020), 1–12.
- Wu et al. (2022) Bingzhe Wu, Jintang Li, Junchi Yu, Yatao Bian, Hengtong Zhang, CHaochao Chen, Chengbin Hou, Guoji Fu, Liang Chen, Tingyang Xu, et al. 2022. A survey of trustworthy graph learning: Reliability, explainability, and privacy protection. arXiv preprint arXiv:2205.10014 (2022).
- Wu et al. (2023) Qitian Wu, Yiting Chen, Chenxiao Yang, and Junchi Yan. 2023. Energy-based out-of-distribution detection for graph neural networks. arXiv preprint arXiv:2302.02914 (2023).
- Xu et al. (2018) Keyulu Xu, Weihua Hu, Jure Leskovec, and Stefanie Jegelka. 2018. How powerful are graph neural networks? arXiv preprint arXiv:1810.00826 (2018).
- Zhao et al. (2021) Lingxiao Zhao, Wei Jin, Leman Akoglu, and Neil Shah. 2021. From stars to subgraphs: Uplifting any GNN with local structure awareness. arXiv preprint arXiv:2110.03753 (2021).
- Zhou et al. (2020) Kaixiong Zhou, Xiao Huang, Yuening Li, Daochen Zha, Rui Chen, and Xia Hu. 2020. Towards deeper graph neural networks with differentiable group normalization. Advances in neural information processing systems 33 (2020), 4917–4928.
- Zhu et al. (2022) Yanqiao Zhu, Yuanqi Du, Yinkai Wang, Yichen Xu, Jieyu Zhang, Qiang Liu, and Shu Wu. 2022. A survey on deep graph generation: Methods and applications. In Learning on Graphs Conference. PMLR, 47–1.
Appendix A Appendix
A.1. Descriptions of Datasets and Metric
-
•
DrugOOD (Ji et al., 2023) is a systematic OOD dataset curator and benchmark for drug discovery, providing large-scale, realistic, and diverse datasets for graph OOD learning problems. To meet this purpose of covering a wide range of shifts that naturally occur in molecular graphs, we cautiously consider three properties as the basis of dividing ID and OOD, including assay, molecular size, and molecular scaffold. DrugOOD provides an automated method for dividing datasets into ID training sets, ID testing sets, and OOD testing sets. We use the ID training set to generate prototypical graphs during the training phase, and process OOD detection on the ID testing set and OOD testing set since they have different data distributions.
-
•
GOOD (Gui et al., 2022) is a systematic graph OOD benchmark, which provide carefully designed data environments for distribution shifts. Given a domain, it has two kinds of shift strategies: covariate shift, and concept shift. For a supervised dataset, each inputs corresponding to outputs and have the distribution of training set and testing set . The the joint distribution can be written as . In covariate shift, the input distributions have been shifted between training and test data. Formally and . For concept shift, the conditional distribution has been shifted as and . In order to maintain the consistency of datasets we adopted covariate shift.
-
•
AUROC (Area Under the Receiver Operating Characteristic curve), AUPR (Area Under the Precision-Recall curve), and FPR95 (False Positive Rate at True Positive Rate) are metrics commonly used to evaluate the performance of classification models, particularly in the context of binary classification and anomaly or outlier detection tasks such as OOD (Out-Of-Distribution) detection.
A.2. Descriptions of Baseline Methods
In our experiments, we compare the following six methods as baselines:
-
•
MSP (Hendrycks and Gimpel, 2016): MSP utilizes the backbones’ max softmax output as the judge score, where ID has the highest score and OOD has the lowest score.
-
•
GOOD-D (Liu et al., 2023b): By performing hierarchical contrastive learning on the augmented graphs, GOOD detects OOD graphs based on the semantic inconsistency in different granularities.
-
•
GraphDE (Li et al., 2022): GraphDE modeling the graph generative process to characterize the distribution shifts of graph data together with an additionally introduced latent environment variable as an indicator to detect OODs.
-
•
AAGOD (Guo et al., 2023): AAGOD proposes a learnable amplifier to increase the focus on the key pattern of the structure to enlarge the difference between IDs and OODs.
- •
-
•
GLocalKD (Ma et al., 2022): GLocalKD proposes a deep graph anomaly detector based on knowledge distillation for both local and global graphs.
A.3. Analysis of Hyper-Parameters
To analyze the hyper-parameter sensitivity of PGR-MOOD, we experiment on two datasets with different and .


A.3.1. Analysis of
To analyze the impact of hyper-parameters in Eq. (13), which balance the structure term and feature term. We vary in and present the experimental results in Fig. 9a. PGR-MOOD performs best with equal to 0.5, which means it is the fairest way for structure and feature. This fits our needs because we can’t predict which way the OOD shift will be biased, so it makes sense to weight both terms equally.
A.3.2. Analysis of
To analyze the impact of hyper-parameters in Eq. (19), which corresponds to the number of prototypical graph that we need to generate. We vary in and present the experimental results in Fig. 9b. The performance of PGR-MOOD is stable when changes. In fact, the size of does not have a huge impact on the final OOD detection result. The calculation of can eventually traverse the entire , only the memory required for the generation process will be affected.