Optimisation of non-pharmaceutical measures in COVID-19 growth via neural networks
Abstract
On March, the World Health Organisation declared a pandemic. Through this global spread, many nations have witnessed exponential growth of confirmed cases brought under control by severe mass quarantine or lockdown measures. However, some have, through a different timeline of actions, prevented this exponential growth. Currently as some continue to tackle growth, others attempt to safely lift restrictions whilst avoiding a resurgence. This study seeks to quantify the impact of government actions in mitigating viral transmission of SARS-CoV-2 by a novel soft computing approach that makes concurrent use of a neural network model, to predict the daily slope increase of cumulative infected, and an optimiser, with a parametrisation of the government restriction time series, to understanding the best set of mitigating actions. Data for two territories, Italy and Taiwan, have been gathered to model government restrictions in traveling, testing and enforcement of social distance measures as well as people connectivity and adherence to government actions. It is found that a larger and earlier testing campaign with tighter entry restrictions benefit both regions, resulting in significantly less confirmed cases. Interestingly, this scenario couples with an earlier but milder implementation of nationwide restrictions for Italy, thus supporting Taiwan’s lack of nationwide lockdown. The results, found with a purely data-driven approach, are in line with the main findings of mathematical epidemiological models, proving that the proposed approach has value and that the data alone contains valuable knowledge to inform decision makers.
Index Terms:
Covid-19, SARS-CoV-2, Epidemiology, BiLSTM, CNN, ELM, Optimisation, Data gathering.1 Introduction
On December 2019, China reported to the World Health Organisation (WHO) the detection of pneumonia with an unknown etiology in the city of Wuhan [1]. The viral agent was identified as a novel coronavirus, subsequently named SARS-CoV-2 due to genetic similarities to SARS-CoV, that is almost identical (96% whole-genome level) to a known bat coronavirus [2, 3, 4]. Recognising the growing epidemic, China banned travel to and from Wuhan and activated a national emergency response on January, invoking travel and social distancing restrictions on a national scale [5, 6]. Despite these actions, the virus successfully spread on a global level and by March, the WHO had declared a pandemic [7]. The ability of this virus to spread despite acute public awareness and control actions is currently attributed, in part, to viral shedding of presymptomatic cases [8, 9]. With no currently approved vaccines or specific treatments, non-pharmaceutical measures are the frontline of both offense and defense in ‘flattening the curve’ and inhibiting the infamous second wave respectively [10, 11].
Since the initial outbreak, researchers from the machine learning community have implemented Artificial Neural Networks (ANNs) to address mainly two types of problems: (i) virus detection through images and (ii) growth forecasting. For the former, researchers aim to develop an automatic detection system in which a neural network (typically a deep learning model) learns the main characteristics of the resulting pneumonia from historical images of infected patient [12, 13, 14]. In the latter, researchers typically develop a machine learning system to predict the future number of confirmed cases in a country from historical data [15, 16, 17, 18]. The forecasting model typically relies on three types of deep learning networks [19]: Fully-Connected Networks (FCNs), Recurrent Neural Networks (RNNs) and Convolutional Neural Networks (CNNs).
-
•
Fully Connected Networks (FCNs): A FCN is a type of ANN where the architecture is such that all the nodes in one layer are connected to the neurons in the next layer [20]. For example, the combination of FCN and interior search algorithm was proposed in [21] for predicting the future number of infected of COVID-19 people. From a similar perspective, a FCN with three hidden layers was also proposed to predict the number of cases in Mexico [22]. Finally, the FCNs was employed (hybridized in this case with the well-known SIR model) to predict the peak of COVID-19 in Spain [23]
-
•
Recurrent Neural Networks (RNNs): RNNs are the most widely used ANN architecture for addressing time series forecasting in the deep learning community. In RNNs, there is a bidirectional communication between the nodes in the different layers. Thus, the nodes in a particular layer are fed with both the outputs of previous and next layers. The architecture associated to RNNs is particularly interesting as it allows the model to memorize both short and long terms relationships among the desired output and the input variables [24]. Regarding the implementation of RNNs for COVID-19 forecasting, in [16], the authors trained an RNN model with data from the 2003 SARS epidemic for predicting (in a SEIR model) new infections in China. In [25], the authors used a Long Short Term Memory Neural Network (LSTMNN) to predict the number of new cases of COVID-19 in Canada. Similarly, LSTMs were also employed in [26] to forecast the number of cases in India.
-
•
Convolutional Neural Networks (CNNs): A CNN consist of one input and output layer and several hidden layers [27]. The hidden layers of a CNNs are based on a set of convolutional layers that convolve with multiplication or other dot [28]. CNNs have been traditionally employed in image classification, in particular 2-D CNNs. However, they can also be used for times series forecasting, 1D CNNs [29]. In the field of COVID-19 forecasting, CNNs were proposed (as the main architecture [30] or in combination with LSTM models [31]) to analyze and predict the number of confirmed cases in China [30, 31].
Unfortunately, current research on forecasting growth fails on two issues: (i) they do not include a complete set of government decision variables in the study (maybe due to their largely qualitative nature, making it difficult to encode and preprocess with neural networks) and (ii) they do not provide guidelines on how those variables could be combined to mitigate the effect of the virus (at least partially). Motivated by this, we have proposed a soft computing approach where ANNs and optimization techniques are used concurrently to determine a different and optimal scenario of mitigation measures. The novelty of the work is dual: (i) this is the first study of this kind that, by merging data from heterogeneous sources, has created a rich dataset that is able to capture not only government actions but also the reactions and adherence to the regulations of the population; (ii) the analysis of mitigating measures was carried out through a novel optimization approach where the time series of the independent variables have been parameterised. These parameters are subsequently optimised by means of an genetic algorithm for integer programming to generate the new corresponding optimal time series. The neural network model is used to predict the slope of infected people for the new time series.
This paper is organised as follows: Sec. 2 summarises the data gathered, sources used and quantifying techniques. Sec. 3 outlines the neural networks models tested, data preparation and optimization method. Results are listed in Sec. 4 and discussed in Sec. 5. This study is summarised in Sec. 6 with possible future directions outlined.
2 Data: Two territories, two trajectories
2.1 Italy and Taiwan

By mid-February, China had successfully demonstrated that the exponential growth of confirmed cases can be vastly mitigated by mass quarantine or lockdown measures [32]. Unfortunately, by then the virus was beginning to take hold in several nations. In particular, Italy would become the next epicenter of the pandemic [33, 34], with dire consequences on its healthcare system; before the onset of the epidemics, Italy had approximately 5200 intensive care beds available [35], and efforts had to be made to increase this number during the emergency [36]: on April 3rd the number of patients admitted to ICU reached an unprecedented figure of 4068 [34], posing a serious threat on the solidity of the entire system. In these extraordinary circumstances, the Italian government instigated severe lockdown measures similar to those implemented in China [37].
Meanwhile Taiwan, despite its close proximity and frequent flights to China, continued to contain the growth of confirmed cases through different yet efficient and effective government measures [38]. These actions never escalated to a nationwide lockdown. Nevertheless they successfully prevented the exponential growth predicted by unmitigated viral transmission [39], and did not overwhelm their healthcare system.
With the ultimate goal of providing a foundation that could serve policy-makers in the decision process, in regard to managing current outbreaks or preventing a future second-wave, this study aims to understand the impact and effectiveness of the possible measures a nation can employ to inhibit and constrict growth. Thus, we analyse these two different scenarios from two different regions.
2.2 Data gathering
To capture and describe the evolution of the pandemics in the two regions, several variables were employed describing the reaction of the respective governments, its timeliness, the behavior of the community, and the weather conditions. To gather the Italian data, numerous sources were used, namely the Ministry of Health [40], the Ministry of Interior [41] and the Department of Civil Protection [34]. As for Taiwan, the Taiwan Centers for Disease Control (TCDC) released timely reports to the public on government mitigation actions [42]. This was previously reported by [43] for data available until February 2020. We extend this data by two months until April 2020.
Each variable was then coded to obtain a daily time series (Fig. 1). The dataset is summarized below.
Border Control: Several measures have been taken to control border admission. The different levels of action applied to travellers entering the territory were equated to a numeric scale. This ranges from 0 to 5 for national citizens and 0 to 7 for non-nationals, where 0 represents zero constraints and 7 entry banned (5 equates to 14 days quarantine). The impact of these levels is weighted by the daily cases for each territory as recorded by John Hopkins [33]. Details of the method used can be found in Supplementary Material, depicted in Tables 5-7 and Fig. 5.
Italian Enforcement: In Italy, to supervise the compliance of the population to the restrictions, the Ministry of Interior organized a massive monitoring campaign on both individuals and businesses. Failure to comply to the restrictions could result in fines and/or criminal charges for individuals, and fines and/or suspension of the activity for businesses.
The daily report was gathered from the website of the Ministry of Interior [41], and the daily number of police checks on individuals and businesses was averaged to obtain the time series Enforcement.
Taiwan Enforcement: To ensure compliance in Taiwan, Health Declaration Forms [44] and mobile tracking were introduced with violators earning fines and enforced group quarantine. Table 8 in Supplementary Material lists and quantifies these consequences as a step function.
Testing Volume: Starting from February , the Italian Department of Civil Protection released a daily public report of the the number of tests administered, which was gathered from its website [34] and employed as a variable Testing Volume. In Taiwan, the TCDC initiated testing in early January, by March, 13,855 tests had been carried out, with approximately 1000 tests a day since. Testing numbers were released in the TCDC public reports [42]. Days where exact numbers were not released, the daily count has been interpolated by averaging the increase of testing volume over the ‘missing’ days.
Testing Criteria: In Italy, at the beginning of the pandemic diagnostic tests were only performed on symptomatic individuals traveling back from China. Gradually, testing has been extended to a larger part of the population. Each extension of the testing inclusion criteria was modeled as a step in the corresponding variable. The data was gathered from the website of the Ministry of Health [45] and presented in Table 9 in Supplementary Material. In Taiwan, surveillance information was publicly made available by the TCDC [42] and previously noted in [43]. Initial suspect cases were screened for 26 viruses and targeted travellers from Wuhan. As the virus spread, this was extended to symptomatic individuals with close contact to infected individuals, clusters of fever and pneumonia cases unresponsive to antibiotics. Testing of symptomatic individuals was eventually extended to all inbound travellers. The representative step function is described in Table 10 of Supplementary Material.
Government Mitigation: Over the course of the emergency, the Italian Presidency of the Council of Ministers, the Ministry of Health and the Department of Civil Protection issued several decrees and ordinances of increasing severity, aimed at containing the spread of the epidemic. The first measure was the creation of several red zones in Northern Italy, while the last step was the complete nationwide lockdown, along with the suspensions of all productive businesses not directly involved in supplying essential services. Based on the succession of these measures, we modeled the Government Mitigation variable as a step function, with each step corresponding to one of the legal acts. The end value represents the complete national lockdown. In Taiwan, general public communication including heightened hand and respiratory hygiene recommendations started on January through the TCDC [42]. Through chance, school holidays commenced on January, however they were extended for two weeks in response to the increased spread of the virus. From there the government mitigation actions involved heightened hygiene practices with increased social distances guidance, e.g. large gatherings, wearing masks in crowded public places, guidance for educational institutions, etc. Yet, unlike Italy, they did not go into national lockdown. Actions taken by Italy and Taiwan are listed and quantified in Tables 11 and 12 of Supplementary Material respectively.
Online Presence:
A daily measure of home confinement is equated to search query data via the publicly available service Google Trends, using the search terms: Netflix, Amazon Prime Video, Zoom Video Communications, Skype. Corresponding search volume indices were combined into a single variable, Online Presence. In Italy, as Fig. 1 illustrates, an initial peak coincides with the national lockdown (March 8th, Level 5 in Table 11), and remains at high levels until the end of our data collection ( April 2020). In Taiwan, despite no national lockdown activated, an increased home presence can be seen in mid-March in Fig. 1. This coincides with an increase growth curve and hence could be interpreted as the public’s personal response to the increasing number of cases in Taiwan.
National and International Flights: To quantify mobility within and outwith both Italy and Taiwan, data from national and international arriving and outgoing flights have been collected from the online platform Flightradar24 [46].
Temperature and Humidity: A recent study suggests weather parameters such as temperature and humidity can affect the spreading of the virus [47]. Data collected from World Weather Online [48] of 24-hours average temperature () and humidity () values have been added to the data set. The online service has been queried using Taiwan and Italy longitude and latitude representative coordinates (23.7 and 121 for Taiwan, 43 and 12 for Italy). The value of humidity and temperature in a specific location in each region has been taken as representative of that territory in the period observed.
Population Awareness: To quantify people awareness of the phenomena, Google Trends can be used [49]. Data has been collected here by querying people searches related to the list of keywords: ”coronavirus”, ”covid”, ”quarantena”, ”wuhan”, ”virus” (in Italy) and ”coronavirus”, ”covid”, ”quarantine”, ”wuhan”, ”virus” (in Taiwan). For each word the top 5 related queries are collected and the results of all searches aggregated. In Italy, a peak can be observed in the following days of the first case, coinciding with the creation of red zones in Northern Italy (Fig. 1). This diminishes only to return with the national lockdown (March 8th, Level 5 in Table 11). This online presence slowly decreases until the end of our data collection ( April 2020). In Taiwan, interest also initially peaks with the first case, diminishing to peak again as growth begins to surge along with government mitigation. The full list of words used in the google trends analysis for both territories is available in Table 13 of Supplementary Material.
3 Simulating and Optimising Growth Curves
3.1 Neural Network Models
The data collected are used as independent variables for the multivariate time series analysis where the slope is the dependent variable. Three neural network models are tested: 2D Convolutional Neural Network (CNN) [50], Extreme Learning Machine (ELM) [51] and Bidirectional Long Short-Term Memory Neural Network (BiLSTMNN) [52].
CNN:
The deep CNN proposed in this study is composed of four sliding convolutional filters with kernels equal to 8, 16, 32 and 32, each one connected in between by a batch normalisation layer to speed up training and reduce the sensitivity, and a Relu layer to set to zero any value less than zero. The output of the convolutional layers feeds into a dropout layer for regularisation, and a fully connected layer for the continuous prediction of the output, the slope. The model depends on two network parameters: the size of the CNN filter and the dropout layer probability; and three training parameters: the mini-batch size, the learning rate drop factor and drop period.
ELM:
The ELM framework was originally presented as a single hidden layer feedforward neural network, whose connections between input and hidden layers are randomly assigned. The only parameters needed to be tuned are the weights between the hidden and the output layers, which are analytically estimated by solving the standard least-squares minimization problem. This methodology significantly improves the computational burden of the algorithm and allows it to process heavy datasets in a reasonable computational time [53]. ELM models have reported competitive performances in both standard machine learning datasets (regression and classification) [54] and other more challenging problems such as image detection [55], time series [56], topological information [57] or real-time river flow prediction [58]. In this experimental study, the ELM neural network version of the framework with sigmoidal and linear basis functions in the hidden and output layers was considered. The model critically depends on two hyper-parameters: the number of hidden neurons, , and the regularization penalty term, .
LSTMNN: Unlike the two previously described models, the LSTMNN method belongs to the family of Recurrent Neural Networks (RNNs). In traditional Feedforward Neural Networks (FFNNs), information moves only in a direct way from the input layer to the output one. RNNs are based on an architecture in which the data through the system moves constituting a direct cycle [59]. The main difference between standard RNNs and LSTMNNs models is that the latter are capable of memorizing a time series value for an arbitrary length of time. The model used in this study is a Bidirectional LSTM (BiLSTM) network. This is usually a superior prediction approach in time series forecasting than the simple LSTM model, as it learns from the complete time series data (past and future states). The model depends on three network hyper-parameters: the number of hidden neurons in the bidirectional LSTM layer, the size of the first fully connected layer, the dropout probability rate; and three training hyper-parameters (initial learning rate, learning rate drop period and factor).
The optimal set of hyperparameters for the neural networks have been obtained by minimising the root mean square error on the predictions by means of a Bayesian optimisation process. Bayesian optimisation is an algorithm used in global optimisation to minimise a certain objective function, treated as a black box, by varying the value of its independent variables. The algorithm itself relies on an internal Gaussian process that approximates the objective function, and is trained by subsequent evaluations of the true objective. The approximated model is used for optimisation to reduce computational costs and for its robust nature with stochastic noise in function evaluations.
3.2 Data preparation
The collected data has been divided for training and testing, and reshaped as feature input for the multivariate time series analysis. Furthermore, in order to be able to use the neural network models for the subsequent analysis, the optimisation of government restrictions, the dependence of the historical values of the dependent variables is omitted from the input features space. Hence for the ELM and BiLSTMNN models the input features are modelled as the vector
| (1) |
where is the time window parameters, and is the vector of independent variables at time as described in the Data Collection section. Conversely for the CNN model the input space is defined as
| (2) |
where is the -th independent variable at time . The hyperparameter is optimised, by means of a Bayesian optimisation process, together with the networks hyperparameters.
3.3 Optimisation
The best trained neural network model (BiLSTMNN) is used to have a deeper understanding of government regulations and their impact on the slope function. Taking
| (3) |
as the neural network model, where or depending on the model used, the following optimisation problem has been formulated
| (4) |
where is the objective function defined as the maximum value of the slope along the whole time frame considered.
| (5) |
The daily slope value is computed as the angular coefficient of the linear regression of the values of daily cumulative infected of the current day and two days ahead, as a smoother representation of the daily number of infected. is a set of optimisation variables designed to model government restrictions previously discussed (border control, enforcement, testing volume, testing criteria, social distance, flight volume and people awareness), excluding weather parameters as they are not controllable by government. The complete set of optimisation variables for each territory is described in Table I. is the feasible region defined by the lower and upper bounds of the set of optimisation variables with some constraints. Inequality constraints are introduced to enforce the temporal order of the variables modelling quarantine incoming and the step functions of social distance, quarantine control (only for Taiwan) and testing criteria. To avoid the optimisation converging towards a temporal delay of the first case, an equality constraint is introduced to ensure the day of first confirmed case matches reality. The optimisation problem aims to minimize the maximum value of the slope - this can be interpreted as minimising the number of daily infections so to not put the health care system under extreme strain.
| Italy | Taiwan | |
| Quarantine incoming: variables are dates of actions as highlighted in Tables 6 and 7 in Supplementary material. | ||
| Quarantine control: for Italy the first variable models the time and the second variable models the shift; for Taiwan the first variable models the time of the initial step and the rest of the variables model the step function interval sizes | ||
| Testing: the variable models the shift in time of the day in which testing had a steep increase | ||
| Testing criteria: the first variable models the time of the initial step and the rest of the variables model the step function interval sizes | ||
| Social distance: the first variable models the time of the initial step and the rest of the variables model the step function interval size | ||
| Social distance online platform: the first variable models the time and the second variable models the shift | ||
| Flights national: the first variable models the time and the second variable models the shift | ||
| Flights international: the first variable models the time and the second variable models the shift | ||
| People awareness: the first variable models the time and the second variable models the shift |
For Italy the problem can be formulated mathematically as
| (6) | |||
| s.t | |||
| (7) | |||
| (8) | |||
| (9) | |||
| (10) | |||
| (11) |
where
| (12) |
is the matrix defining the linear inequality temporal constraints on the quarantine incoming variables. is the time horizon parameter, and are the vectors defining the lower and upper bounds of the optimisation variables. For Taiwan the problem is defined as,
| (13) | |||
| s.t | |||
| (14) | |||
| (15) | |||
| (16) | |||
| (17) | |||
| (18) | |||
| (19) |
with
| (20) |
| (21) |
where and are the matrices defining the linear inequality temporal constraints on the quarantine incoming variables.
The integer programming Genetic Algorithm is used to solve the optimisation problem. Genetic Algorithms are stochastic global optimisation strategies that mimic the behaviour of natural biological evolution of mutation and crossover. They are initialised with a pool of potential solutions and by evolutionary operators and applying the principle of survival of the fittest, increasingly better offspring populations are generated, which terminate when no further improvements can be made. Genetic algorithms have the main advantage that they can solve problems with integer variables and the objective function is treated as a black box.
3.4 Summary of the computational approach
We propose a soft computing algorithm which combines neural networks and genetic algorithms, to determine (from a purely data-driven approach), the best set of mitigating actions. The algorithm is based on two independent stages that are summarized below and outlined in Algorithm. 1.
In the first stage, a set of neural networks models are trained to estimate the daily slope increase of cumulative infected from variables such as government actions and the reactions and adherence of the population to such regulations. The best performing model is selected taking into account the reported root mean square percentages of the neural networks implemented. The choice of training a neural network model per territory is driven by the need of capturing region specific static parameters. Time-varying parameters that have an influence on the predicted growth curve, and are not among those described in Sec. 2.2, can still be captured by the network model as hidden features if they are correlated to the input variables selected.
In the second stage, the best performing neural network (BiLSTMNN) is used as a surrogate model in an optimization procedure that targets the best set of mitigating actions. The optimization procedure incorporates an ad-hoc parametrization of the time series governmental restrictions. These parameters are then optimised through genetic algorithm for integer programming to generate the new corresponding optimal time series. The algorithmic flow of this soft computing approach is provided below.
4 Results
4.1 Neural Network model
In this section, the performance of the different neural networks models for Italy and Taiwan are statistically compared. For model selection, following the recommendations reported in [60], the time series were split in two parts: (i) the training set is roughly the first 2 and a half months of data; and (ii) the generalization set is the last section of each time series. The training set was used to estimate the parameters of the models and the generalization set to assess the performance of the different neural networks in unseen data [60]. In the experiments, the generalization set included the last five points of each time series, as suggested in [61]. Table II shows the Root Mean Square Error Percentage (RMSEP) in the generalization set of the best run per model (out of 1000 runs), , and the variation coefficient of the RMSEP in the generalization set for the different models implemented, . Furthermore, taking into account the set of RMSEPs of the different models over the different runs, the mean rankings of RMSEP, , for the different neural networks models are obtained (Table II). From the analysis of the results, it can be concluded, from a purely descriptive point of view, that the BiLSTMNN method obtained the best results in the two problems considered in mean rankings. Additionally, the best BiLSTMNN achieved the best RMSEP in Taiwan and second best in Italy (more consistent performance, more homogeneous results, better CV).
| Italy | |||||
| Models | p-value | ||||
| CNN | 0.0277 | 0.4858 | 6.0589 | ||
| ELM | 0.0529 | 0.3031 | 6.1222 | ||
| BiLSTMNN | 0.0492 | 0.3005 | 2.8189 | - | |
| Taiwan | |||||
| Models | p-value | ||||
| CNN | 0.1775 | 0.5056 | 4.6589 | 0.3942 | |
| ELM | 0.1367 | 0.3348 | 6.0011 | ||
| BiLSTMNN | 0.1402 | 0.4350 | 4.3400 | - | |
In this study, hypothesis testing was used to provide statistical support for the discussion of the results. A performance analysis through parametric tests could lead to mistaken conclusions in this research study. A previous evaluation of the RMSEP values provided by the implemented methods resulted in rejecting the normality and equality of the variance hypothesis. For these reasons, nonparametric tests were implemented to determine the statistical significance of the results previously reported [62]. Specifically, two non-parametric Friedman tests were carried out with the rankings of RMSEP of the models. For the two multivariate time series considered, the -values associated to the Friedman test were smaller than 0.05 (), and therefore, the null hypotheses stating that all algorithms perform equally in mean RMSEP rankings were rejected for both problems.
Based on this rejection, the nonparametric Bonferroni Dunn-Sidak test was implemented to compare all neural network methods to the BiLSTMNN method (which was used as the control method) [63]. Table II shows the p-value results of the Bonferroni Dunn-Sidak test for the two problems considered. Thus, the Bonferroni Dunn-Sidak’s tests indicate that the control method (BiLSTMNN) statistically outperforms all the remaining models in Italy and also outperforms, in statistical terms, the ELM model for Taiwain. Furthermore, the BiLSTMNN method achieves the best mean ranking in the two problems considered, which, in our opinion, justifies our decision to use it as the base model for the next stage (optimization study). An analogous study was also performed to determine the model to be analyzed within all the different BiLSTMNN configurations.
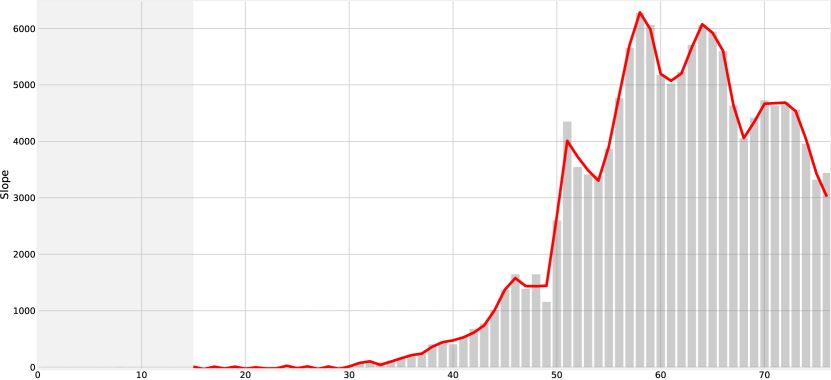
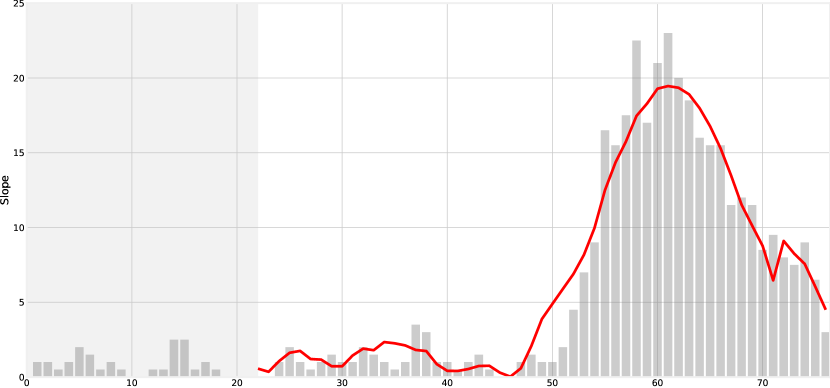
The best BiLSTMNN model for each region is obtained for the optimal value of hyperparameters reported in Table III, the network visualisation model in Fig. 2 and the prediction model in Fig. 3.
| BiLSTMNN | Italy | Taiwan |
| Time Window | 14 | 21 |
| Number of Hidden Units | 155 | 770 |
| First Layer Size | 469 | 107 |
| Dropout Layer probability | 0.18 | 0.69 |
| Initial Learn Rate | 2.4e-04 | 5.2e-06 |
| Learn Rate Drop Factor | 0.02 | 0.01 |
| Learn Rate Drop Period | 111 | 88 |
The multivariate time series model captures the trend of the slope in both cases, with a more accurate overall error in the case of Italy (due to the less noisy nature of the Italian time series). It is important to clarify, as mentioned previously, that the lagged values of the slope, cumulative cases or daily cases were not included in the model to reduce dependence between input variables and assist the interpretation of the optimum values. These variables are usually the most discriminant in times series analysis, which highlights even more the competitive results yielded. Thus, the BiLSTMNN is the appealing approach for this problem.

4.2 Optimisation
A genetic algorithm has been used to solve the corresponding optimisation problem for each region and promising results have been found that do not contradict previous findings of epidemiological models (Figures 4 and 5). All variables are considered integer and optimised within the bounds reported in Table IV, together with their optimal value. The genetic algorithm, with population size of 100 and the maximum number of generations set to 1000, has been run with the stopping criteria set as the maximum number of generations reached or the average relative change in the best fitness function value over 100 generations being less than or equal to a tolerance of .
| Italy | bounds | optimal value | Taiwan | bounds | optimal value |
| [1,20], [5,25], [20,76] | 13, 21, 46 | [1 3], [1 5], [1 5], [1 9], [24 44], [48 68], [31 51], [25 45], [27 47], [36 56], [43 63], [40 60] | 1, 1, 1, 1, 24, 68, 31, 25, 47, 36, 43, 40 | ||
| [15, 50], [-14,14] | 44, -11 | [1,20], | 20, 48, 1, 1, 1, 1, 1 | ||
| [20,50] | 24 | [30,60] | 31 | ||
| [1,10], | 3, 3, 23, 30, 15 | [1,20], | 1, 1, 1, 1, 5, 1, 1, 27 | ||
| [20,40], | 22, 17, 14, 1, 1, 10, 8, 3 | [1,20], | 1, 1, 1, 1, 1, 1, 1, 1, 1, 1, 5, 30, 1, 1, 1, 1, 1, 1 | ||
| [15,50], [-14,14] | 49, -3 | [15,70], [-14,14] | 15, 14 | ||
| [15,50], [-14,14] | 26, 14 | [15,70], [-14,14] | 15, 14 | ||
| [15,50], [-14,14] | 16, -6 | [15,70], [-14,14] | 15, 14 | ||
| [15,50], [-14,14] | 26, -13 | [15,70], [-14,14] | 34, 14 |
The optimisation process for Italy terminates after almost 600 iterations when the change in the penalty fitness value is less than the allowable tolerance. All constraints are satisfied and the final objective function is 3755, with respect to the original value of 6272. This is almost a reduction with respect to the original value and equates to a reduction of almost 21,700 infected individuals at the end of the prediction horizon, corresponding to of the actual total value.
The optimisation process for Taiwan terminates after almost 300 iterations again when the change in the penalty fitness value is less than the allowable tolerance. All constraints are satisfied and the final objective function is 7.6, with respect to the original value of 23. This is almost a reduction with respect to the original vale and a reduction of 102 infected individuals at the end of the prediction horizon, corresponding to of the real value.


5 Discussion
5.1 Italy
As illustrated in Fig. 4, an earlier and more extensive testing campaign (+56) could have been combined with an earlier creation of red zones in Northern Italy and, interestingly, with a milder implementation of the government mitigation plan on the rest of the country: the localized restrictions could have been maintained as sufficient measures until March. Furthermore, in this scenario the country-wide suspension of manufacturing businesses, a measure burdened with a substantial socio-economic impact, is delayed and limited to a shorter period of time, while the volume of police checks, aimed at monitoring the population compliance, is larger and commences earlier. This is all combined with an earlier and more pervasive consciousness of the public about the risk posed by the epidemics and thus on the benefits of a temporary reduction of social contacts.
The containment of the growth is also optimally managed in Italy by earlier restrictive regulations on the intra- and extra- Schengen air traffic, and by entry restrictions that span beyond the mere suspension of direct flights to and from China. As for the national air traffic, it could have been maintained unrestricted for a longer timeframe: a finding to be read in the context of larger and earlier testing, larger and earlier volume of police checks, better awareness of the public, increased control on the infections potentially coming from abroad.
5.2 Taiwan
Although government actions in Taiwan successfully prevented exponential growth of confirmed cases, the optimised model predicts earlier actions would have damped growth even further as outlined in Fig. 5. By allowing movable dates on border control decisions, Taiwan would have benefited from even earlier actions against China (by a few days) and earlier self-health management and home quarantine regulations against selected nations (those shaded in Table 7 of Supplementary Material in February and March, prior to March by the maximum 10 days allowed). This allows a later date for the travel restriction on all foreign nationals that was implemented on March, as well as a slight delay in the decrease of international flight volume. The optimizer increases testing volume 2 weeks earlier than reality and suggests community surveillance and mandatory testing for incoming travellers in the first week of the observatory period. Actions regarding mitigating internal spread are also suggested earlier - heightened hygiene practices, self-health management of positive cases’ contact and social distance guidelines should have occurred at least 3 weeks earlier (comparison of Fig. 5 and Table 12 in Supplementary Material). In addition, national flight volume should be kept low to inhibit internal spread. This allows less people to stay at home as illustrated by the reduced online presence. Finally we see people awareness and quarantine control can both be delayed, the latter significantly. This suggests the Taiwan public awareness is sufficient, and enforcement measures like fines and mandatory quarantine may not be necessary.
5.3 Comparison
Care must be taken in comparing the growth and government actions for two different territories. All data is not equal; different testing methods, diagnostic criteria and methods of counting confirmed cases can affect comparisons. There may also be underlying themes behind data / variables, e.g., the availability of personal protection equipment like masks to enable adherence to control measures and keep health workers safe (3 workers from healthcare settings where reported positive by TCDC [42], while in Italy more than 28,000 healthcare workers contracted the virus by the end of April [64, 65]), the method and extent of a region’s track and trace program in locating high risk individuals, cultural / social response of a population to government actions, healthcare capacity and quality in early isolation and treatment (0.86 vs 3.02 ICU beds per 10,000 population in Italy [35] and Taiwan [66] respectively). To overcome such inequity of data in this study, Italy and Taiwan were simulated independently. Variables were chosen to be those for which there was data readily available and have a) known or suspected effect on growth curves or b) an ability to highlight any differences between the two territories. Any overarching themes are then considered.
Testing: In volume of testing per number of confirmed cases, Taiwan exceeded Italy [67]. In volume of testing per population, the roles reverse while Taiwan began testing earlier. Regardless, in modelling both regions, the same recommendation resulted from optimization, higher testing volume (and earlier). This agrees with results from a recent model that distinguishes between tested and untested infections cases [68], benefits of systematic testing [69] as well as statistical observations from South Korea [70]: extensive testing with track and trace and social distance restrictions may contain the growth to an extent where a national lockdown can be avoided.
Border control: Either a reduction in international flights is required or a strong border control measure. We see these two measures ‘meet’ in Fig. 4 for Italy, where the optimizer only allowed 10 day shifts. The border control in optimized Taiwan doesn’t drop below (which is obtainable by 10 day shifts), which is roughly satisfied by mandatory 14 day home quarantine for incoming travellers from infected areas (pending on incoming / outgoing traveller ratios). This allows slightly more international flights (Fig. 5). These translate to earlier action against other nations than China for both Italy and Taiwan.
People awareness and compliance: In Taiwan, enforcement of regulations appears not to be a driving factor while people awareness is seemed to be almost ideal. Italy, on the other hand, would have benefited from earlier awareness by the public and earlier implementation of quarantine control. These results seem to highlight the cultural and social differences of the two territories and can be justified empirically using the well-known Hofstede dimensions [71]. Specifically, with a score of 50 in the Power Distance dimension, Northern Italy tends to prefer equality and a decentralisation of power and decision-making. Control and formal supervision is generally disliked among the younger generation. Furthermore, the high score obtained in the Individualism dimension (76 points) accentuates the aversion of the Italian citizen to being supervised and limited in his/her autonomy. Conversely, Taiwan is a hierarchical society in which people accept that hierarchical order and needs no further justifications (the scores in the Individualism and Power Distance dimensions are 17 and 58 points, respectively).
National lockdown: Taiwan never implemented a national lockdown and our results support this decision, even hinting that the observed self-inflicted increase in home activities carried out by the public was not necessary. However maintaining hygiene and social distancing while in public was deemed important and should have happened earlier. Italy, alternatively may have delayed or reduced their nationwide lockdown as a result of increasing testing, border control, quarantine enforcement, public awareness and restrictions localized in the most affected areas.
Limitations: It must be noted that neural networks have limitations as they behave as stochastic processes. It should therefore be highlighted that this study further complements existing results by mathematical modelling and statistical analysis. That a data-only driven model arrives at the same results, further fortifies their conclusions. It should also be noted that hindsight is 20-20. This study does not serve to criticise governments’ management of the pandemic but to assist in preventing a second wave. In particular at the time of most national lockdowns: China was the only example of a nation that had recovered from exponential growth (accomplished by a nationwide lockdown); a large part of the research this study supports was not yet complete; the power of testing and border control illustrated by South Korea and Taiwan respectively had not been fully witnessed; and knowledge of the virus and how it spread via pre-symptomatic individuals or reservoirs was not yet known. However, this exemplifies that as research continues and expands, so will our knowledge and with that more and more tools to overcome this pandemic.
6 Conclusion
This is the first purely data-driven study where quantitative and qualitative data have been merged and used in a multivariate time series model aimed at predicting the daily increase of the cumulative infected people. We provide an updated and extensive epidemiology overview of both Italy and Taiwan. The purely data-driven approach yielded results that are in line with the main findings of the epidemiological models, proving that the approach has value and that the data alone contains valuable knowledge to inform decision makers.
An in depth discussion of the results obtained has been provided for each of the territories analysed: our main finding being earlier and larger deployment of testing among the population and national entry restrictions allow an easing of lockdown. These are combined with socio-cultural identification of driving factors in each individual territory; stricter enforcement of regulations and information in Italy and relaxation of control measures and self-imposed home confinement in Taiwan. These results give scientific insight to the impact of government actions, fortifying those results previously shown with purely epidemiological models. Hence, this strengthens the foundation for policy makers in constraining growth in current outbreaks and future potential second waves.
This first proof of principle can be built on in several dimensions. One can include more variables, into the time series, for example the availability of ICU beds or personal protection equipment (masks, facial shields). A similar study can be completed for other countries that have experienced a different trend in infections growth rate and that have implemented differently containment measures, e.g., Sweden, United States, Australia, New Zealand, etc. The different models can be analysed in comparison to further increase our understanding of the relation between government actions and social behaviour, and the growth of the epidemics.
This study, along with further developments, in turn can be used to build on existing epidemiology models with the addition of new variables and their fine-tuned effects.
Acknowledgments
The authors would like to thank all individuals that have and continue to partake in the global effort of collecting epidemiological data of the SARS-CoV-2 pandemic. In particular the Taiwan CDC, the Italian Department of Civil Protection and the John Hopkins University Center for Systems Science and Engineering for making so much data publicly available. We thank Tom Gheysens for insightful discussions.
AR is funded by SFC Scottish Funding Council. JG is funded by the ERC Consolidator Grant 773202 ERC-2017-COG ‘BabyRhythm’. FFN is funded by the Spanish Ministry of Science under Project ENE2017-88889-C2-1-R. AH is is funded by the Natural Sciences and Engineering Research Council of Canada. Research at Perimeter Institute is supported in part by the Government of Canada through the Department of Innovation, Science and Economic Development Canada and by the Province of Ontario through the Ministry of Colleges and Universities.
The authors declare no competing interests. Data will be made available via github prior to publication.
References
- [1] W. H. Organization, “Novel coronavirus (2019-ncov): situation report, 1,” Technical documents, 2020-01-21.
- [2] R. Lu, X. Zhao, J. Li, P. Niu, B. Yang, H. Wu, W. Wang, H. Song, B. Huang, N. Zhu, Y. Bi, X. Ma, F. Zhan, L. Wang, T. Hu, H. Zhou, Z. Hu, W. Zhou, L. Zhao, J. Chen, Y. Meng, J. Wang, Y. Lin, J. Yuan, Z. Xie, J. Ma, W. J. Liu, D. Wang, W. Xu, E. C. Holmes, G. F. Gao, G. Wu, W. Chen, W. Shi, and W. Tan, “Genomic characterisation and epidemiology of 2019 novel coronavirus: implications for virus origins and receptor binding,” The Lancet, vol. 395, no. 10224, pp. 565 – 574, 2020. [Online]. Available: http://www.sciencedirect.com/science/article/pii/S0140673620302518
- [3] F. Wu, S. Zhao, B. Yu, Y.-M. Chen, W. Wang, Z.-G. Song, Y. Hu, Z.-W. Tao, J.-H. Tian, Y.-Y. Pei, M.-L. Yuan, Y.-L. Zhang, F.-H. Dai, Y. Liu, Q.-M. Wang, J.-J. Zheng, L. Xu, E. C. Holmes, and Y.-Z. Zhang, “A new coronavirus associated with human respiratory disease in china,” Nature, vol. 579, no. 7798, pp. 265–269, 2020. [Online]. Available: https://doi.org/10.1038/s41586-020-2008-3
- [4] P. Zhou, X.-L. Yang, X.-G. Wang, B. Hu, L. Zhang, W. Zhang, H.-R. Si, Y. Zhu, B. Li, C.-L. Huang, H.-D. Chen, J. Chen, Y. Luo, H. Guo, R.-D. Jiang, M.-Q. Liu, Y. Chen, X.-R. Shen, X. Wang, X.-S. Zheng, K. Zhao, Q.-J. Chen, F. Deng, L.-L. Liu, B. Yan, F.-X. Zhan, Y.-Y. Wang, G.-F. Xiao, and Z.-L. Shi, “A pneumonia outbreak associated with a new coronavirus of probable bat origin,” Nature, vol. 579, no. 7798, pp. 270–273, 2020. [Online]. Available: https://doi.org/10.1038/s41586-020-2012-7
- [5] H. Tian, Y. Liu, Y. Li, C.-H. Wu, B. Chen, M. U. G. Kraemer, B. Li, J. Cai, B. Xu, Q. Yang, B. Wang, P. Yang, Y. Cui, Y. Song, P. Zheng, Q. Wang, O. N. Bjornstad, R. Yang, B. T. Grenfell, O. G. Pybus, and C. Dye, “An investigation of transmission control measures during the first 50 days of the covid-19 epidemic in china,” Science, vol. 368, no. 6491, pp. 638–642, 2020. [Online]. Available: https://science.sciencemag.org/content/368/6491/638
- [6] M. Chinazzi, J. T. Davis, M. Ajelli, C. Gioannini, M. Litvinova, S. Merler, A. Pastore y Piontti, K. Mu, L. Rossi, K. Sun, C. Viboud, X. Xiong, H. Yu, M. E. Halloran, I. M. Longini, and A. Vespignani, “The effect of travel restrictions on the spread of the 2019 novel coronavirus (covid-19) outbreak,” Science, vol. 368, no. 6489, pp. 395–400, 2020. [Online]. Available: https://science.sciencemag.org/content/368/6489/395
- [7] W. H. Organization, “Coronavirus disease 2019 (covid-19): situation report, 51,” Technical documents, 2020-03-11.
- [8] X. He, E. H. Y. Lau, P. Wu, X. Deng, J. Wang, X. Hao, Y. C. Lau, J. Y. Wong, Y. Guan, X. Tan, X. Mo, Y. Chen, B. Liao, W. Chen, F. Hu, Q. Zhang, M. Zhong, Y. Wu, L. Zhao, F. Zhang, B. J. Cowling, F. Li, and G. M. Leung, “Temporal dynamics in viral shedding and transmissibility of covid-19,” Nature Medicine, vol. 26, no. 5, pp. 672–675, 2020. [Online]. Available: https://doi.org/10.1038/s41591-020-0869-5
- [9] B. Rockx, T. Kuiken, S. Herfst, T. Bestebroer, M. M. Lamers, B. B. Oude Munnink, D. de Meulder, G. van Amerongen, J. van den Brand, N. M. A. Okba, D. Schipper, P. van Run, L. Leijten, R. Sikkema, E. Verschoor, B. Verstrepen, W. Bogers, J. Langermans, C. Drosten, M. Fentener van Vlissingen, R. Fouchier, R. de Swart, M. Koopmans, and B. L. Haagmans, “Comparative pathogenesis of covid-19, mers, and sars in a nonhuman primate model,” Science, vol. 368, no. 6494, pp. 1012–1015, 2020. [Online]. Available: https://science.sciencemag.org/content/368/6494/1012
- [10] S. M. Kissler, C. Tedijanto, E. Goldstein, Y. H. Grad, and M. Lipsitch, “Projecting the transmission dynamics of sars-cov-2 through the postpandemic period,” Science, vol. 368, no. 6493, pp. 860–868, 2020. [Online]. Available: https://science.sciencemag.org/content/368/6493/860
- [11] K. Leung, J. T. Wu, D. Liu, and G. M. Leung, “First-wave covid-19 transmissibility and severity in china outside hubei after control measures, and second-wave scenario planning: a modelling impact assessment,” The Lancet, vol. 395, no. 10233, pp. 1382 – 1393, 2020. [Online]. Available: http://www.sciencedirect.com/science/article/pii/S0140673620307467
- [12] I. D. Apostolopoulos and T. A. Mpesiana, “Covid-19: automatic detection from x-ray images utilizing transfer learning with convolutional neural networks,” Physical and Engineering Sciences in Medicine, p. 1, 2020.
- [13] L. Wang and A. Wong, “Covid-net: A tailored deep convolutional neural network design for detection of covid-19 cases from chest radiography images,” arXiv, pp. arXiv–2003, 2020.
- [14] P. Afshar, S. Heidarian, F. Naderkhani, A. Oikonomou, K. N. Plataniotis, and A. Mohammadi, “Covid-caps: A capsule network-based framework for identification of covid-19 cases from x-ray images,” arXiv preprint arXiv:2004.02696, 2020.
- [15] K. Roosa, Y. Lee, R. Luo, A. Kirpich, R. Rothenberg, J. Hyman, P. Yan, and G. Chowell, “Real-time forecasts of the covid-19 epidemic in china from february 5th to february 24th, 2020,” Infectious Disease Modelling, vol. 5, pp. 256–263, 2020.
- [16] Z. Yang, Z. Zeng, K. Wang, S.-S. Wong, W. Liang, M. Zanin, P. Liu, X. Cao, Z. Gao, Z. Mai et al., “Modified seir and ai prediction of the epidemics trend of covid-19 in china under public health interventions,” Journal of Thoracic Disease, vol. 12, no. 3, p. 165, 2020.
- [17] F. Petropoulos and S. Makridakis, “Forecasting the novel coronavirus covid-19,” PloS one, vol. 15, no. 3, p. e0231236, 2020.
- [18] D. Fanelli and F. Piazza, “Analysis and forecast of covid-19 spreading in china, italy and france,” Chaos, Solitons & Fractals, vol. 134, p. 109761, 2020.
- [19] N. Shone, T. N. Ngoc, V. D. Phai, and Q. Shi, “A deep learning approach to network intrusion detection,” IEEE Transactions on Emerging Topics in Computational Intelligence, vol. 2, no. 1, pp. 41–50, 2018.
- [20] J. Li, B. Li, J. Xu, R. Xiong, and W. Gao, “Fully connected network-based intra prediction for image coding,” IEEE Transactions on Image Processing, vol. 27, no. 7, pp. 3236–3247, 2018.
- [21] R. M. Rizk-Allah and A. E. Hassanien, “Covid-19 forecasting based on an improved interior search algorithm and multi-layer feed forward neural network,” arXiv preprint arXiv:2004.05960, 2020.
- [22] O. Torrealba-Rodriguez, R. Conde-Gutiérrez, and A. Hernández-Javier, “Modeling and prediction of covid-19 in mexico applying mathematical and computational models,” Chaos, Solitons & Fractals, p. 109946, 2020.
- [23] G. Baltas, F. A. Prieto Rodríguez, M. Frantzi, C. García Alonso, P. Rodríguez Cortés et al., “Monte carlo deep neural network model for spread and peak prediction of covid-19,” 2020.
- [24] F. Fernández-Navarro, M. A. de la Cruz, P. A. Gutiérrez, A. Castaño, and C. Hervás-Martínez, “Time series forecasting by recurrent product unit neural networks,” Neural Computing and Applications, vol. 29, no. 3, pp. 779–791, 2018.
- [25] V. K. R. Chimmula and L. Zhang, “Time series forecasting of covid-19 transmission in canada using lstm networks,” Chaos, Solitons & Fractals, p. 109864, 2020.
- [26] A. Tomar and N. Gupta, “Prediction for the spread of covid-19 in india and effectiveness of preventive measures,” Science of The Total Environment, p. 138762, 2020.
- [27] S. D. Liang, “Optimization for deep convolutional neural networks: How slim can it go?” IEEE Transactions on Emerging Topics in Computational Intelligence, vol. 4, no. 2, pp. 171–179, 2018.
- [28] H. Wang, C. Li, X. Zhen, W. Yang, and B. Zhang, “Gaussian transfer convolutional neural networks,” IEEE Transactions on Emerging Topics in Computational Intelligence, vol. 3, no. 5, pp. 360–368, 2019.
- [29] J. C. B. Gamboa, “Deep learning for time-series analysis,” arXiv preprint arXiv:1701.01887, 2017.
- [30] C.-J. Huang, Y.-H. Chen, Y. Ma, and P.-H. Kuo, “Multiple-input deep convolutional neural network model for covid-19 forecasting in china,” medRxiv, 2020.
- [31] S. Dutta, S. K. Bandyopadhyay, and T.-H. Kim, “Cnn-lstm model for verifying predictions of covid-19 cases,” Asian Journal of Research in Computer Science, pp. 25–32, 2020.
- [32] Kraemer, Moritz U. G. and Yang, Chia-Hung and Gutierrez, Bernardo and Wu, Chieh-Hsi and Klein, Brennan and Pigott, David M. and , and du Plessis, Louis and Faria, Nuno R. and Li, Ruoran and Hanage, William P. and Brownstein, John S. and Layan, Maylis and Vespignani, Alessandro and Tian, Huaiyu and Dye, Christopher and Pybus, Oliver G. and Scarpino, Samuel V., “The effect of human mobility and control measures on the covid-19 epidemic in china,” Science, vol. 368, no. 6490, pp. 493–497, 2020. [Online]. Available: https://science.sciencemag.org/content/368/6490/493
- [33] “The covid-19 data repository by the center for systems science and engineering (csse) at johns hopkins university,” https://github.com/CSSEGISandData/COVID-19, accessed: 2020-04-24.
- [34] “Protezione civile,” http://www.protezionecivile.gov.it/, 2020, [Online; accessed 04-May-2020].
- [35] R. Angelico, S. Trapani, T. M. Manzia, L. Lombardini, G. Tisone, and M. Cardillo, “The covid-19 outbreak in italy: initial implications for organ transplantation programs,” American Journal of Transplantation.
- [36] G. Grasselli, A. Pesenti, and M. Cecconi, “Critical care utilization for the covid-19 outbreak in lombardy, italy: early experience and forecast during an emergency response,” Jama, vol. 323, no. 16, pp. 1545–1546, 2020.
- [37] A. Remuzzi and G. Remuzzi, “Covid-19 and italy: what next?” The Lancet, vol. 395, no. 10231, pp. 1225 – 1228, 2020. [Online]. Available: http://www.sciencedirect.com/science/article/pii/S0140673620306279
- [38] C.-C. Lai, C.-Y. Wang, Y.-H. Wang, S.-C. Hsueh, W.-C. Ko, and P.-R. Hsueh, “Global epidemiology of coronavirus disease 2019 (covid-19): disease incidence, daily cumulative index, mortality, and their association with country healthcare resources and economic status,” International Journal of Antimicrobial Agents, vol. 55, no. 4, p. 105946, 2020. [Online]. Available: http://www.sciencedirect.com/science/article/pii/S0924857920300960
- [39] W. O. Kermack and A. G. Mckendrick, “A contribution to the mathematical theory of epidemics,” 1927, p. 700–721.
- [40] “Trovanorme - ministero della salute,” http://www.trovanorme.salute.gov.it/, 2020, [Online; accessed 04-May-2020].
- [41] “Ministero dell’interno, i dati dei servizi di controllo,” https://www.interno.gov.it/it/coronavirus-i-dati-dei-serviziodicontrollo, 2020, [Online; accessed 04-May-2020].
- [42] “Taiwan centers of disease control,” https://www.cdc.gov.tw/En, accessed: 2020-04-24.
- [43] C. J. Wang, C. Y. Ng, and R. H. Brook, “Response to COVID-19 in Taiwan: Big Data Analytics, New Technology, and Proactive Testing,” JAMA, vol. 323, no. 14, pp. 1341–1342, 04 2020. [Online]. Available: https://doi.org/10.1001/jama.2020.3151
- [44] “Taiwan centers of disease control health declaration and home quarantine notice,” https://www.cdc.gov.tw/En/File/Get/f7cDmcivdtKBDvAhJt9SVg, accessed: 2020-04-24.
- [45] “Ministero della salute - normativa,” http://www.salute.gov.it/portale/documentazione, 2020, [Online; accessed 04-May-2020].
- [46] “Flightradar24,” https://www.flightradar24.com/, accessed: 2020-04-24.
- [47] N. AL-Rousan and H. Al-Najjar, “Nowcasting and Forecasting the Spreading of Novel Coronavirus 2019-nCoV and Its Association with Weather Variables in 30 Chinese Provinces: A Case Study,” 02 2020. [Online]. Available: http://dx.doi.org/10.2139/ssrn.3537084
- [48] “World weather online api,” https://www.worldweatheronline.com/, accessed: 2020-04-24.
- [49] A. Husnayain, A. Fuad, and E. C.-Y. Su, “Applications of google search trends for risk communication in infectious disease management: A case study of the covid-19 outbreak in taiwan,” International Journal of Infectious Diseases, vol. 95, pp. 221 – 223, 2020. [Online]. Available: http://www.sciencedirect.com/science/article/pii/S1201971220301405
- [50] I. Goodfellow, Y. Bengio, and A. Courville, Deep Learning. MIT Press, 2016, http://www.deeplearningbook.org.
- [51] G.-B. Huang, L. Chen, C. K. Siew, and Others, “Universal approximation using incremental constructive feedforward networks with random hidden nodes,” IEEE Transaction on Neural Networks, vol. 17, no. 4, pp. 879–892, 2006.
- [52] S. Hochreiter and J. Schmidhuber, “Long short-term memory,” Neural computation, vol. 9, no. 8, pp. 1735–1780, 1997.
- [53] L. Kasun, H. Zhou, G. Huang, and C. Vong, “Representational Learning with Extreme Learning Machine for Big Data,” IEEE Intelligent Systems, vol. 28, no. 6, pp. 31–34, 2013.
- [54] G.-B. Huang, H. Zhou, X. Ding, and R. Zhang, “Extreme learning machine for regression and multiclass classification,” IEEE Transactions on Systems, Man, and Cybernetics. Part B, Cybernetics, vol. 42, no. 2, pp. 513–29, 2012.
- [55] A. A. Mohammed, R. Minhas, Q. J. Wu, and M. A. Sid-Ahmed, “Human face recognition based on multidimensional pca and extreme learning machine,” Pattern Recognition, vol. 44, no. 10-11, pp. 2588–2597, 2011.
- [56] H. Tian and B. Meng, “A new modeling method based on bagging elm for day-ahead electricity price prediction,” in IEEE International Conference on Bio-Inspired Computing: Theories and Applications. IEEE, 2010, pp. 1076–1079.
- [57] N. L. da Costa, L. A. G. Llobodanin, M. D. de Lima, I. A. Castro, and R. Barbosa, “Geographical recognition of syrah wines by combining feature selection with extreme learning machine,” Measurement, vol. 120, pp. 92–99, 2018.
- [58] Z. M. Yaseen, S. O. Sulaiman, R. C. Deo, and K.-W. Chau, “An enhanced extreme learning machine model for river flow forecasting: State-of-the-art, practical applications in water resource engineering area and future research direction,” Journal of Hydrology, vol. 569, pp. 387–408, 2019.
- [59] Y. Ming, S. Cao, R. Zhang, Z. Li, Y. Chen, Y. Song, and H. Qu, “Understanding hidden memories of recurrent neural networks,” in 2017 IEEE Conference on Visual Analytics Science and Technology (VAST). IEEE, 2017, pp. 13–24.
- [60] C. Bergmeir and J. M. Benítez, “On the use of cross-validation for time series predictor evaluation,” Information Sciences, vol. 191, pp. 192–213, 2012.
- [61] C.-J. Huang and P.-H. Kuo, “Multiple-input deep convolutional neural network model for short-term photovoltaic power forecasting,” IEEE Access, vol. 7, pp. 74 822–74 834, 2019.
- [62] S. Siegel, “Nonparametric statistics,” The American Statistician, vol. 11, no. 3, pp. 13–19, 1957.
- [63] Z. Šidák, “Rectangular confidence regions for the means of multivariate normal distributions,” Journal of the American Statistical Association, vol. 62, no. 318, pp. 626–633, 1967.
- [64] “Il sole 24 ore: Coronavirus/ inail: più di 28mila contagi sul lavoro, il 45% infermieri e il 14% medici,” https://www.sanita24.ilsole24ore.com/art/dal-governo/2020-04-30/coronavirus-inail-piu-28mila-contagi-lavoro-45percento-infermieri-e-14percento-medici-093700.php?uuid=ADcmEdN, accessed: 2020-04-30.
- [65] F. Anelli, G. Leoni, R. Monaco, C. Nume, R. C. Rossi, G. Marinoni, G. Spata, D. De Giorgi, L. Peccarisi, A. Miani et al., “Italian doctors call for protecting healthcare workers and boosting community surveillance during covid-19 outbreak,” Bmj, vol. 368, 2020.
- [66] “Credit – contributor roles taxonomy,” https://www.mohw.gov.tw/cp-4510-49339-2.html, accessed: 2020-04-24.
- [67] E. O.-O. Max Roser, Hannah Ritchie and J. Hasell, “Coronavirus pandemic (covid-19),” Our World in Data, 2020, https://ourworldindata.org/coronavirus.
- [68] G. Giordano, F. Blanchini, R. Bruno, P. Colaneri, A. Di Filippo, A. Di Matteo, and M. Colaneri, “Modelling the covid-19 epidemic and implementation of population-wide interventions in italy,” Nature Medicine, pp. 1–6, 2020.
- [69] J. Peto, “Covid-19 mass testing facilities could end the epidemic rapidly,” Bmj, vol. 368, 2020.
- [70] S. Ryu, S. T. Ali, C. Jang, B. Kim, and B. J. Cowling, “Effect of nonpharmaceutical interventions on transmission of severe acute respiratory syndrome coronavirus 2, south korea, 2020,” vol. 26, no. 10, 2020. [Online]. Available: https://wwwnc.cdc.gov/eid/article/26/10/20-1886_article
- [71] G. Hofstede, “Dimensionalizing cultures: The hofstede model in context,” Online readings in psychology and culture, vol. 2, no. 1, p. 8, 2011.
- [72] “Taiwan centers of disease self-health management notice,” https://www.cdc.gov.tw/En/File/Get/qfu8TTGA-5yew7cn6co-zQ, accessed: 2020-04-24.
- [73] C.-M. Chen, H.-W. Jyan, S.-C. Chien, H.-H. Jen, C.-Y. Hsu, P.-C. Lee, C.-F. Lee, Y.-T. Yang, M.-Y. Chen, L.-S. Chen, H.-H. Chen, and C.-C. Chan, “Containing covid-19 among 627,386 persons in contact with the diamond princess cruise ship passengers who disembarked in taiwan: Big data analytics,” J Med Internet Res, vol. 22, no. 5, p. e19540, May 2020. [Online]. Available: http://www.jmir.org/2020/5/e19540/
- [74] C.-Y. Lee, P.-S. Wang, Y.-D. Huang, Y.-C. Lin, Y.-N. Hsu, and S.-C. Chen, “Evacuation of quarantine-qualified nationals from wuhan for covid-19 outbreak – taiwan experience,” Journal of Microbiology, Immunology and Infection, vol. 53, no. 3, pp. 392 – 393, 2020. [Online]. Available: http://www.sciencedirect.com/science/article/pii/S1684118220300839
- [75] “Tourism statistics database of the taiwan tourism bureau,” https://stat.taiwan.net.tw/, accessed: 2020-04-24.
- [76] “Italy: Country-specific: Arrivals of non-resident tourists at national borders, by nationality 2014 - 2018 (10.2019),” Tourism Statistics, p. null, 2020. [Online]. Available: https://www.e-unwto.org/doi/abs/10.5555/unwtotfb0380011120142018201910
- [77] “Italy: Country-specific: Outbound tourism 1995 - 2018 (01.2020),” Tourism Statistics, p. null, 2020. [Online]. Available: https://www.e-unwto.org/doi/abs/10.5555/unwtotfb0380250119952018202001
- [78] “Gazzetta ufficiale della repubblica italiana,” https://www.gazzettaufficiale.it, 2020, [Online; accessed 04-May-2020].
- [79] “Taiwan cdc press release 29 jan,” https://www.cdc.gov.tw/Category/ListContent/EmXemht4IT-IRAPrAnyG9A?uaid=Juifka7OmJvB2GnY_m59iw, 2020, [Online; accessed 13-May-2020].
- [80] “Taiwan cdc guidance for large scale gatherings,” https://www.cdc.gov.tw/En/File/Get/kn-UhuMzznq9d0y7U18oog, 2020, [Online; accessed 13-May-2020].
7 Supplementary Material: Introduction
This is the supplementary material supporting the paper, Optimisation of non-pharmaceutical measures in COVID-19 via nerual networks. We give further details on the data gathering in both description and methods of quantification, which are summarised in the Tables and Figure provided below.
Sec. 8 summarises the measures taken by Italy and Taiwan in restricting entry and quarantining incoming travellers. We describe in detail the method used to quantify these restrictions as outlined in the Tables V, VI and VII. Other variables that required more details and an outline of actions are described in Sec. 9. These include enforcement (Taiwan only), testing criteria, government mitigation and population awareness as recapped in Tables VIII (Taiwan enforcement), IX & X (testing criteria), XI & XII (government mitigation), and XIII (population awareness).
8 Supplementary Material: Border Control
8.1 Level descriptions
The different levels of action applied to travellers entering the country were equated to a numeric scale. This ranges from 0 to 5 for national citizens and 0 to 7 for non-nationals as depicted in Table V, where 0 represents zero constraints and 7 entry banned.
Level 1 involves quarantine inspections that targets symptomatic travellers on direct flights from an infected area. Level 2, whilst still targeting symptomatic passengers, opens to those with a travel history to an infected area within 14 days. Level 3 requires health declaration forms from an infected area by all travellers, therefore expanding the target to asymptomatic travellers [44].
Level 4 indicates a 14-day self-health management; in Tawian the TCDC describes this as: hand and respiratory health, record temperature and activities twice daily, avoid public places (wearing a face mask if necessary), and contact local health bureaus if fever or respiratory symptoms develop (inform physician of any history of travel, occupation, contact, and cluster) [72].
Level 5 requires individuals to a 14-day home quarantine; again for Taiwan the TCDC required travellers to follow several measures [44]; mask on arrival, private transportation from airport/point of entry, hand and respiratory health, stay at home, keep one meter away from those sharing the same household and avoid contact with them. Quarantine/isolation hotels can be availed of if one’s home/destination does not qualify for home quarantine. Groceries or necessary products are to be obtained via help of household or family members, alternatively one can contact the care and support center for quarantined/isolated individuals. Non-urgent medical care should be postponed and if symptoms develop, individuals are not to seek medical attention by themselves but contact health authorities to arrange their medical care.
Level 6 has a restriction on entry visas for specified foreign nationals while level 7 involves a ban on entry for non-residents.
| Levels | Description of person applicable | Action |
| 0 | Everyone | None |
| 1 | Symptomatic from infected area | Quarantine Officer |
| 2 | Symptomatic from infected area ( days) | Quarantine Officer |
| 3 | Asymptomatic from infected area ( days) | Health Card Declaration |
| 4 | 14 days self-health management | |
| 5 | 14 days quarantine | |
| 6 | Reduced entry (visa restrictions) | |
| 7 | Entry prohibited |
8.2 Italy
On January 31st, the Italian Presidency of the Council of Ministers, the Ministry of Health issued the suspension of direct flights between Italy and China. After this decision, other measures of increasing severity have been taken to control the cross-border traffic. Data regarding these legal acts was collected from the archive of regulations issued by the Ministry of Health [40]. Dates and detail are listed below in Table VI along with the suitable quarantine levels as described in Table V.
| Date | Description | Travel From | Level |
| 20/01/2020 | Temperature measured for travellers coming from China. | China | 2 |
| 31/01/2020 | Direct flights from China ceased. |
China (Italian)
China (Chinese) |
5
7 |
| 05/02/2020 | Temperature measured for all incoming travellers. | Anywhere | 2 |
| 21/02/2020 | Quarantine for travellers (symptomatic or not) coming from anywhere after having stayed in China in the last 14 days. | Anywhere | N/A |
| 17/03/2020 | Quarantine for travelers (symptomatic or not) coming from anywhere | Anywhere | 5 |
8.3 Taiwan
Taiwan initiated on-board quarantine inspections on the same day China reported cases of pneumonia of an unknown etiology in the city of Wuhan to the World Health Organisation (WHO), December 2019. From there they adapted to the global spread of the virus, with different requirements rolled out for different regions of the world as outlined in Table VII. As the epidemic in China worsened, Taiwan increased entry requirements for different provinces of China. Initially they focused on symptomatic travellers from Wuhan, escalating to an entry ban for Wuhan residents on January, with severe restrictions on all Chinese citizens following on January. Early February saw an entry ban for Chinese citizens and foreign nationals with a travel history in China, Macau or Hong Kong, with home quarantine for Taiwan, Macau and Hong Kong residents. By end of February, as the virus spread globally, Taiwan initiated a variation of self-health management and home quarantine for travellers from Thailand, Italy, Iran, Singapore, Japan and South Korea. In March, as the situation in Europe worsened, Taiwan further enhanced its measures by mandatory quarantine for incoming travellers from Schengen, U.K., Ireland, and Dubai. This was quickly followed by several Asian countries, Moldova, U.S., New Zealand, Australia and Canada. On March, Taiwan announced banned entry for all foreign national travellers without documents of granted entry.
In addition to these actions, in rare cases where it was acknowledged that mandatory quarantine orders had been issued later than ideal, retrospective health monitoring was put in place for recently arrived travellers from specified regions. Other scenarios that required spacial attention to which the Central Epidemic Command Center (CECC) reacted include: the docking of the Princess Diamond where the use of smart technology assisted in identifying and following up with 627,386 individuals [73]; special requirements in dealing with Taiwan residents on other cruise ships; evacuating Taiwan residents from Wuhan [74]; and an outbreak on a three-ship fleet, Dunmu (敦睦) Fleet.
This is summarized in Table VII, along with the allocated level as described in Table V. Some information was not included in the analysis, yet still included in Table VII for completeness.
| Date | Description | Travel From | Level |
| 31/12/2019 | Onboard quarantine inspection of direct flights. | Wuhan | 1 |
| 06/01/2020 | Quarantine inspection of passengers. Passengers report if symptomatic within 10 days of return. | Wuhan & nearby | 1 |
| 09/01/2020 | Report if symptomatic within 14 days of return. | Wuhan & nearby | 2 |
| 23/01/2020 | Entry denied for residents of Wuhan. | Wuhan (res) | 7 |
| 24/01/2020 |
Stay home (wear mask if one must leave).
Avoid crowded places and public transport (mask if must ) Novel Coronavirus Health Declaration Card |
Wuhan (non-res)
China China,Macau,HK |
5
4 3 |
| 25/01/2020 | Report if symptomatic within 14 days of arrival | Everywhere | 2 |
| 26/01/2020 | Extensive visa restrictions on Chinese nationals | China (res) | 6 |
| 01/02/2020 | Those returning from China to avoid hospitals and healthcare facilities for 14 days. Healthcare professionals to halt work for 14 days with self-health management | China | N/A |
| 02/02/2020 |
Entry denied for residents of Guangdong
14 day home quarantine: entry via cross-strait airports w/ Guangdong travel history (14 days) 14 days of self-health management |
Guangdong (res)
Guangdong (res) China, Macau,HK |
7
N/A 4 |
| 03/02/2020 |
Entry denied for residents of Wenzhou
Home quarantine: travel history to Wenzhou Extraction of Taiwanese nationals from Wuhan by chartered plane: 14 day group quarantine |
Wenzhou (res)
Wenzhou (non-res) Wuhan (Taiwanese) |
7
5 N/A |
| 04/02/2020 | Home quarantine: travel history to Zhejiang | Zhejiang | 5 |
| 05/02/2020 |
Cruise ships docked in China, Macau, HK within 14 days banned from docking
Cruise ships with suspected cases within 28 days banned from docking |
China, Macau, HK
Everywhere |
N/A
N/A |
| 06/02/2020 |
14 day home quarantine for Taiwan nationals,
14 day self-health management for Taiwan nationals permitted entry Chinese nationals forbidden entry |
China, Macau, HK (Taiwanese)
Macau, HK (Taiwanese) China (res) |
5
N/A 7 |
| 07/02/2020 |
14 day quarantine for Macau and HK nationals
Entry forbidden for foreign nationals with travel history within 14 days to China, Macau, HK |
Macau, HK (res)
China, Macau, HK (foreigners) |
5
7 |
| 08/02/2020 | Taiwanese passengers on infected cruise ships allowed to return after 2 negative tests, followed by 14 day self-health management on return | Everywhere (Taiwanese) | N/A |
| 10/02/2020 | 14 day quarantine: passengers transiting thro’ | China, Macau, HK | N/A |
| 11/02/2020 | Health declaration form | Everywhere | 3 |
| 13/02/2020 | Foreign nationals prohibited transiting or entry | Cruise ships | N/A |
| 14/02/2020? | Passenger Health Declaration and Home Quarantine Information System (Entry Quarantine System) | Everywhere | N/A |
| 15/02/2020 | 14 day home quarantine: avoid public transport from airport (wear mask if must) | Endemic (China) | N/A |
| 22/02/2020 | Taiwanese passengers on infected cruise ships allowed to return after 2 negative tests, followed by 14 day group quarantine on return | Everywhere (Taiwanese) (Princess Diamond) | N/A |
| 24/02/2020 | 14 day self-health management | Thailand, Italy, Iran, Singapore, Japan | 4 |
| 25/02/2020 |
14 day home quarantine from South Korea (SK)
14 day self-health management from SK |
SK (foreign)
SK (Taiwanese) |
5
4 |
| 27/02/2020 | 14 day home quarantine from SK | SK (Taiwanese) | 5 |
| 28/02/2020 | 14 day home quarantine | Italy | 5 |
| 02/03/2020 |
14 day home quarantine (not including transits)
14 day home isolation |
Iran
Infected flight |
5
N/A |
| 07/03/2020 | 14 day self-health management | France, Germany, Spain | 4 |
| 11/03/2020 | 14 day self-health management | Schengen, Bahrain, Kuwait | 4 |
| 14/03/2020 |
14 day home quarantine
14 day self-health management |
Schengen, UK, Ireland, Dubai
Everywhere |
5
4 |
| 17/03/2020 | 14 day home quarantine | Asia19, Moldova, California, Washington, New York | 5 |
| 18/03/2020 | 14 day home quarantine | New Zealand, Australia, Canada, U.S. | 5 |
| 19/03/2020 |
14 day home quarantine
Entry banned without entry permit |
Everywhere
Foreign nationals |
5
6 |
| 24/03/2020 | Suspension of transit of airline passengers through Taiwan | Everywhere | N/A |
| 01/04/2020 |
Home quarantined travellers prohibited from traveling to offshore islands by plane or boat.
Residents of offshore islands urged to undergo home quarantine and related measures on the main island |
Everywhere | N/A |
| 03/04/2020 | Travellers symptomatic within 14 days to be tested and use designated transport vehicles to a designated location for home quarantine. | Everywhere | N/A |
| 18/04/2020 |
Inbound travelers who have visited Europe and the Americas within 14 days should voluntarily present documents for home quarantine requirements before boarding.
Such travelers should stay at quarantine hotels if they live with increased-risk individuals |
Everywhere | N/A |
| Date | Description | Travel From | Level |
| 19/04/2020 | Hospital isolation for positive cases, group quarantine for all others. | Members of navy from infected ships | N/A |
| 21/04/2020 |
Inbound travelers who have visited Southeast Asia within 14 days should complete the COVID-19 Health Declaration and Home Quarantine Notice and confirm if their residence satisfies home quarantine requirements before boarding.
Such travelers should stay at quarantine hotels if they live with increased-risk individuals. |
Everywhere | N/A |
8.4 Quantifying border control
To quantify these actions for both Taiwan and Italy, each territory is allocated a quality of control between 0 and 1 each day, thus creating a time series for both regions as illustrated in Figure. 6. To compute this level of control on a given day for either territory, the following procedure was followed using available data from John Hopkins University [33].
The daily cases of every country reported globally have been collected and smoothed by a rolling 3-day average (previous, current, day after). The percentage of daily cases associated with each country is then computed, with respect to the global daily cases, and excluding daily cases in Taiwan and Italy respectively (as it is their protection from incoming cases being gauged). For Taiwan, areas associated with China that were treated differently, i.e., different regulations on different dates, include Hubei, Guangdong, Zhejiang, China (rest), Hong Kong and Macau. When actions were directed by cities, provincial data was used. In addition, some states of the United States (U.S.) were treated differently, namely Washington, New York and California. As actions differed only by a day, the date of regulations affecting these states have been taken to represent all of the U.S.
As different levels of quarantine are implemented for residents and non-residents (see Table VII and VI for Taiwan and Italy respectively). Statistics from the Taiwan Tourism Bureau [75] for 2019 have been used to encapsulate the ratio of travellers that are residents and visitors as outbound and inbound respectively. For China, the national statistics were used for each province. Similar information was obtained from the World Tourism Organisation for Italy visitors [76] and returning residents [77] in 2018. This data has been used to obtain a weighted-level time series by dot product of the ratios (residents, non-residents) and the levels associated for that day for each country. For example, with travellers from South Korea to Taiwan
where is the level on day n from South Korea (on day 37 or February we have from Table VII) and is the ratio of travellers (outbound, inbound) with from [75].
The time series quantifying the border control for say Taiwan entry from each country is calculated by multiplying the percentage of daily cases for a given country on a given day by the weighted-level calculated for that country on that day. Again, for the above example of South Korea on day 37,
where is the smoothed daily global percentage of cases associated with South Korea on day (with Taiwan cases removed) obtained using John Hopkins data [33]. By summing all the time series for each country, the daily total quarantine incoming measure for Taiwan (or Italy) on each day is retrieved. This summing of reactions is illustrated by a stacked bar graph in Figures 6(a) and 6(b) for Italy and Taiwan respectively.


9 Supplementary Material: Further government actions and population response
9.1 Taiwan enforcement
To encourage compliance with quarantine and isolation orders in Taiwan, fines were introduced early of NT$150,000 and NT$300,000 respectively (USD$5,000 and USD$10,000) and raised to NT$1 million (USD$33,000) on March and mandatory group quarantine at a designated centre. Health Declaration Cards were required by travellers from high-risk areas from January with smart technologies announced on ; this evolved into the Entry Quarantine System announced on February - an online system where travellers could obtain a mobile health declaration pass on their phones. This hastened the immigration process, allowed the Taiwan healthcare system immediate access to travel history of ‘perspective’ future patients and further enabled mobile tracking of quarantined individuals. Inaccurate information earned travellers a NT$150,000 fine (USD$5,000). By April, the LINE Bot system was announced to track quarantined individuals, however the newer system also allowed voluntary health reporting and updated information on prevention measures. These were reported to the public [42] (ongoing) and previously noted in [43] (until February 2020). Table VIII lists and quantifies these consequences as a step function.
| Date | Regulation Description | Level |
| 28/01/2020 | Smart technology utilised to provide assistance in prevention. | 1 |
| 11/02/2020 | Inaccurate information from travellers (refusal, evasion, interference) results in a fine up to NT150,000. | 2 |
| 12/02/2020 | Violators of home isolation fined up to NT300,000. Violators of home quarantine fined up to NT150,000. | 3 |
| 27/03/2020 | Fines increased up to NT1 million for violation of quarantine or isolation measures and put into group quarantine. | 4 |
| 03/04/2020 | LINE Bot system: Disease Containment Expert introduced to track people in home quarantine | 5 |
| 05/04/2020 | Fine up to NT15,000 for not wearing mask on public transport. | 6 |
9.2 Testing criteria
The progression of testing in who qualified for tests for both Italy and Taiwan are summarised in Tables IX and X respectively below.
| Date | Description | Level |
| 22/01/2020 | Testing symptomatic travellers coming from China | 1 |
| 27/01/2020 | Testing symptomatic individuals that had contact with a confirmed patient in the last 14 days | 2 |
| 22/02/2020 | Testing individuals showing symptoms of either influenza-like-illness (ILI) or Severe Acute Respiratory Infection (SARI), and that has been in contact with a suspect case, or with history of travel in China | 3 |
| 09/03/2020 | Testing anyone showing ILI or SARI symptoms and that requires hospitalization | 4 |
| Date | Description | Level |
| 06/01/2020 | Healthcare facilities to reinforce case reporting of severe cases of pneumonia among travellers from Wuhan. | 1 |
| 24/01/2020 | Travellers from Wuhan with fever or acute respiratory tract infection | 2 |
| 12/02/2020 | Mandatory testing for severe complicated influenza cases, cases of community-acquired upper respiratory infections under surveillance and clusters of upper respiratory infections who were reported on and after January 31 and whose specimens tested negative | 3 |
| 16/02/2020 |
Community surveillance expanded to include
1) Any individuals with foreign travel history in the past 14 days or any individuals who have had contact with symptomatic foreign travelers with a fever or respiratory symptoms and highly suspected of having the said COVID-19 symptoms caused in the past 14 days. 2) Clusters of cases of fever/respiratory symptoms. 3) Pneumonia cases whose symptoms haven’t improved after three days of antibiotic therapy for unknown cause or clusters of pneumonia cases or healthcare workers having pneumonia. |
4 |
| 18/03/2020 | Retrospective testing for symptomatic people entering from Europe, Egypt, Turkey, Dubai | 5 |
| 21/03/2020 | Retrospective testing for symptomatic people entering from US, East Asia | 6 |
| 07/04/2020 | Mandatory testing for inbound travellers with fever or symptoms in the past 14 days | 7 |
9.3 Government mitigation
Actions taken by both governments to implement social distancing and health promotion are listed and quantified for both Italy and Taiwan in Tables XI and XII respectively.
| Date | Description | Level |
| 23/02/2020 | Creation of red zones in Northern Italy | 1 |
| 25/02/2020 | Additional limitations in the red zones: suspension of sport events, meetings, school trips | 2 |
| 1/03/2020 | Closure of schools, suspension of events of all kinds in the red zones | 3 |
| 4/03/2020 | Closure of schools and universities in the whole country | 4 |
| 8/03/2020 | ”Stay home” Decree Law | 5 |
| 11/03/2020 | Closure of restaurants, bars and retail stores | 6 |
| 20/03/2020 | Closure of parks, ban on outdoor sport activities | 7 |
| 22/03/2020 | Closure of non-essential manufacturing businesses | 8 |
| Date | Mitigation Description | Level |
| 06/01/2020 | Healthcare facilities: Workers strictly adhere to standard precautions for preventing nosocomial infection, wearing N95 respirators while performing invasive medical procedures. Heightened vigilance for suspected cases, and thoroughly implement the inquiry of patients for history of travel, occupation, contact, and cluster (TOCC). | 1 |
| 20/01/2020 | School holidays begin (later extended 2 weeks). | 2 |
| 24/01/2020 | Heightened hygiene practices: Healthy public to take temperature, wash hands thoroughly with soap, avoid touching eyes, nose and mouth with hands and avoid crowded public places. If symptomatic, rest at home and stay clear of crowded public places (wear surgical mask if must). | 3 |
| 25/01/2020 | 14 days of self-health management (since contact): Those with possible contact with a known positive case, if symptomatic, report to hotline. | 4 |
| 29/01/2020 | The CECC issued relevant guidance for public transportation, public gatherings, educational institutions and groups and provided advice on prevention measures to reduce the risk of infection. [79] | 5 |
| 12/02/2020 | CECC reiterates close contacts are required to abide by home isolation or quarantine as instructed by the government. | 6 |
| 19/02/2020 | Public to regularly wash their hands with soap, ensure proper ventilation in their homes, and regularly clean their homes’ interior and exterior. Upcoming school reopenings: CECC reminds schools and public kindergartens to institute appropriate cleaning and disinfection procedures for their classrooms and school buses. Public transportation operators to step up disinfection measures. | 7 |
| 23/02/2020 | Local environmental protection departments tasked with disinfecting public spaces surrounding schools and public kindergartens and spaces within them which were open to the general public during the winter vacation, such as large hallways, wash basins, restrooms, and playgrounds. (by 23/02). | 8 |
| 25/02/2020 | Schools reopen (conditional: more than one case in a school results in a 2 week closure). | 7 |
| 05/03/2020 | CECC issued Guidelines for Large-Scale Public Gatherings in the Wake of the COVID-19 Outbreak (see attachment) to give guidance for organizing public gatherings [80]. | 8 |
| 18/03/2020 | Retrospective health monitoring on individuals entering Taiwan from Europe, Egypt, Turkey and Dubai. | 9 |
| 21/03/2020 | Retrospective health monitoring symptomatic for people entering from US, East Asia. | 10 |
| 25/03/2020 | Indoor events with 100+ people and outdoor gatherings 500+ people to be suspended. Organizers of these gatherings can conduct risk assessments | 11 |
| 01/04/2020 | Phase 1 social distancing implemented: outdoor 1m+, indoor 1.5m+ separation, wear masks otherwise. | 12 |
| 05/04/2020 | Public transport riders urged to wear masks at all times and undergo temperature checks before entering bus or MRT station (NT15,000 fine) | 13 |
| 06/04/2020 | 14 self-health management for those who attended temple festival, if unwell, call hotline | 14 |
| 09/04/2020 | Host and hostess clubs and ballrooms suspend operations. | 15 |
| 10/04/2020 | Crowd control measures imposed at public places where large crowds can gather | 16 |
| 14/04/2020 | Home quarantine/isolation for incoming from Europe and Americas with quarantine hotels for those who live with increased risk individuals. | 17 |
9.4 Population awareness
The list of keywords used for quantifying public awareness via Google Trends are listed in Table XIII
| Italy | Taiwan |
| italia coronavirus, notizie coronavirus, news coronavirus, il coronavirus, coronavirus, covid 19, covid italia, coronavirus covid 19, autocertificazione covid, covid, la quarantena, quarantena coronavirus, quarantena italia, quarantena fine, quarantena, wuhan coronavirus, cina, wuhan cina, virus wuhan, wuhan, virus corona, virus italia, corona virus italia, cina virus, virus | coronavirus taiwan, taiwan, coronavirus update, coronavirus cases, coronavirus, covid 19, covid taiwan, covid-19, covid 19 taiwan, covid,quarantine 中文, quarantine 意思, self quarantine,隔離 英文 quarantine, quarantine, wuhan virus, wuhan coronavirus, wuhan pneumonia, wuhan, virus corona,corona, taiwan virus, virus |