One dimensional cell motility patterns
Abstract
During migration cells exhibit a rich variety of seemingly random migration patterns, which makes unraveling the underlying mechanisms that control cell migration a daunting challenge. For efficient migration cells require a mechanism for polarization, so that traction forces are produced in the direction of motion, while adhesion is released to allow forward migration. To simplify the study of this process cells have been studied when placed along one-dimensional tracks, where single cells exhibit both smooth and stick-slip migration modes. The stick-slip motility mode is characterized by protrusive motion at the cell front, coupled with slow cell elongation, which is followed by rapid retractions of the cell back. In this study, we explore a minimal physical model that couples the force applied on the adhesion bonds to the length variations of the cell and the traction forces applied by the polarized actin retrograde flow. We show that the rich spectrum of cell migration patterns emerges from this model as different deterministic dynamical phases. This result suggests a source for the large cell-to-cell variability (CCV) in cell migration patterns observed in single cells over time and within cell populations. The large heterogeneity can arise from small fluctuations in the cellular components that are greatly amplified due to moving the cells’ internal state across the dynamical phase transition lines. Temporal noise is shown to drive random changes in the cellular polarization direction, which is enhanced during the stick-slip migration mode. These results offer a new framework to explain experimental observations of migrating cells, resulting from noisy switching between underlying deterministic migration modes.
I Introduction
Eukaryote cell migration, whereby cells crawl actively over an external substrate, is a subject of great interest for biological processes such as development and cancer progression. Adhesion-based cell motility involves the orchestration of a large number of cytoskeletal proteins: Typically, the cell needs to break its symmetry (polarize), and produce traction forces in the direction of polarization (balanced by drag or friction forces). The traction forces are mediated by adhesion between the cell and the external substrate, but these adhesions have to detach at the trailing end of the cell in order to allow the cell to migrate forward. When observing freely migrating cells (i.e. not guided by an external gradient of any kind), one is often struck by the large variation in their migration patterns [1, 2, 3, 4, 5], both for a single cell over time, and for a (seemingly identical) cell population. The origin of the large Cell-to-cell variability (CCV), or phenotypic, population heterogeneity, observed during cell migration is not understood [6], and is usually ascribed to the inherent noise of cellular systems [7, 8].
To simplify the study of the complex process of cell motility, cells can be confined to move along one-dimensional tracks, either on flat adhesive stripes [9, 10], linear grooves [11] and channels [12, 13], or thin fiber [14, 15]. In addition to being a simple geometry for the study and analysis of the cell motion in general, such confined motion appears also in-vivo [16], for example when cells move along axonal fibers [17, 18], or cancer invades in confined spaces between tissues [19].
The experiments listed above have shown that isolated cells on one-dimensional tracks exhibit the following stereotypical behaviors [9, 10]: (i) Non-migrating and unpolarized, by remaining quiescent or elongating symmetrically, (ii) Undergoing spontaneous symmetry breaking, polarization and migrating smoothly, (iii) As in (ii) but exhibiting stick-slip migration. The stick-slip motility mode is characterized by protrusive motion at the cell front, coupled with an overall elongation of the cell and followed by rapid retraction of the cell back. In both (ii,iii) the cell motility can be highly persistent, or undergo sporadic direction changes. The appearance of this variety of migration behaviors within a uniform cell population, as well as the switching of cells between these modes, remains an open puzzle and is the aim of this work. Clearly the diversity of the migration patterns is beyond modeling the cell motility as a simple random walk process [20, 4, 21, 22].
We present a theoretical model that describes the cell motility in a highly simplified, and coarse-grained manner. Nevertheless, the model contains two key, and strongly coupled, components: a slip-bond adhesion module at the cell back, and a cellular polarization module. We find that these components are sufficient to drive the entire spectrum of observed motility patterns, and explain the transitions between them. Our work therefore demonstrates how a minimal model gives rise to a rich variety of deterministic migration patterns. In experiments these deterministic patterns may underlie the migration of cells, but further confounded by noise.
The stick-slip motion is shown here to have an underlying deterministic oscillatory behavior, separated from smooth migration by a bifurcation line. Unlike previous treatments of stick-slip dynamics of cells, which focused on the protrusion-retraction cycles at the cell edge [23, 24], we couple the stick-slip adhesion at the cell back to the overall cell polarization, through the dependence of the polarization on the cell length. This dependence, which is an inherent property of the UCSP model [25], was not previously explored. Deterministic oscillations in the speed of migrating dendritic cells, for example, were related to competition for finite resources that directly affected the acto-myosin polarization mechanism, but did not involve length oscillations [26]. Furthermore, the dendritic-cell oscillations depend on a specific macropinocytosis process, while here we obtain deterministic oscillatory (stick-slip) migration patterns that are driven by adhesion dynamics that are much more general across cell types.
II Model
The model is introduced by three parts, with increasing levels of complexity and realism. In this manner we expose the motility patterns and the key components that drive them.
The first part describes a cell that is constantly polarized, with a constant protrusive activity at the leading edge, and slip bond adhesions at the rear [24]. This part allows us to expose the oscillatory stick slip behavior through the dynamics of the cell length and adhesion concentration at the rear.
The second part adds a self-polarization model to the polarized cell [25]. This part couples the dynamics in cell length to the protrusive activity, and introduced a critical polarization length scale. However the model simplifies the cell to have a single leading edge, where all the protrusive activity is concentrated.
In the third part the model is extended to be symmetric, such that the protrusion and adhesion dynamics acts on both edges of the cell. This part outlines the conditions for symmetry breaking and the role of noise in choosing a migration direction.
Part 1: Polarized cell with a constant protrusion
Model description
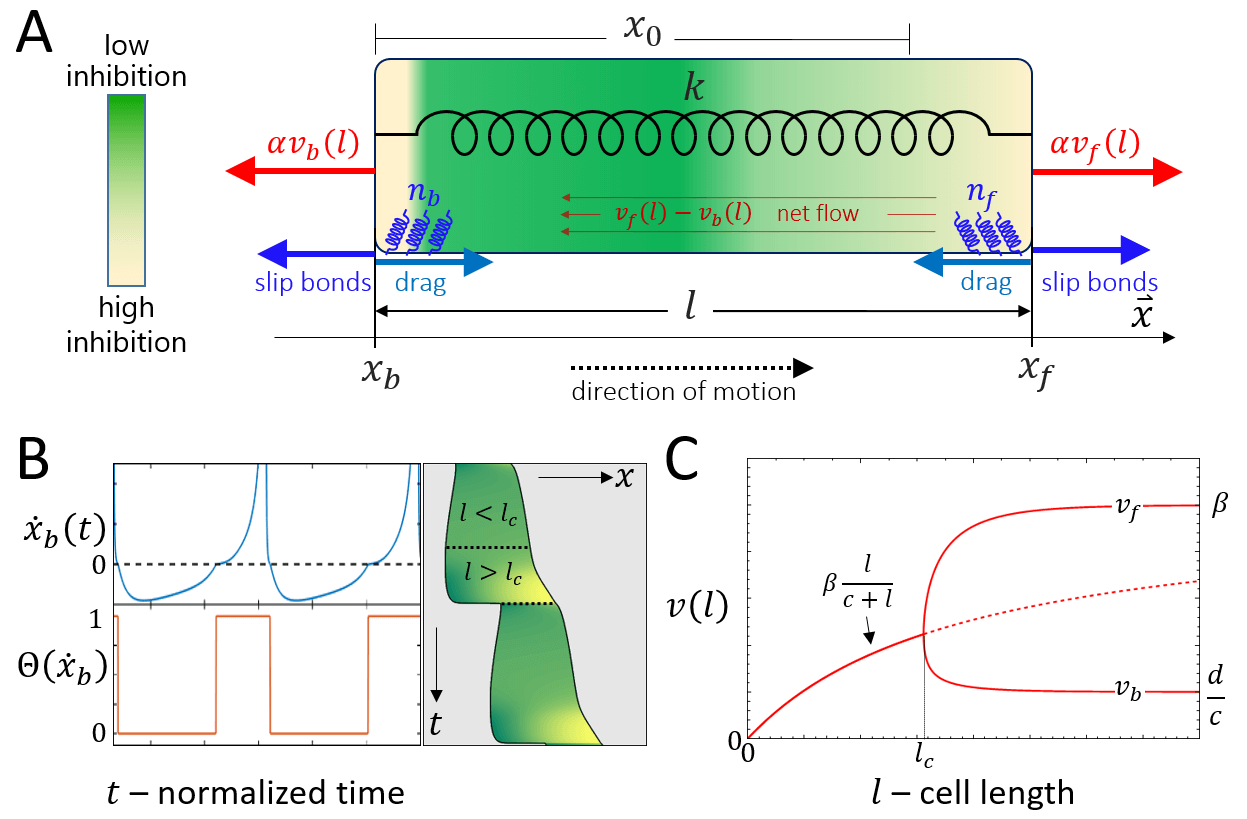
Consider a cell of length that migrates along a linear track. The two ends of the cell, the front and back, denoted by and , are connected by a spring (Fig. 1A). The stiffness of the spring , represents the effective elasticity of the cell cytoplasm and membrane. Such a mechanical coupling between the front and rear was recently demonstrated experimentally [27].
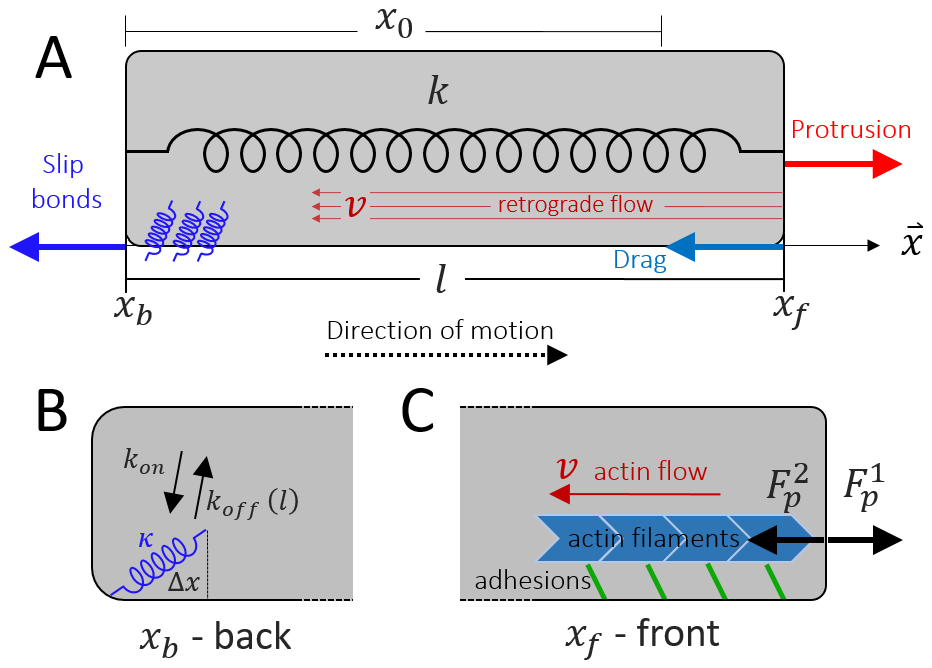
In this part of the model, the motion of the cell is considered to be already polarized, such that the actin treadmilling from the front to the back occurs at a constant velocity , and produces a constant protrusive force at the front
| (1) |
where describes the strength of the coupling of the actin retrograde flow and the effective friction force generated by adhesions which grip the sliding filaments. This is a simplified representation of the ”clutch” mechanism [23], that converts the sliding of the actin to a protrusive force that pushes on the membrane. This coupling is dependent on the adhesion strength, and we therefore expect a term of the form: to multiply the r.h.s. of Eq.1, where is the ratio between the binding/unbinding rates of the cell-substrate adhesion molecules , and quantifies the the cell-substrate adhesion saturation. Such a term accounts for the loss of traction force when the adhesion diminishes . We do not explicitly describe here the catch-bond property of these adhesions, as we are not interested in the stick-slip dynamics of the leading edge, but rather wish to focus on the stick-slip events on the whole cell scale. For the rest of this paper we effectively work in the limit of (the effects of are shown in Fig.23).
The pushing force is balanced by a drag force which is proportional to the speed of the moving front, and a restoring force due to the global cell elasticity
| (2) |
where represents the effective resistance to the motion of the cell front due to the friction generated by the contact of adhesion molecules with the substrate. As in Eq.(1), we expect a term of the form to multiply the first term on the r.h.s. of Eq.2, but we neglect it by choosing to work in the limit of . The parameter represents the stiffness of the spring which describes the effective elasticity of the cell, and the parameter represents the rest length of the cell.
Equating (1) and (2) due to the force balance at yields
| (3) |
which allow to obtain the equation of motion for the moving cell front
| (4) |
At the back, , the pulling force due to the cell elasticity
| (5) |
is balanced by a friction force which results from the stretching of bound linkers, which model slip bond adhesions
| (6) |
where is the mean number of bound linkers, is the spring constant of the linkers, and is the average displacement of the linkers (Fig.1C). The number of bound linkers evolves dynamically and obeys the following kinetics
| (7) |
where is the total number of linkers, is the basal attachment rate, and is a detachment rate which depends exponentially on the force applied on each bound linker [24, 23]
| (8) |
where is the basal detachment rate and represents the susceptibility of the linkers to the applied force [24]. The stretching force per bound linker is
| (9) |
The average stretch of each linker depends on the dissociation rate of the linkers (8,7) and can be written as
| (10) |
By combining (8,9,10) into the force balance between (5) and (6) we obtain
| (11) |
where is the effective spring constant of the linkers, and we substituted for the average stretching of each linker: . By reorganizing (11) we obtain the equation of motion of the moving back
| (12) |
Combining (4) and (12), and changing coordinates to yields the following dynamical system
| (13) | ||||
| (14) |
Next, the system (13,14) is rescaled by the time and length scales of ,, and by the total number of adhesion sites , as well as rescaled by the parameters , , , and to obtain
| (15) | ||||
| (16) |
Finally, we set and and remove the tilde signs in Eqs.(15,16), to obtain
| (17) | ||||
| (18) |
Note that the dynamics is now captured by two ODEs, where the spatial component appears only as the total cell length variable. These reduced equations have four structural parameters () and the parameter describing the strength of the actin treadmilling flow ().
Results
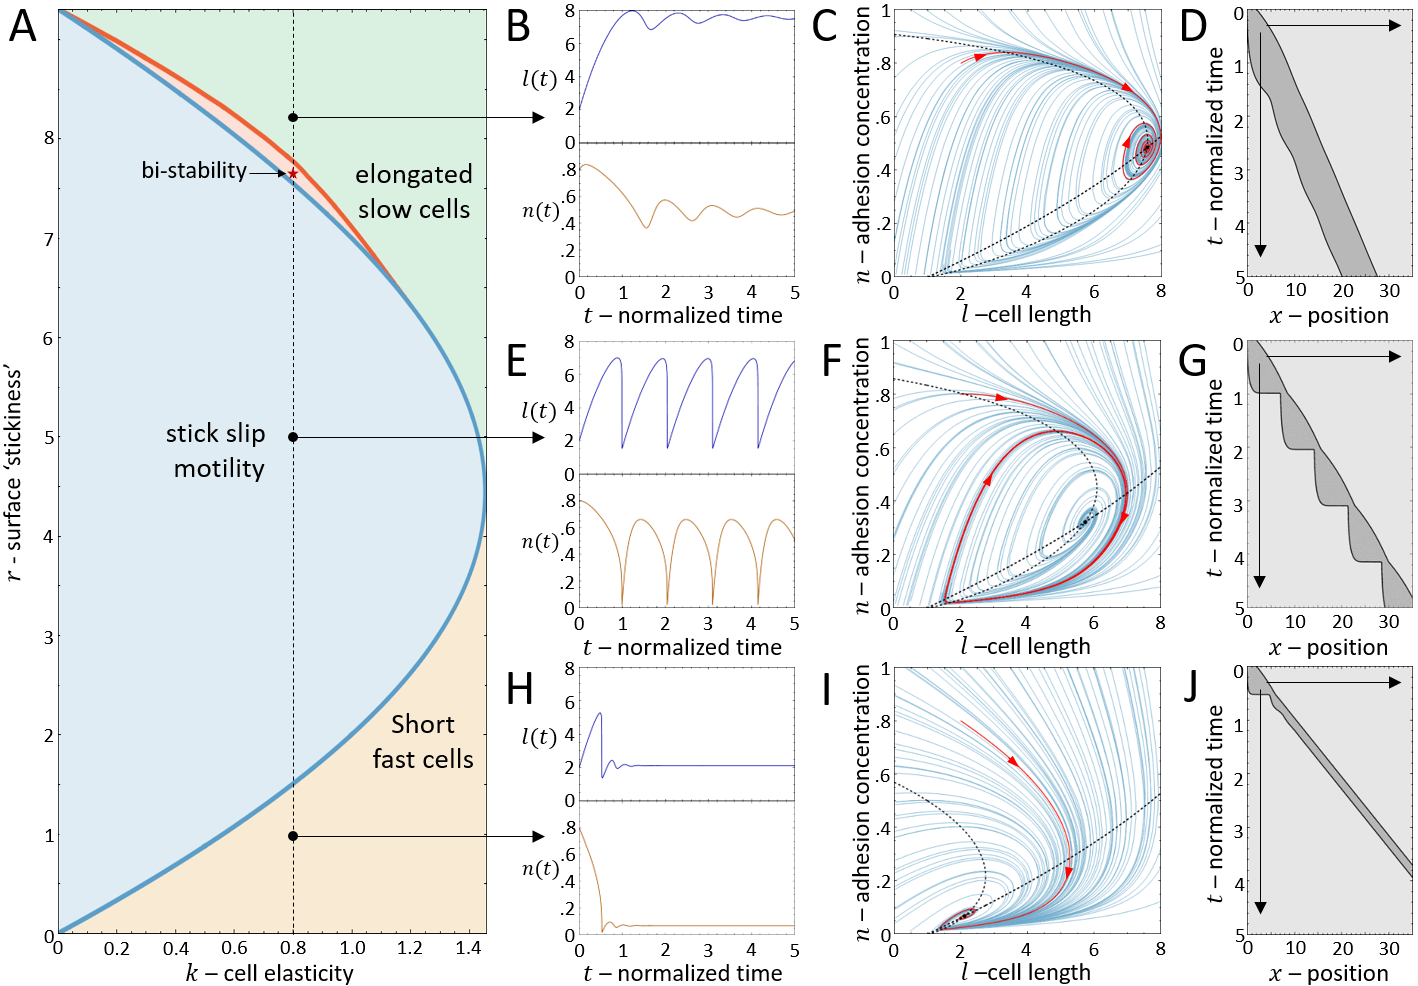
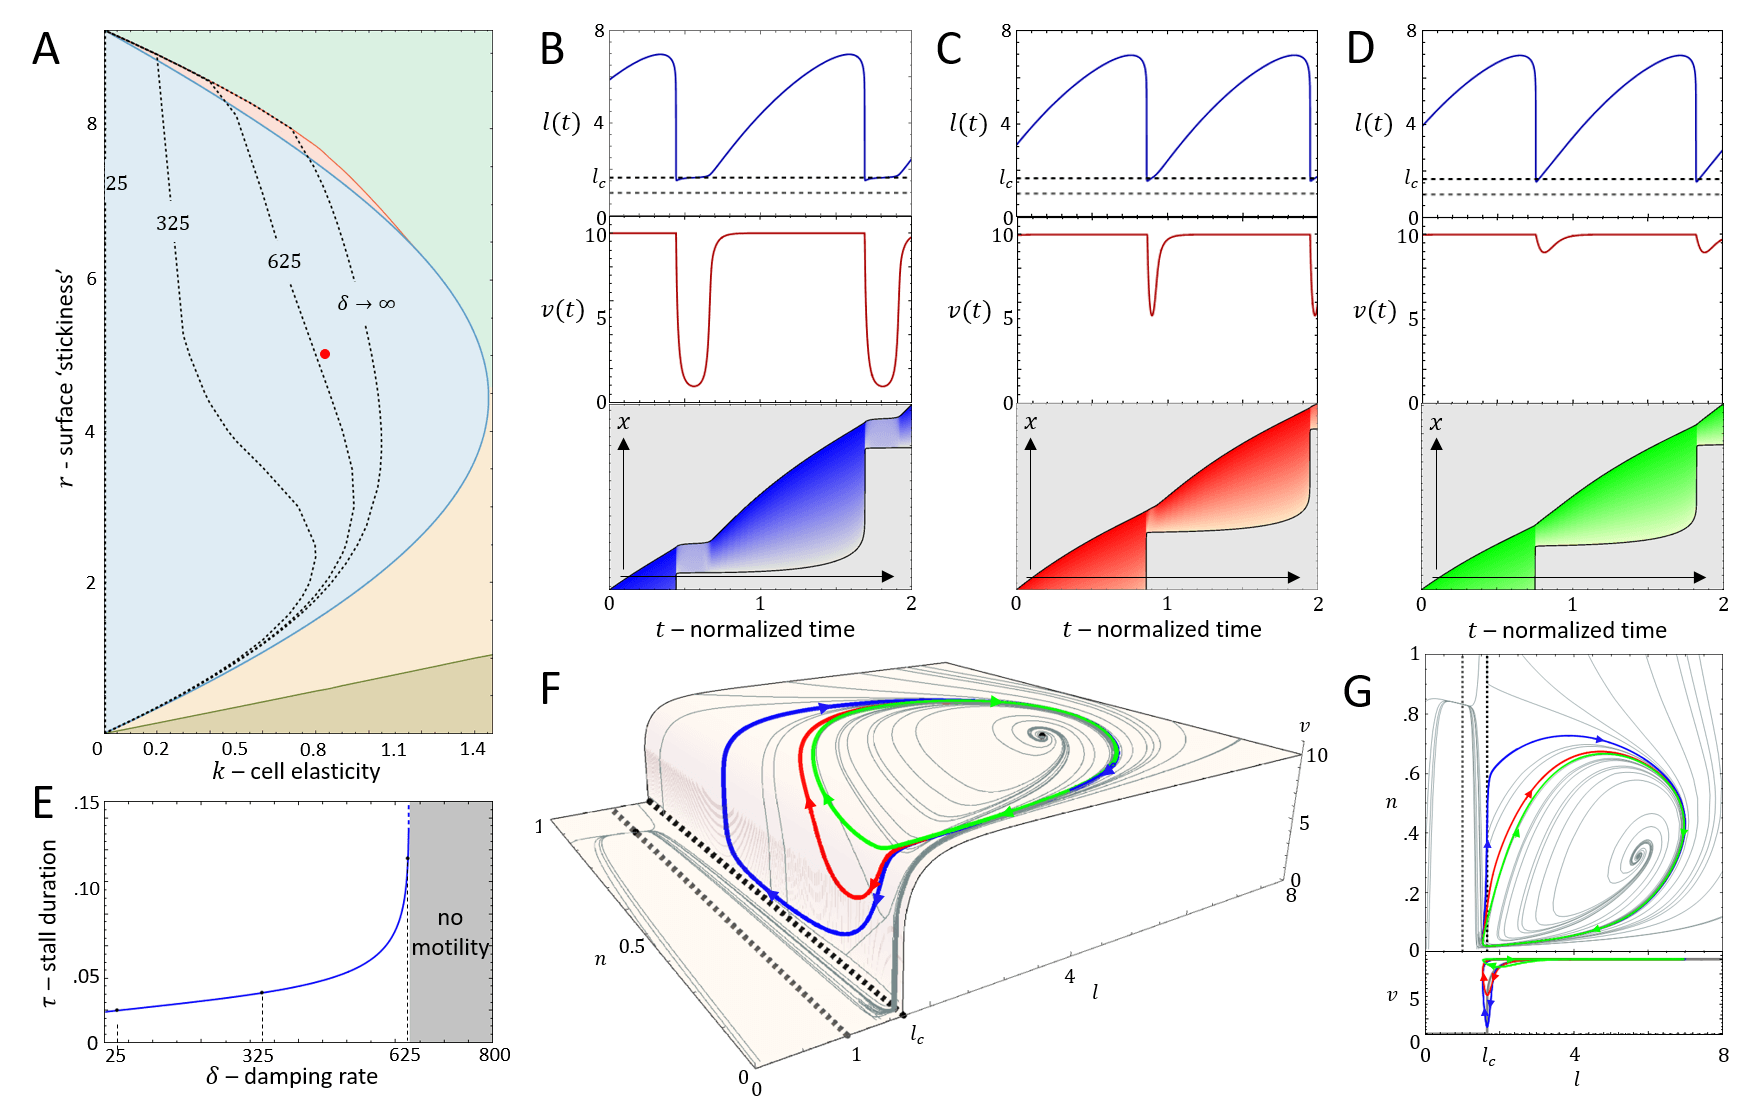
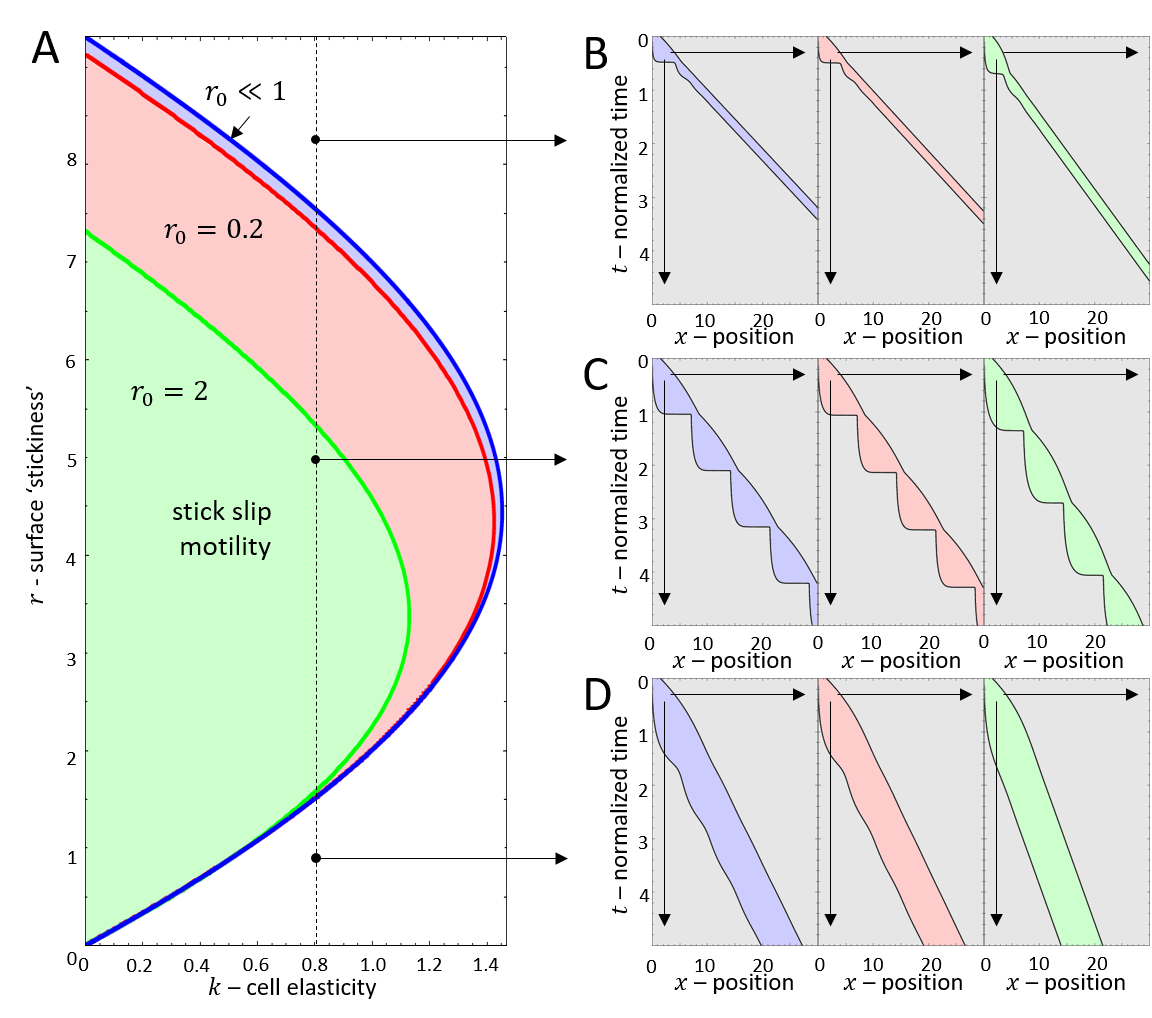
It is convenient to plot the resulting dynamics on the phase diagram shown in Fig.2A. We find that above a critical value of the cell stiffness (to the right of the blue solid line), the spring is too stiff to allow for large length changes that enables the spring to store and release large forces. In this regime we get a single, stable fixed point that corresponds to smooth cell motion, and no stick-slip behavior (for the phase-diagram as function of the adhesion saturation parameter see Appendix A).
Below the critical stiffness, we find that for small values of the system corresponds to smooth motion (stable fixed point), of a short and fast-moving cell (Fig.2H-J).
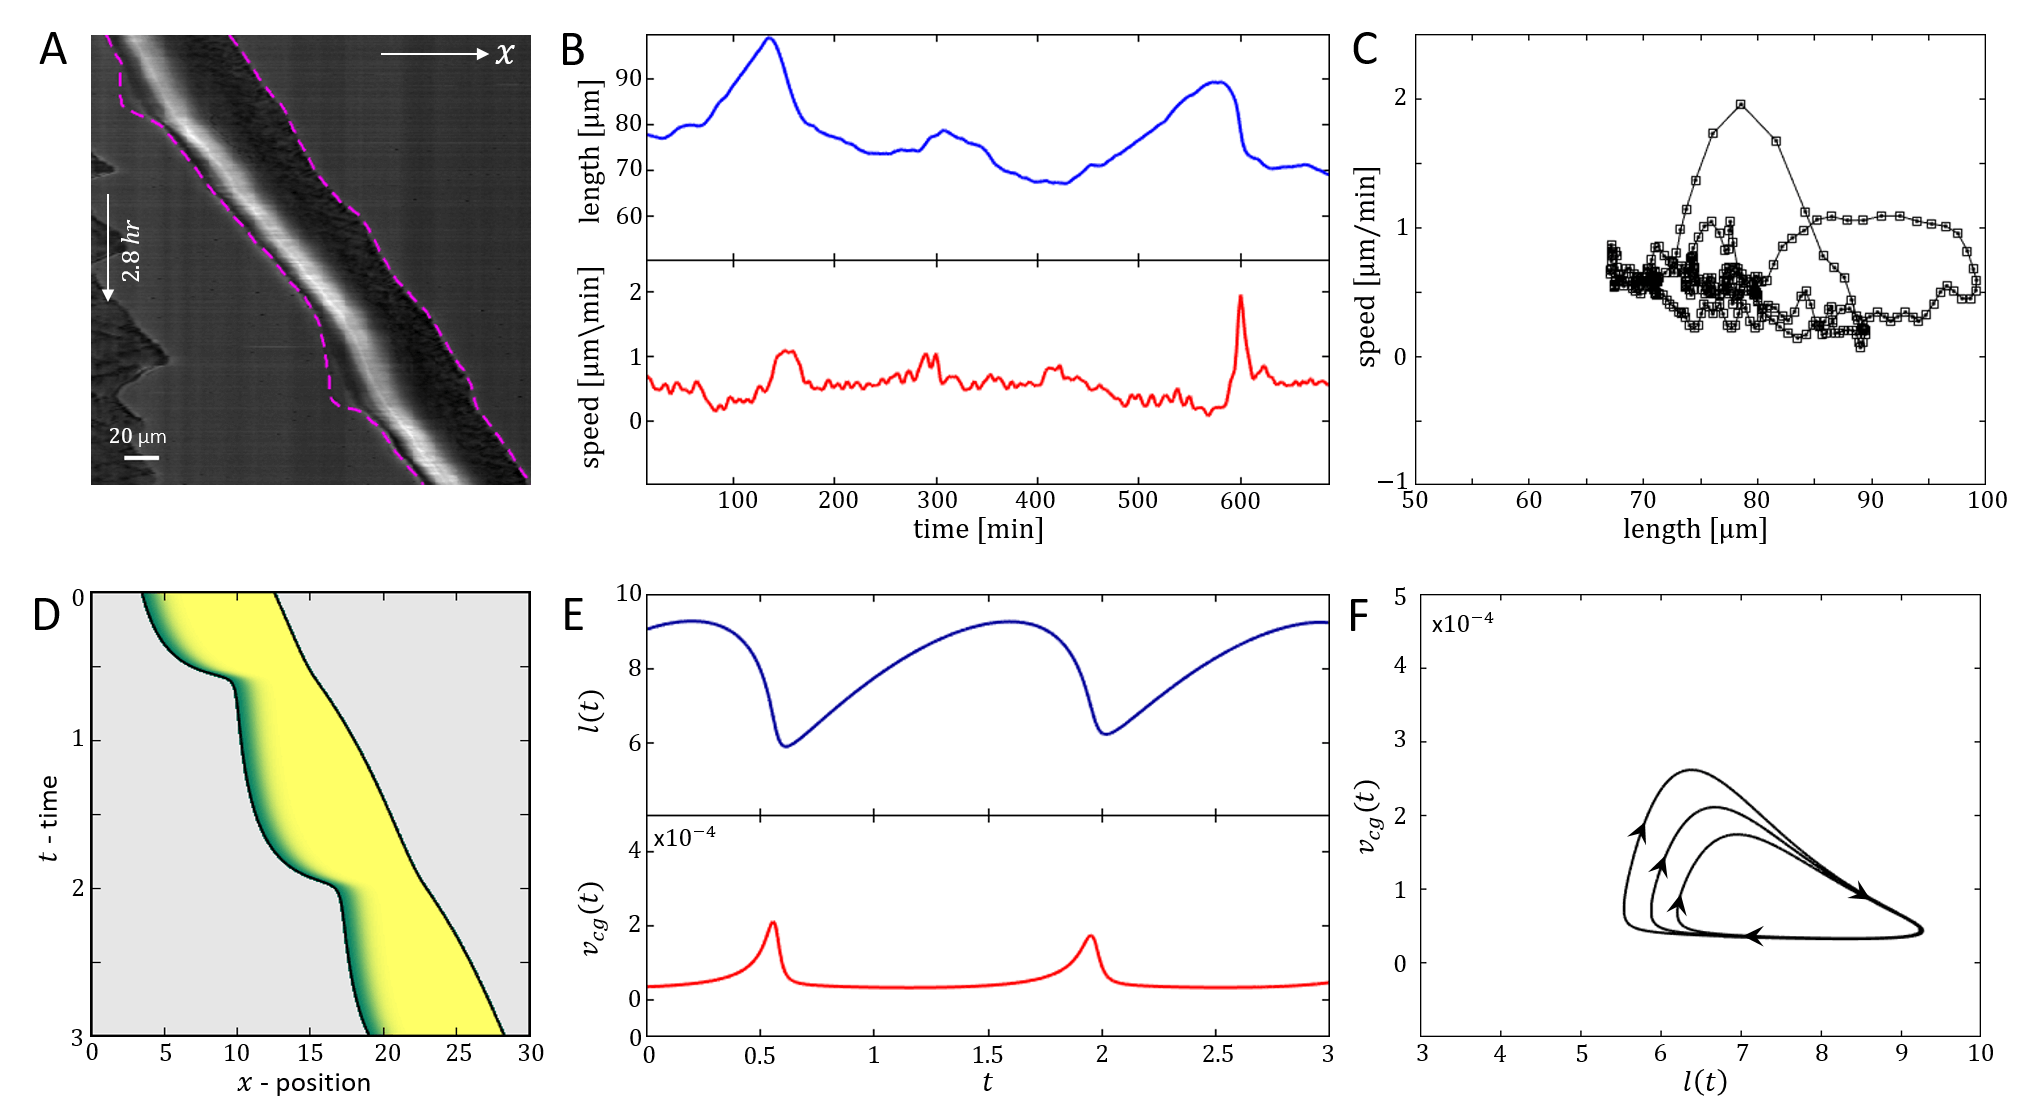
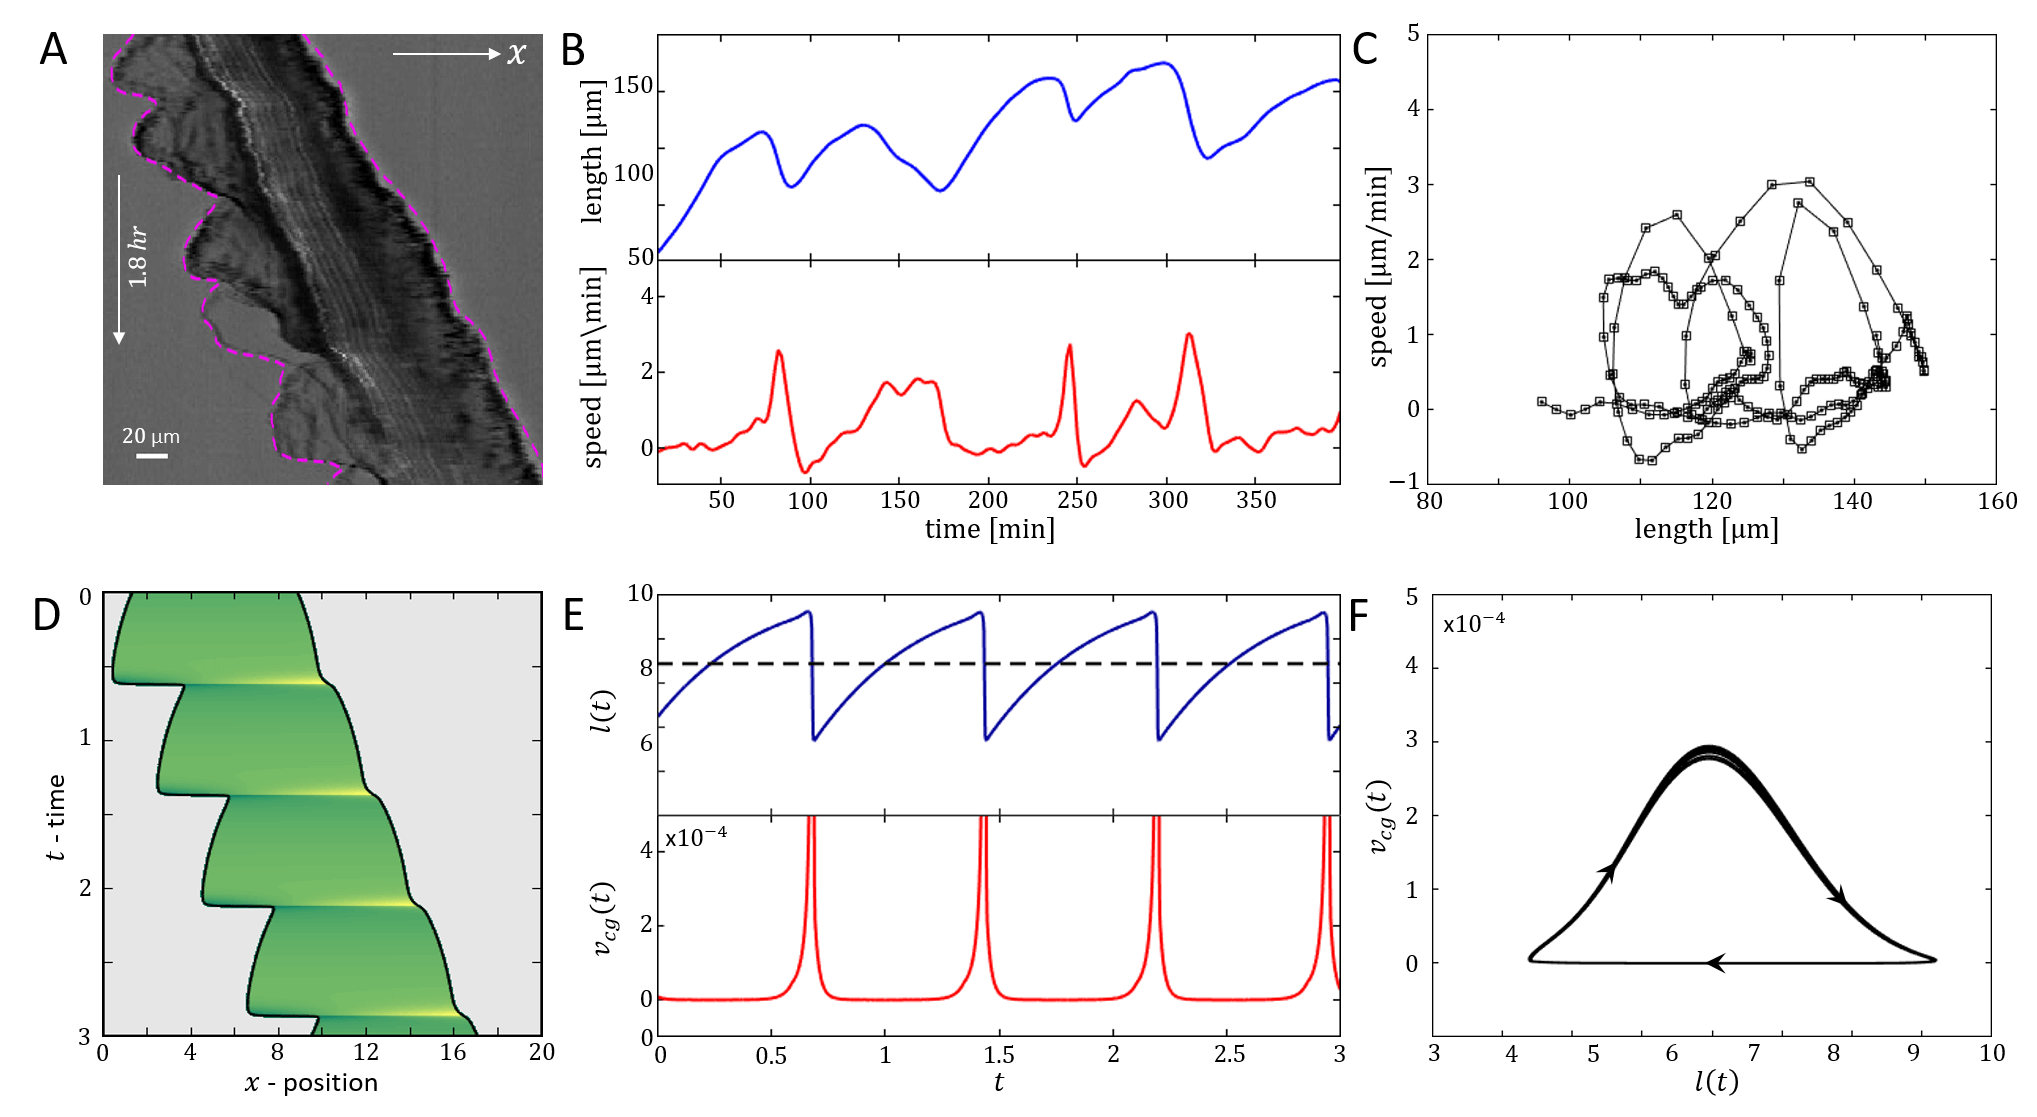
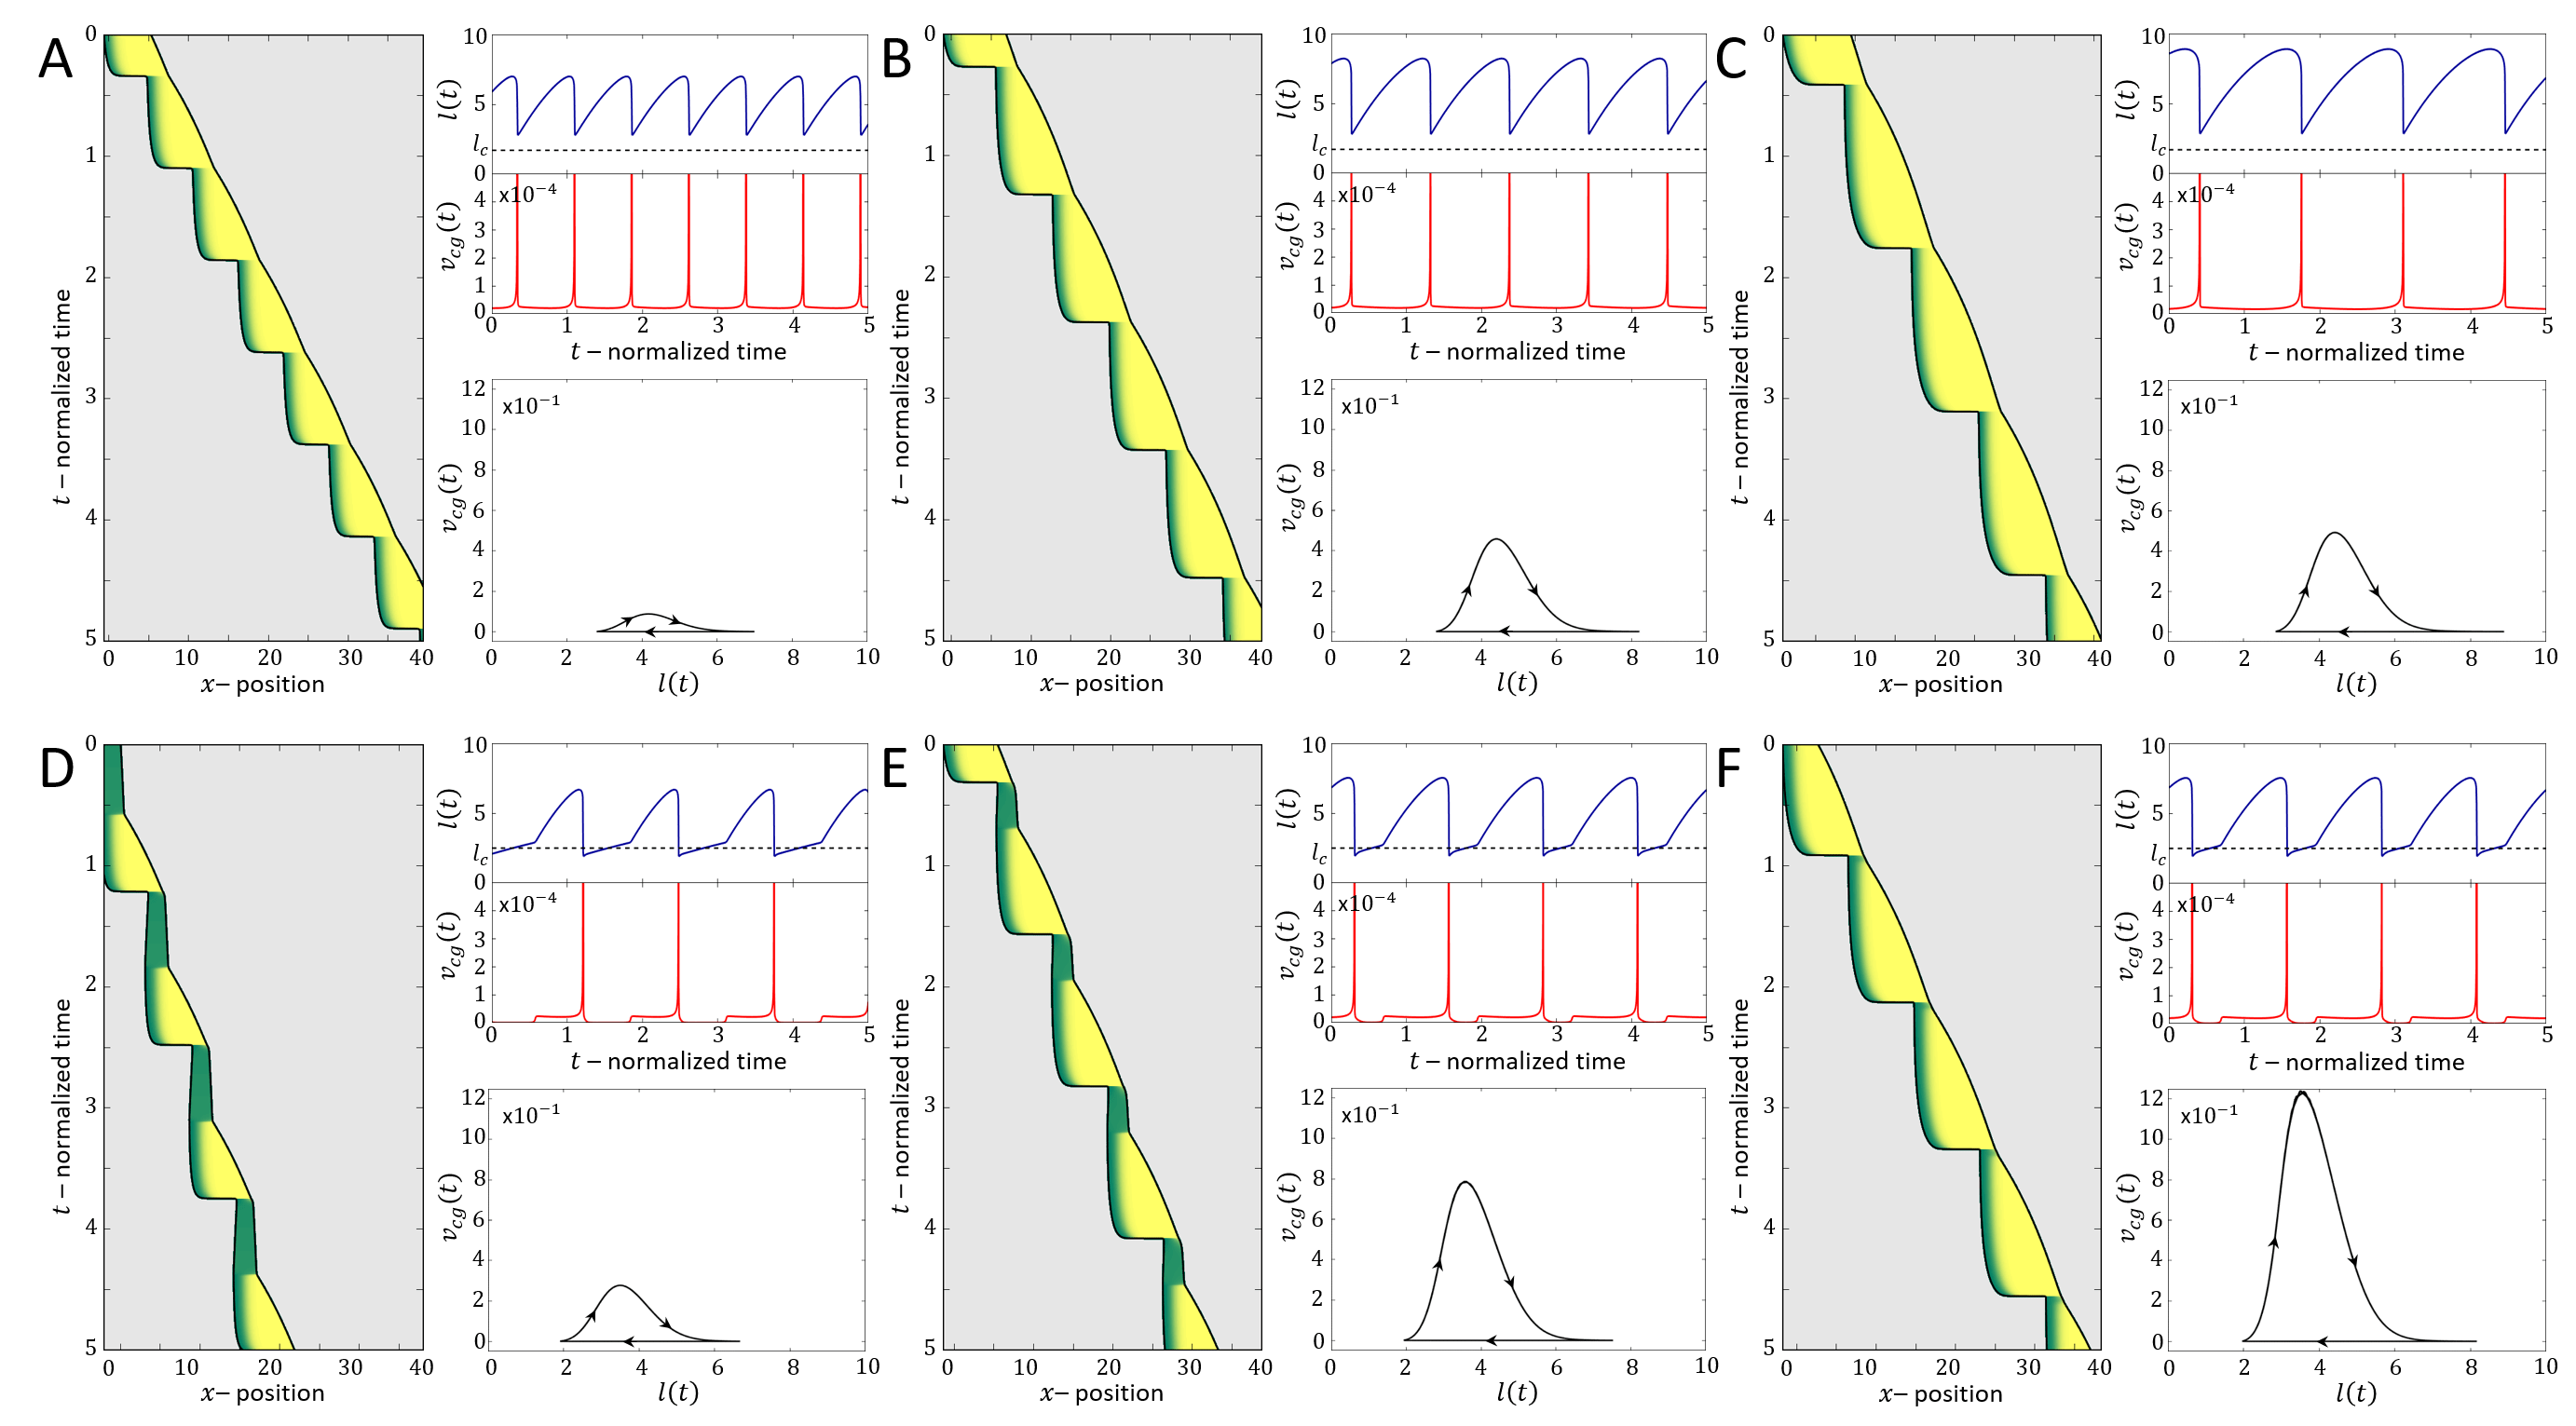
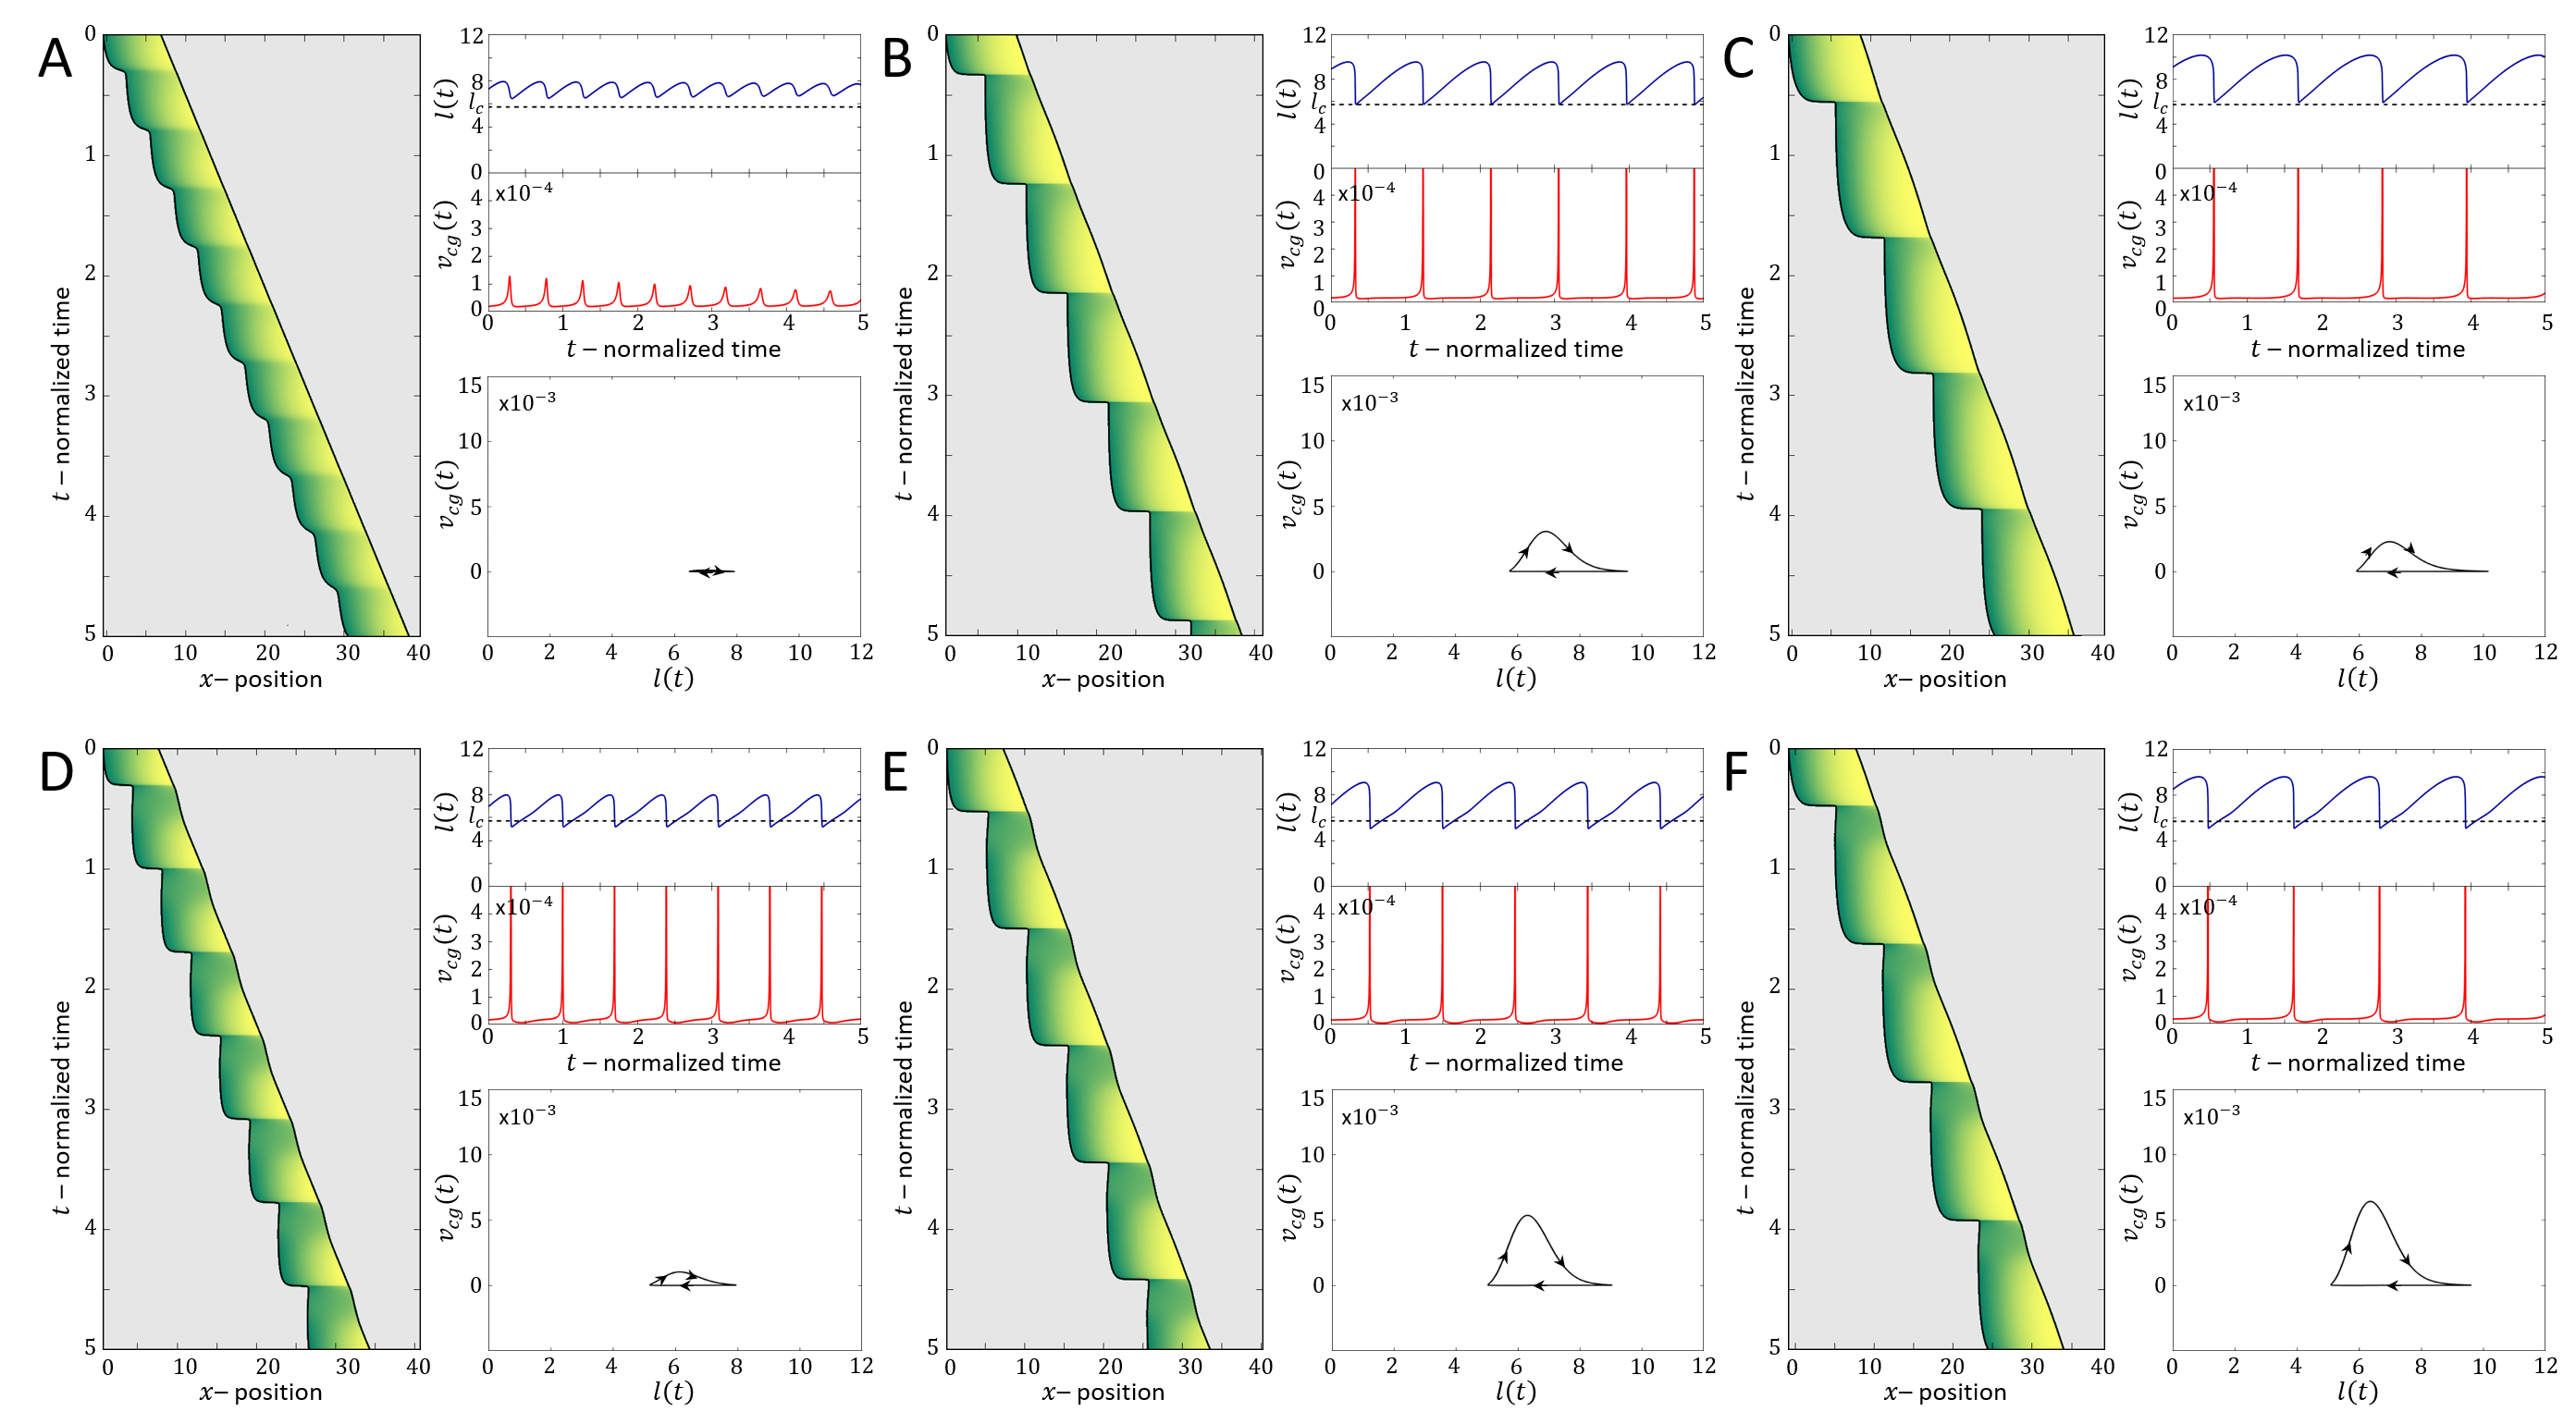
Above a transition line (solid blue line in Fig.2A), the fixed point undergoes a Hopf bifurcation, which marks the transition from smooth motion to stick-slip motion (limit cycle dynamics)(Fig.2E-G). In this regime there are large length oscillations, as well as large oscillations in the number of bound adhesion linkers at the cell back (Fig.3A,B). These oscillations in occur due to the large values of the force per linker that is reached (Fig.3C), which leads to catastrophic, avalanche-like detachment events at the back. Within the stick-slip regime, we find that the duration of the limit-cycle increases with increasing , i.e. the dynamics slow down with increasing substrate adhesiveness (Fig.3D).
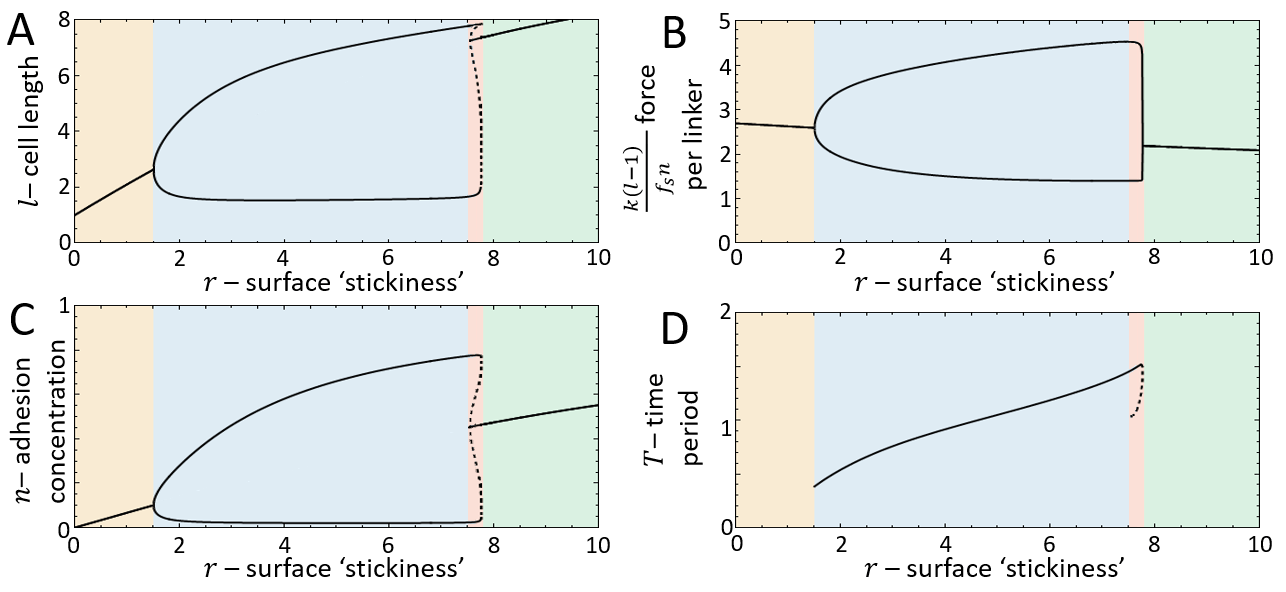
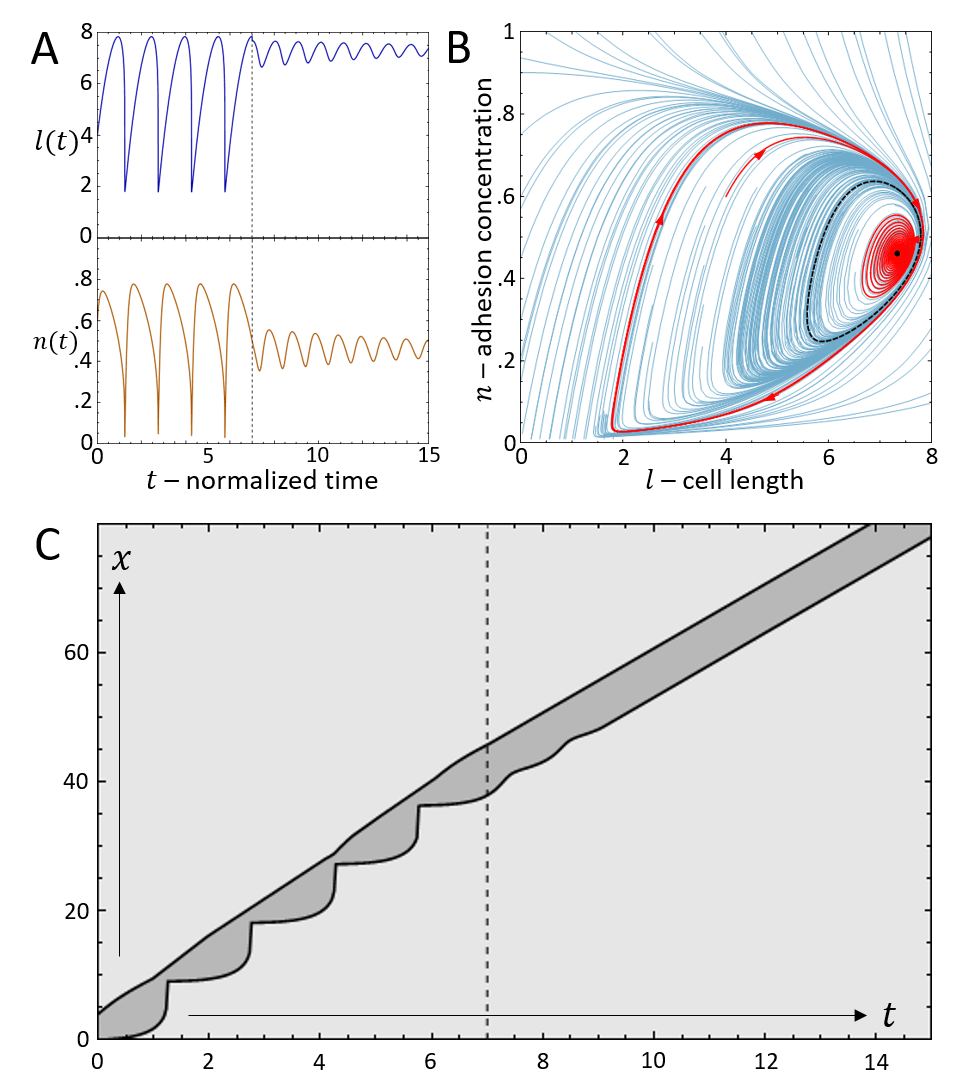
As increases there is a second Hopf bifurcation, whereby the fixed point is stable again. However, there is a narrow region of bistability, where the phase-space is separated by a separatrix (solid black line in Fig.3B), such that the stable fixed point coexists with the limit cycle. Within this regime, noise can induce transitions from stick-slip (limit cycle) to smooth motion (stable fixed point), as demonstrated in Fig.4.
For increasing the separatrix grows until it meets the limit cycle, which marks the transition to flows that all lead to the single stable fixed point. The dynamics in this regime correspond to a smooth motion of a slow-moving and elongated cell (Fig.2B-D,Fig.3).
Comparison to Experiments
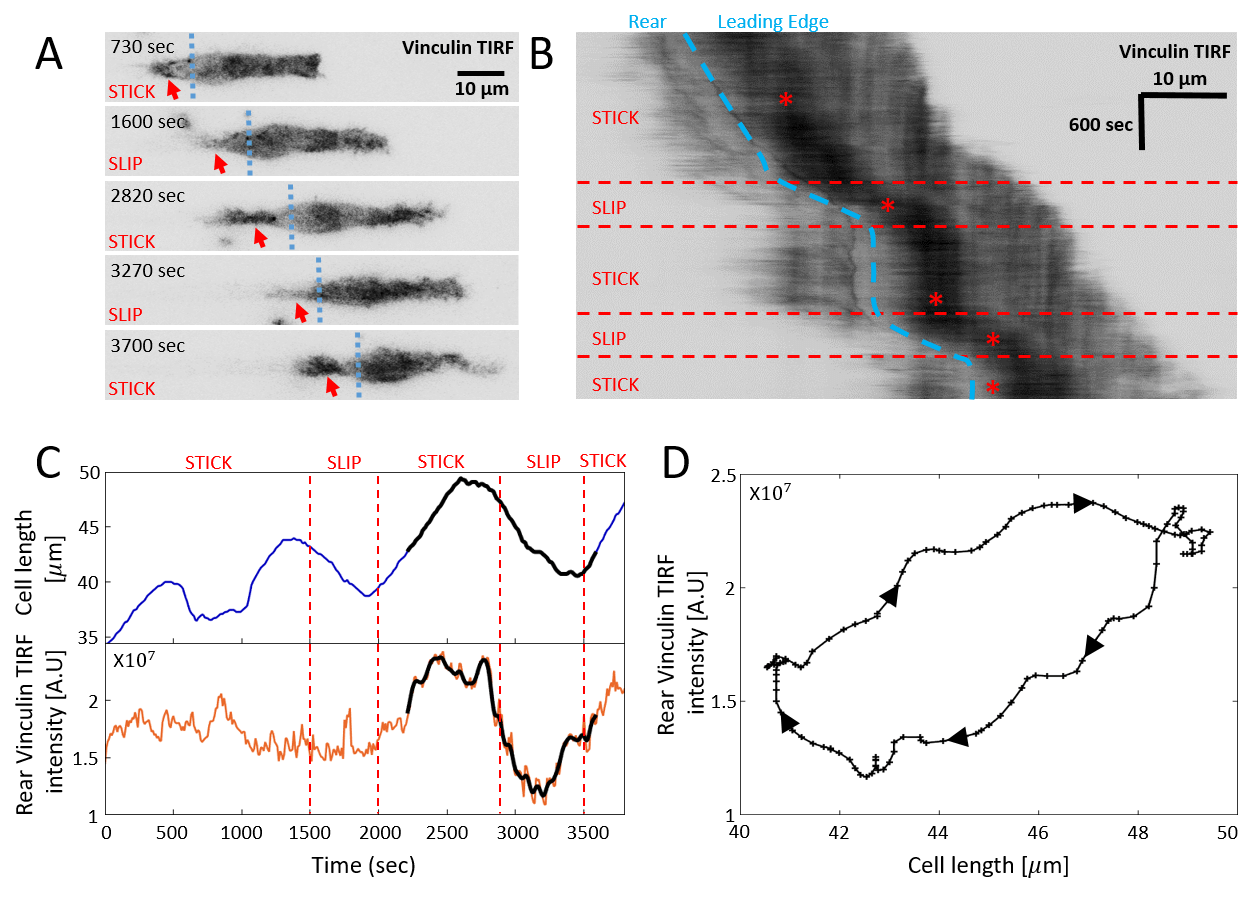
We now compare in detail the model’s stick-slip limit-cycle dynamics (Fig.2E-G) to experiments (see Appendix D for experimental methods). In Fig.5 we analyze the stick-slip migration mode of a C6 glioma cell (seeded on laminin-coated lines of 5m width), by following the cell length and the intensity of membrane-bound vinculin, using total internal reflection fluorescence (TIRF) microscopy. As a component of the adhesion complex, we denote the total intensity of vinculin in the rear of the nucleus as a measure of the adhesion strength at the cell back in the model (). We find that the experimentally observed dynamics during a stick-slip cycle give rise to a limit-cycle in -phase space that has the same qualitative features as the model predicts (Fig.2F).
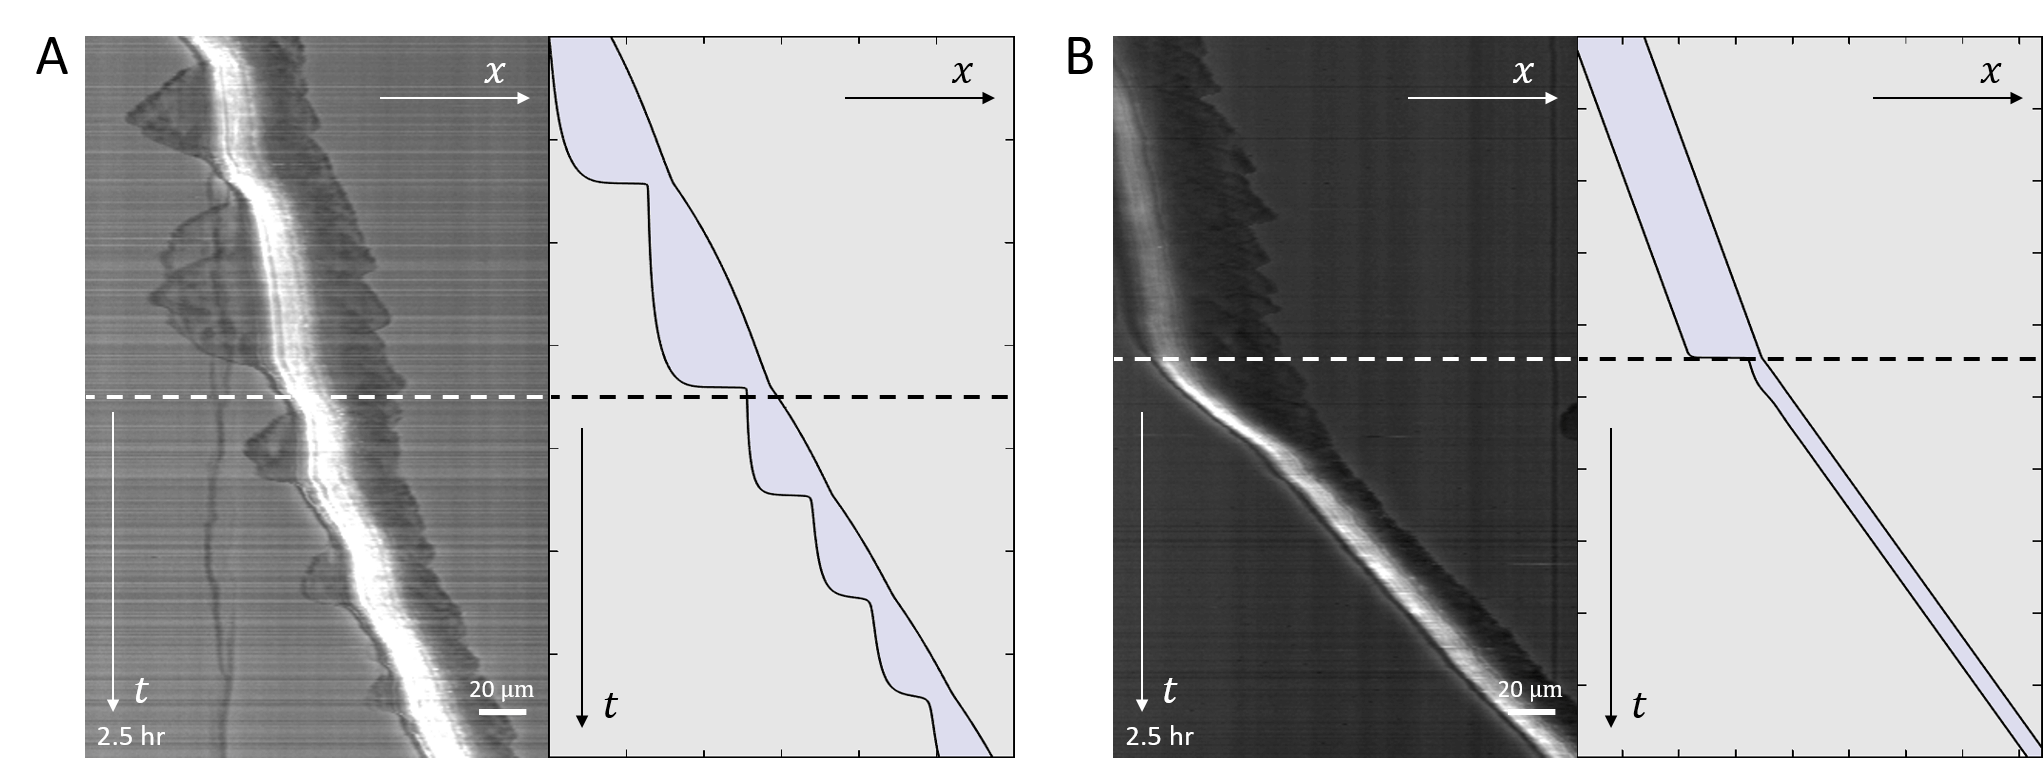
The robust features of the migration modes predicted by the model, can be observed in experiments (Fig.6). In Fig.6a we show a kymograph of a motile cell moving along a one-dimensional stripe, exhibiting stick-slip behavior. At a certain point along the trajectory the cell increased both its rate of stick-slip events, and its overall migration velocity. In addition, the amplitude of the stick-slip events decreased in size. All of these features are captured by the model, if the average adhesion strength between the cell and the substrate () decreases abruptly along the trajectory, and the cell moves from high to low within the stick-slip regime (Fig.2A). The cell-substrate adhesion strength is sensitive to the surface properties along the stripe, which may vary along its length. The backwards growth of the lamellipodia at the cell back, during each stick-slip cycle, are described by the more elaborate model below.
In Fig.6b we show a cell migrating smoothly, and then abruptly decreasing in length and increasing in speed. This behavior is captured by the model assuming that the adhesion strength decreases such that the cell jumps from high to low as shown in (Fig.2A,D,J).
Note that we can not exclude that the abrupt change in behavior observed for the cells in Fig.6 originates from a change in some other internal parameter of the cell. In addition, we observe highly dynamic stick-slip behavior at the leading edge of the cell, which we do not describe by our current model [23].
Part 2: Polarized cell with a dynamic protrusion
Model description
We now complement the length-adhesion model described above, by incorporating a model for the spontaneous self-polarization of the cell. We use a modified version of the scheme developed in [25] (Fig.7A), whereby in addition to the advection of proteins that enhance the actin treadmilling, such as myosin-II, we also consider an inhibitor of actin polymerization. The inhibitor protein is free to diffuse in the cytoplasm, and is also advected by the actin treadmilling flow. An example for an inhibitor of local actin polymerization, that is advected by the actin flow, is Arpin [28, 25]. We furthermore assume that the time-scale of the redistribution of this inhibitor across the cell is much shorter than the timescale of changes in the actin treadmilling speed. This assumption is corroborated by recent measurements of myosin-II redistribution time when advected by actin (sec) [27], while the stick-slip dynamics of the cell are over timescales of tens of minutes [9].
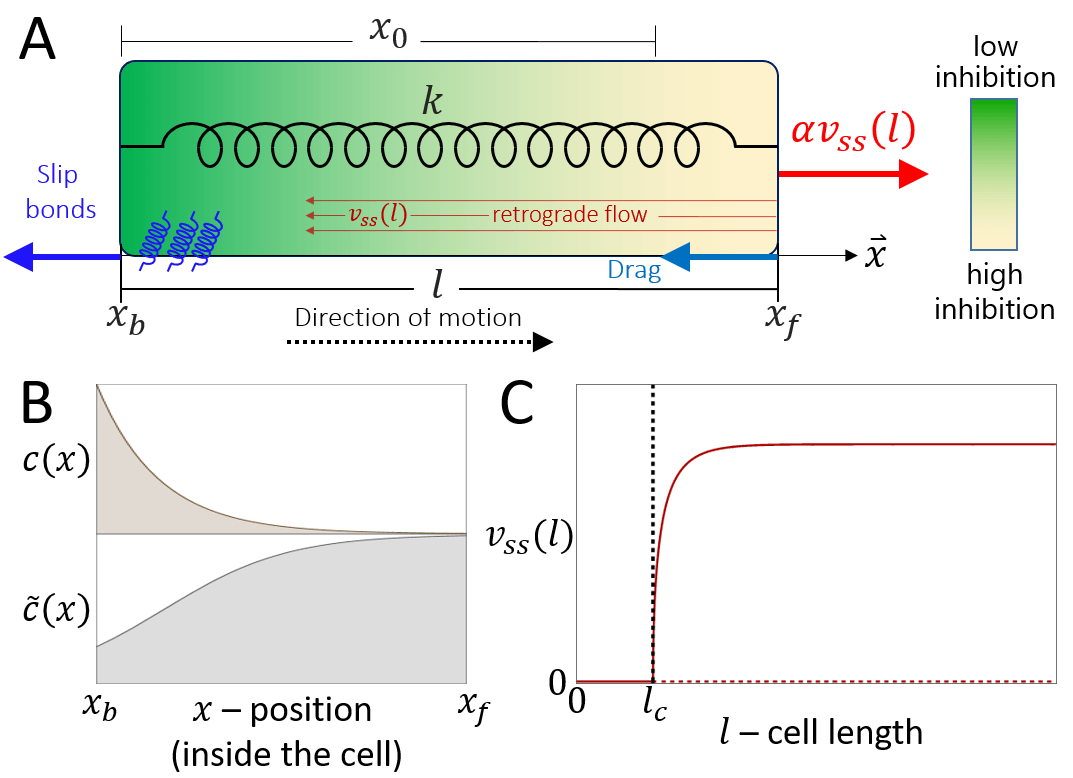
We can therefore use the steady-state distribution of the concentration of this inhibitor , which is given by an exponential function (Fig.7B)
| (19) |
where is the effective instantaneous actin treadmilling velocity, the effective diffusion coefficient of the inhibitor and is the total amount of inhibitor molecules in the cytoplasm (see Appendix B).
To complete the model [25], the net treadmilling flow is given by the difference between the actin polymerization flows created at the two ends of the cell, which are inhibited by the local concentration of the inhibitor at the front and rear
| (20) |
where gives the scale of the actin flow in the cell, and the polymerization activity at each end is diminished by the inhibitor concentration at each end, given by a simple Hill function: (Fig.7B), where is the concentration at which the effect of the inhibitor saturates.
After rescaling (see Appendix C), using Eqs.19,20, we obtain the following implicit equation for the net actin treadmilling flow
| (21) |
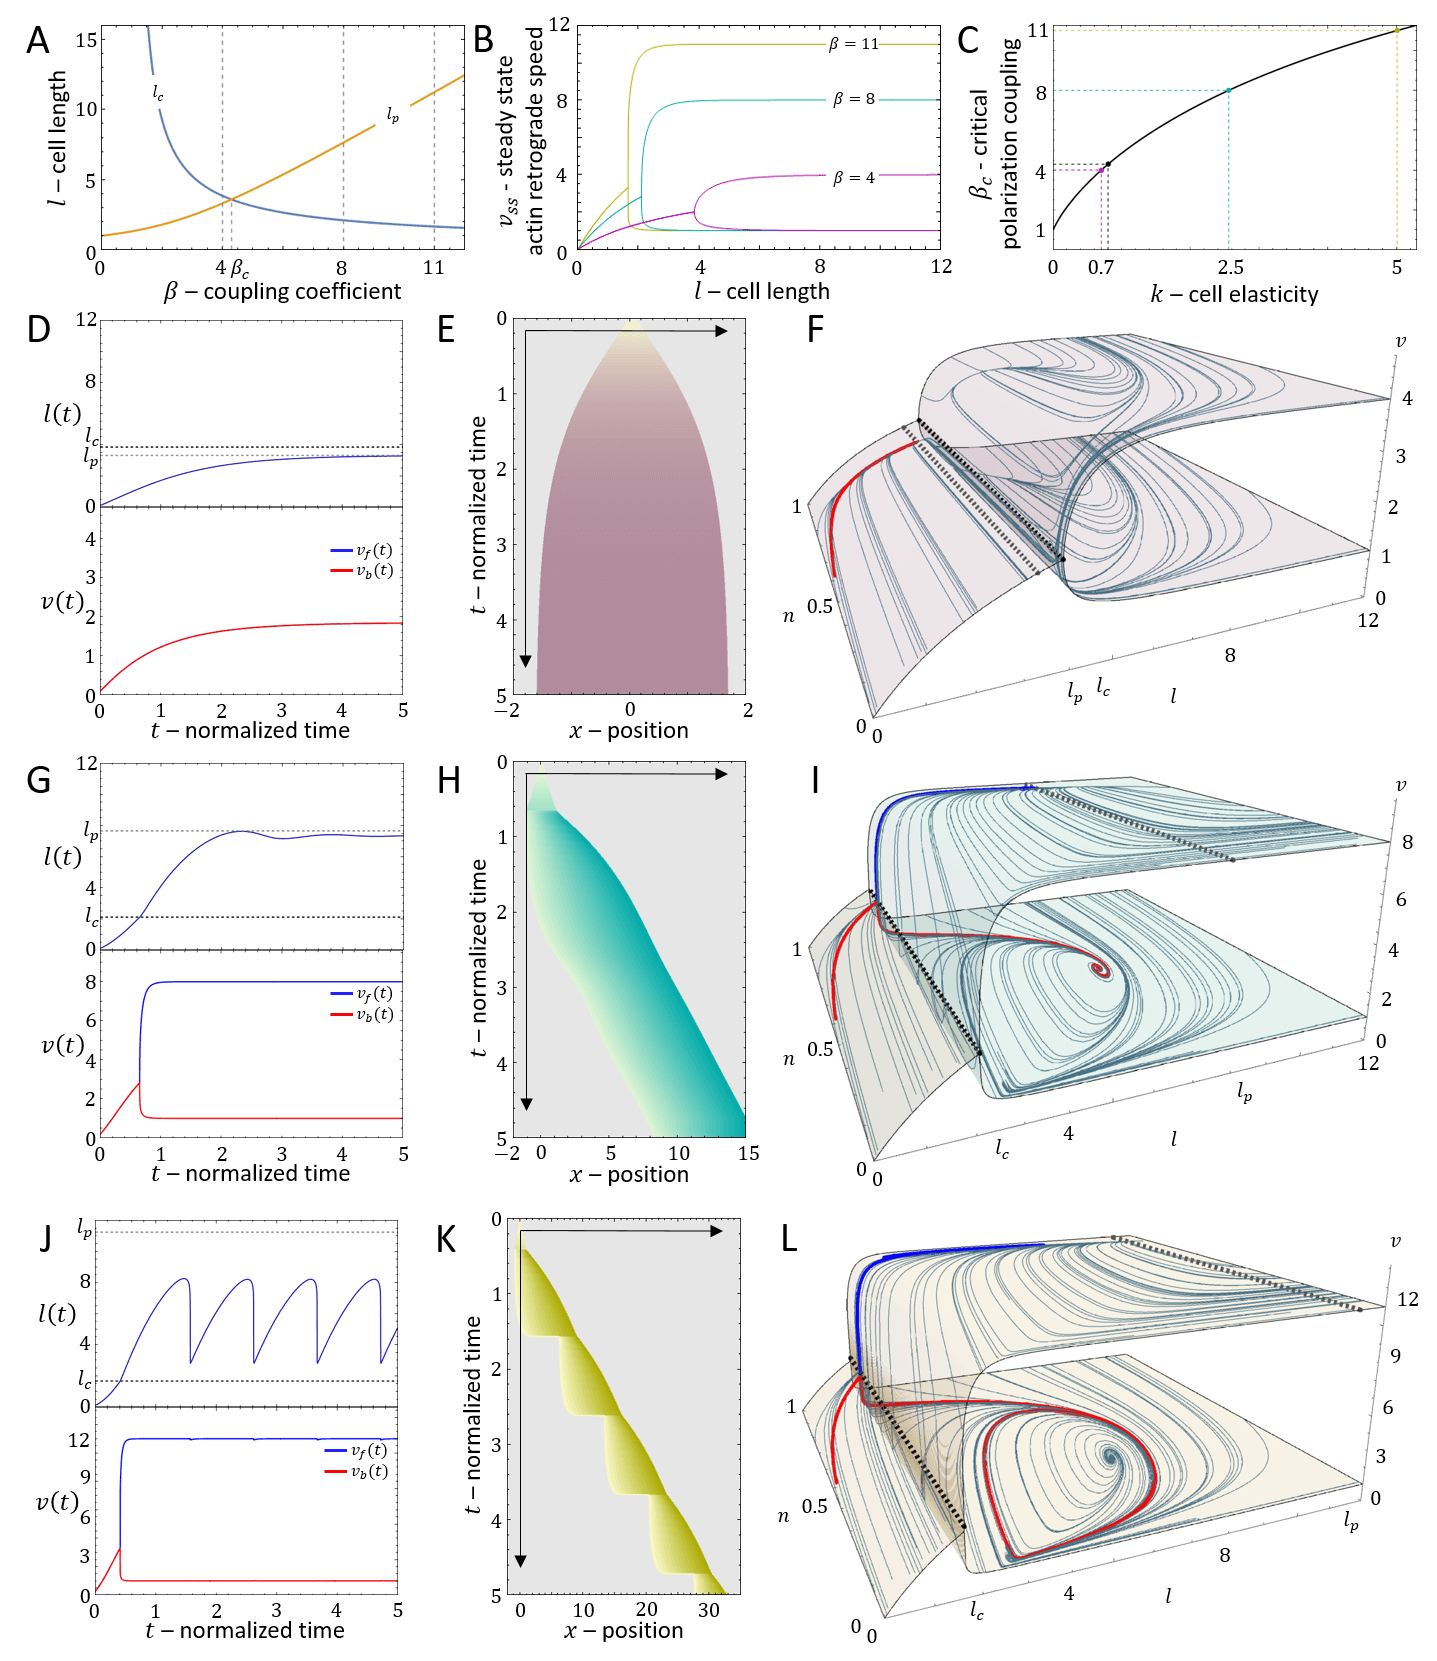
In the persistent regime (sufficiently large ), we find that as increases above a critical value Eq.(21) undergoes a pitchfork bifurcation, where spontaneous actin treadmilling appears, corresponding to a polarized and motile cell (Fig.7C). The critical length is given by
| (22) |
which provides a lower bound for the coupling strength , below which there is no spontaneous motility. A lower critical length for polarization was also obtained in [29].
The equations of motion are now extended beyond the basic model (Eqs.17,18) to include the dynamics of the actin treadmilling flow
| (23) | ||||
| (24) | ||||
| (25) |
where is the steady-state solution to Eq.21, which is the length-dependent actin flow speed, and is the rate at which the actin flow adjusts to length changes, i.e. the rate at which approaches .
For a cell that has a rest-length that is longer than the critical length for polarization, , the resting state of the cell is polarized. Since the velocity saturates to a constant value for (Fig.7C), the results are qualitatively similar to those we obtained for a constant, length-independent, (Fig.3).
We will therefore focus on the more interesting case where , and the rest-length of the cell is smaller than the critical length for polarization. In this case we find another fixed point that corresponds to
| (26) |
where the cell is at its rest length, and stationary.
Results
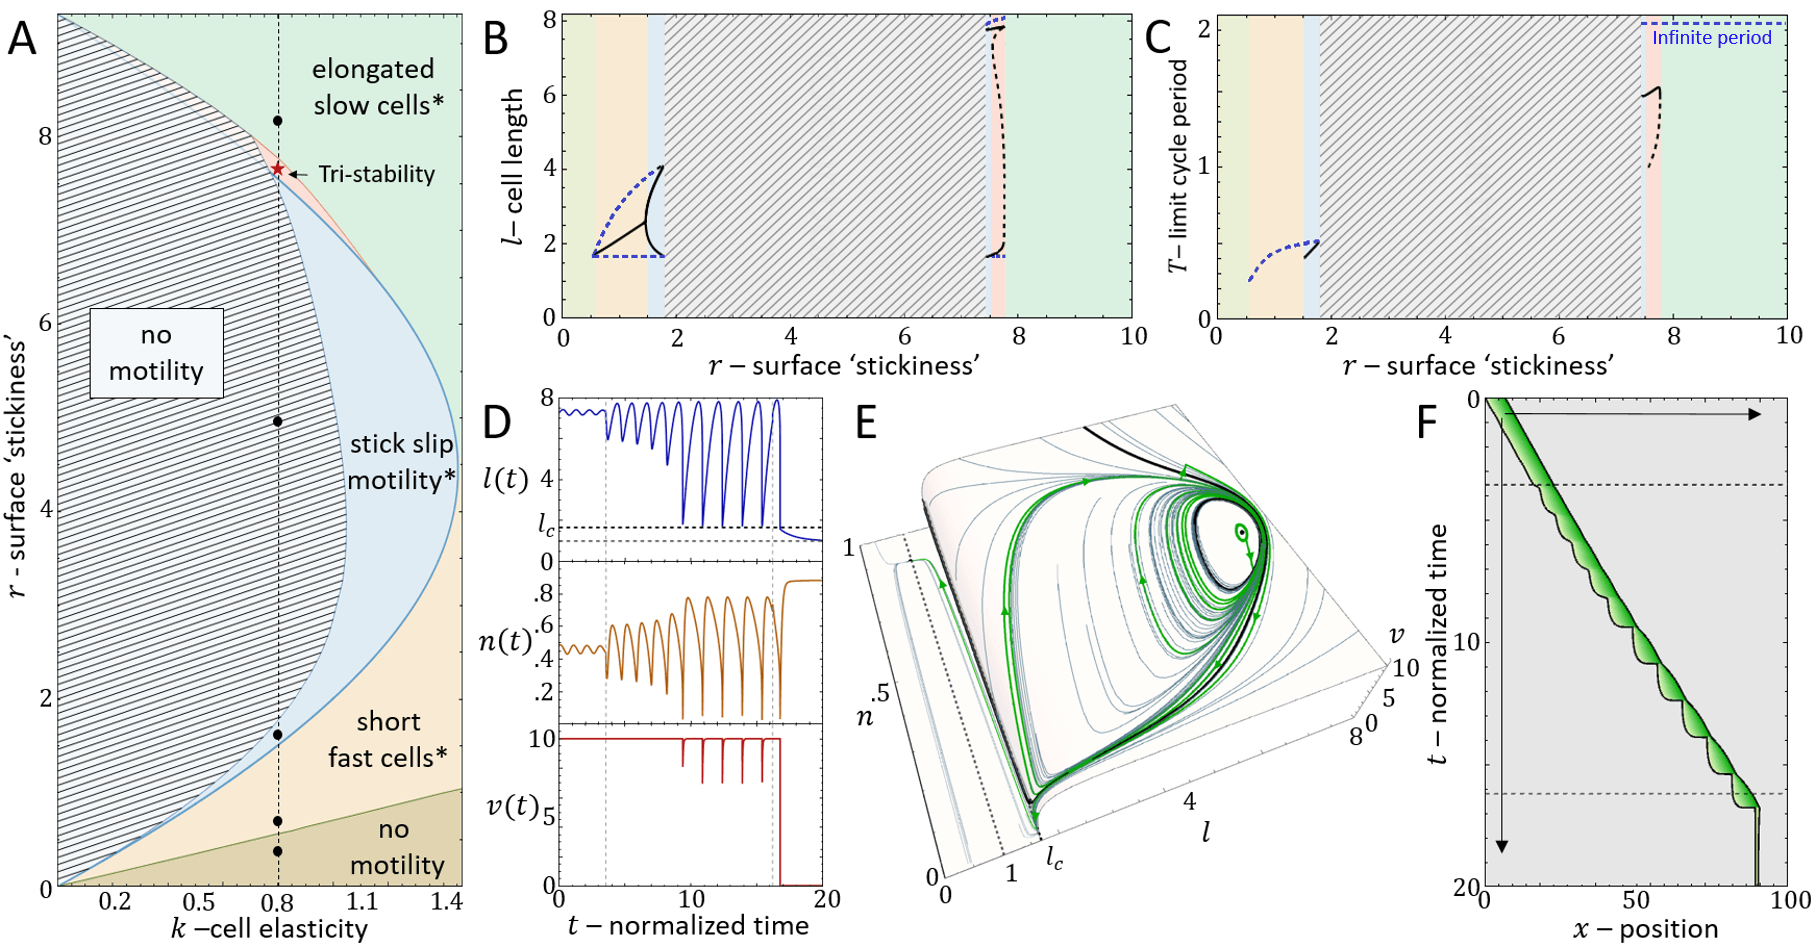
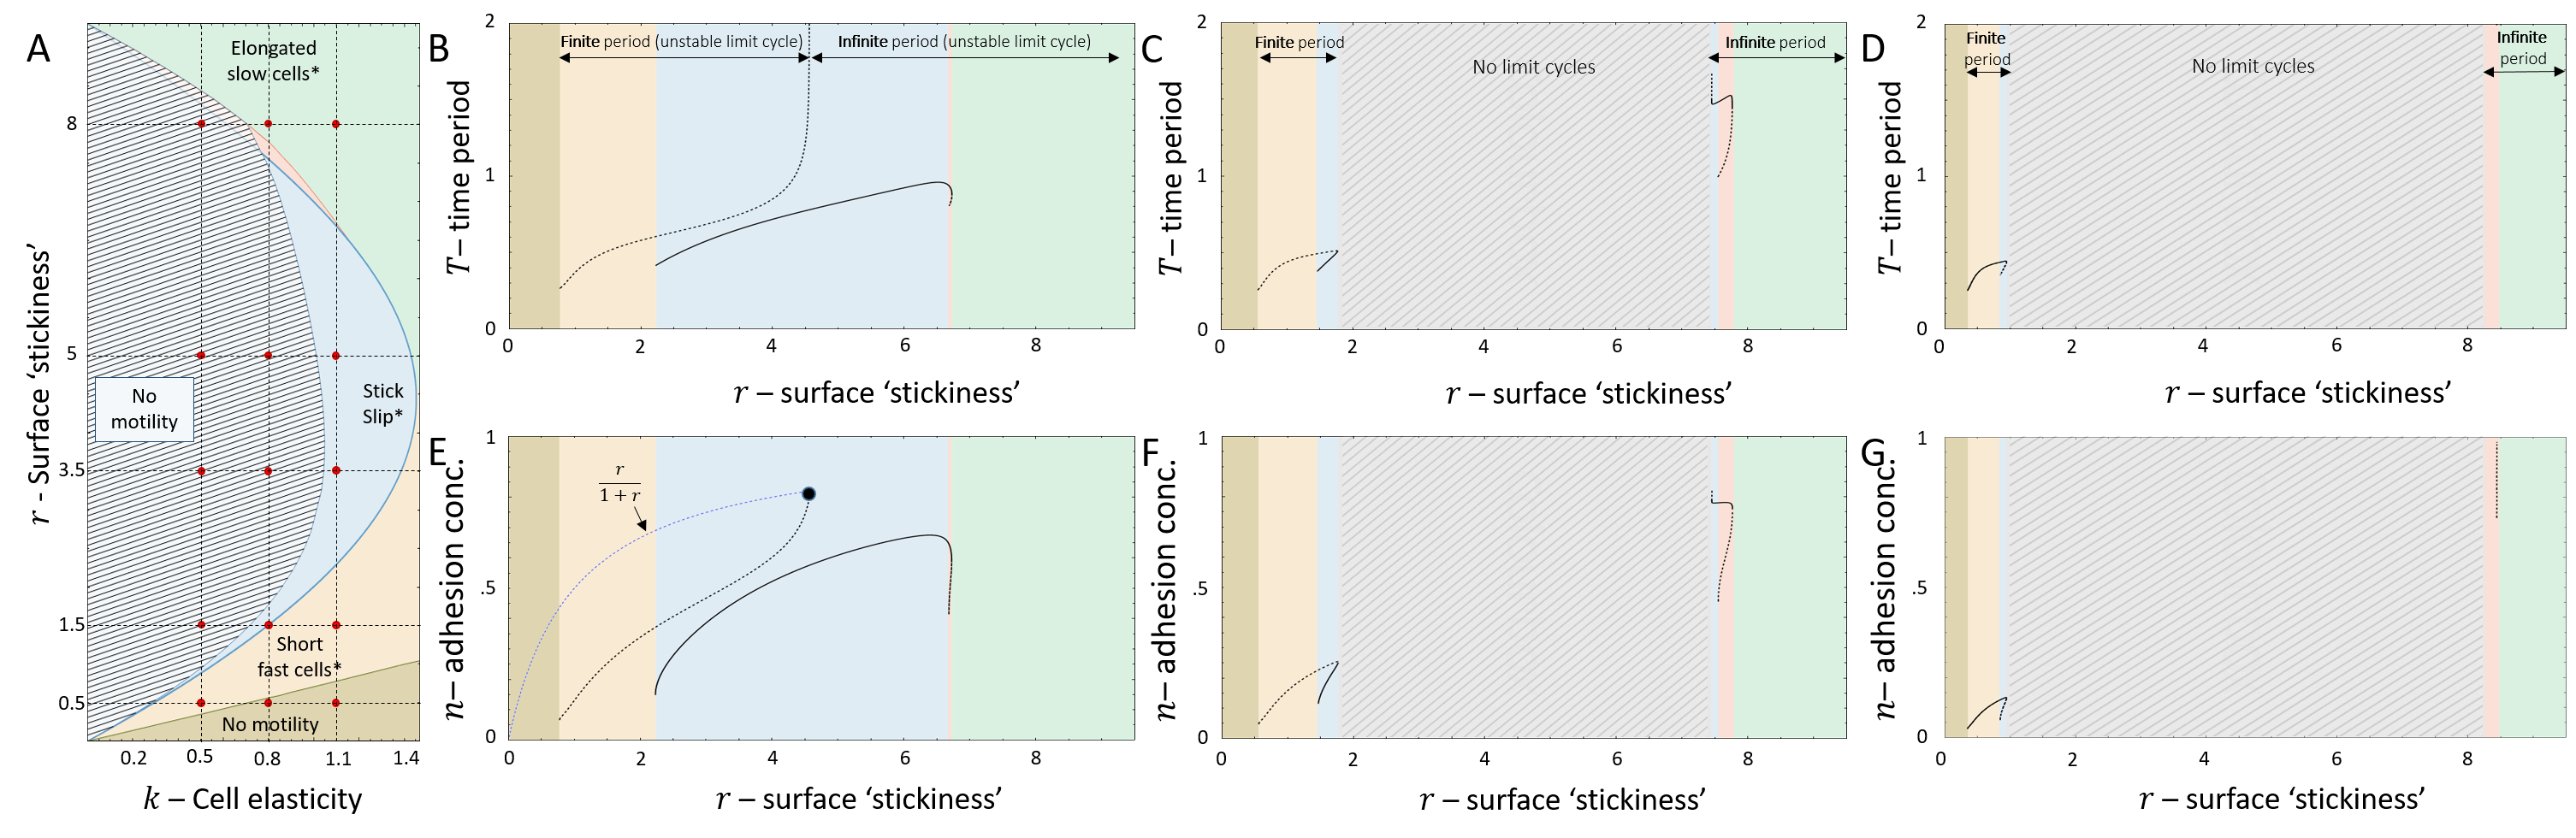
In Fig.8A we plot the phase diagram for the simpler case of , such that the actin flow speed is given directly by the solution (Eq.20, Fig.7C). In comparison with the case of fixed actin flow (Fig.2A), there are several new phases, despite the overall similar shape of the phase diagram.
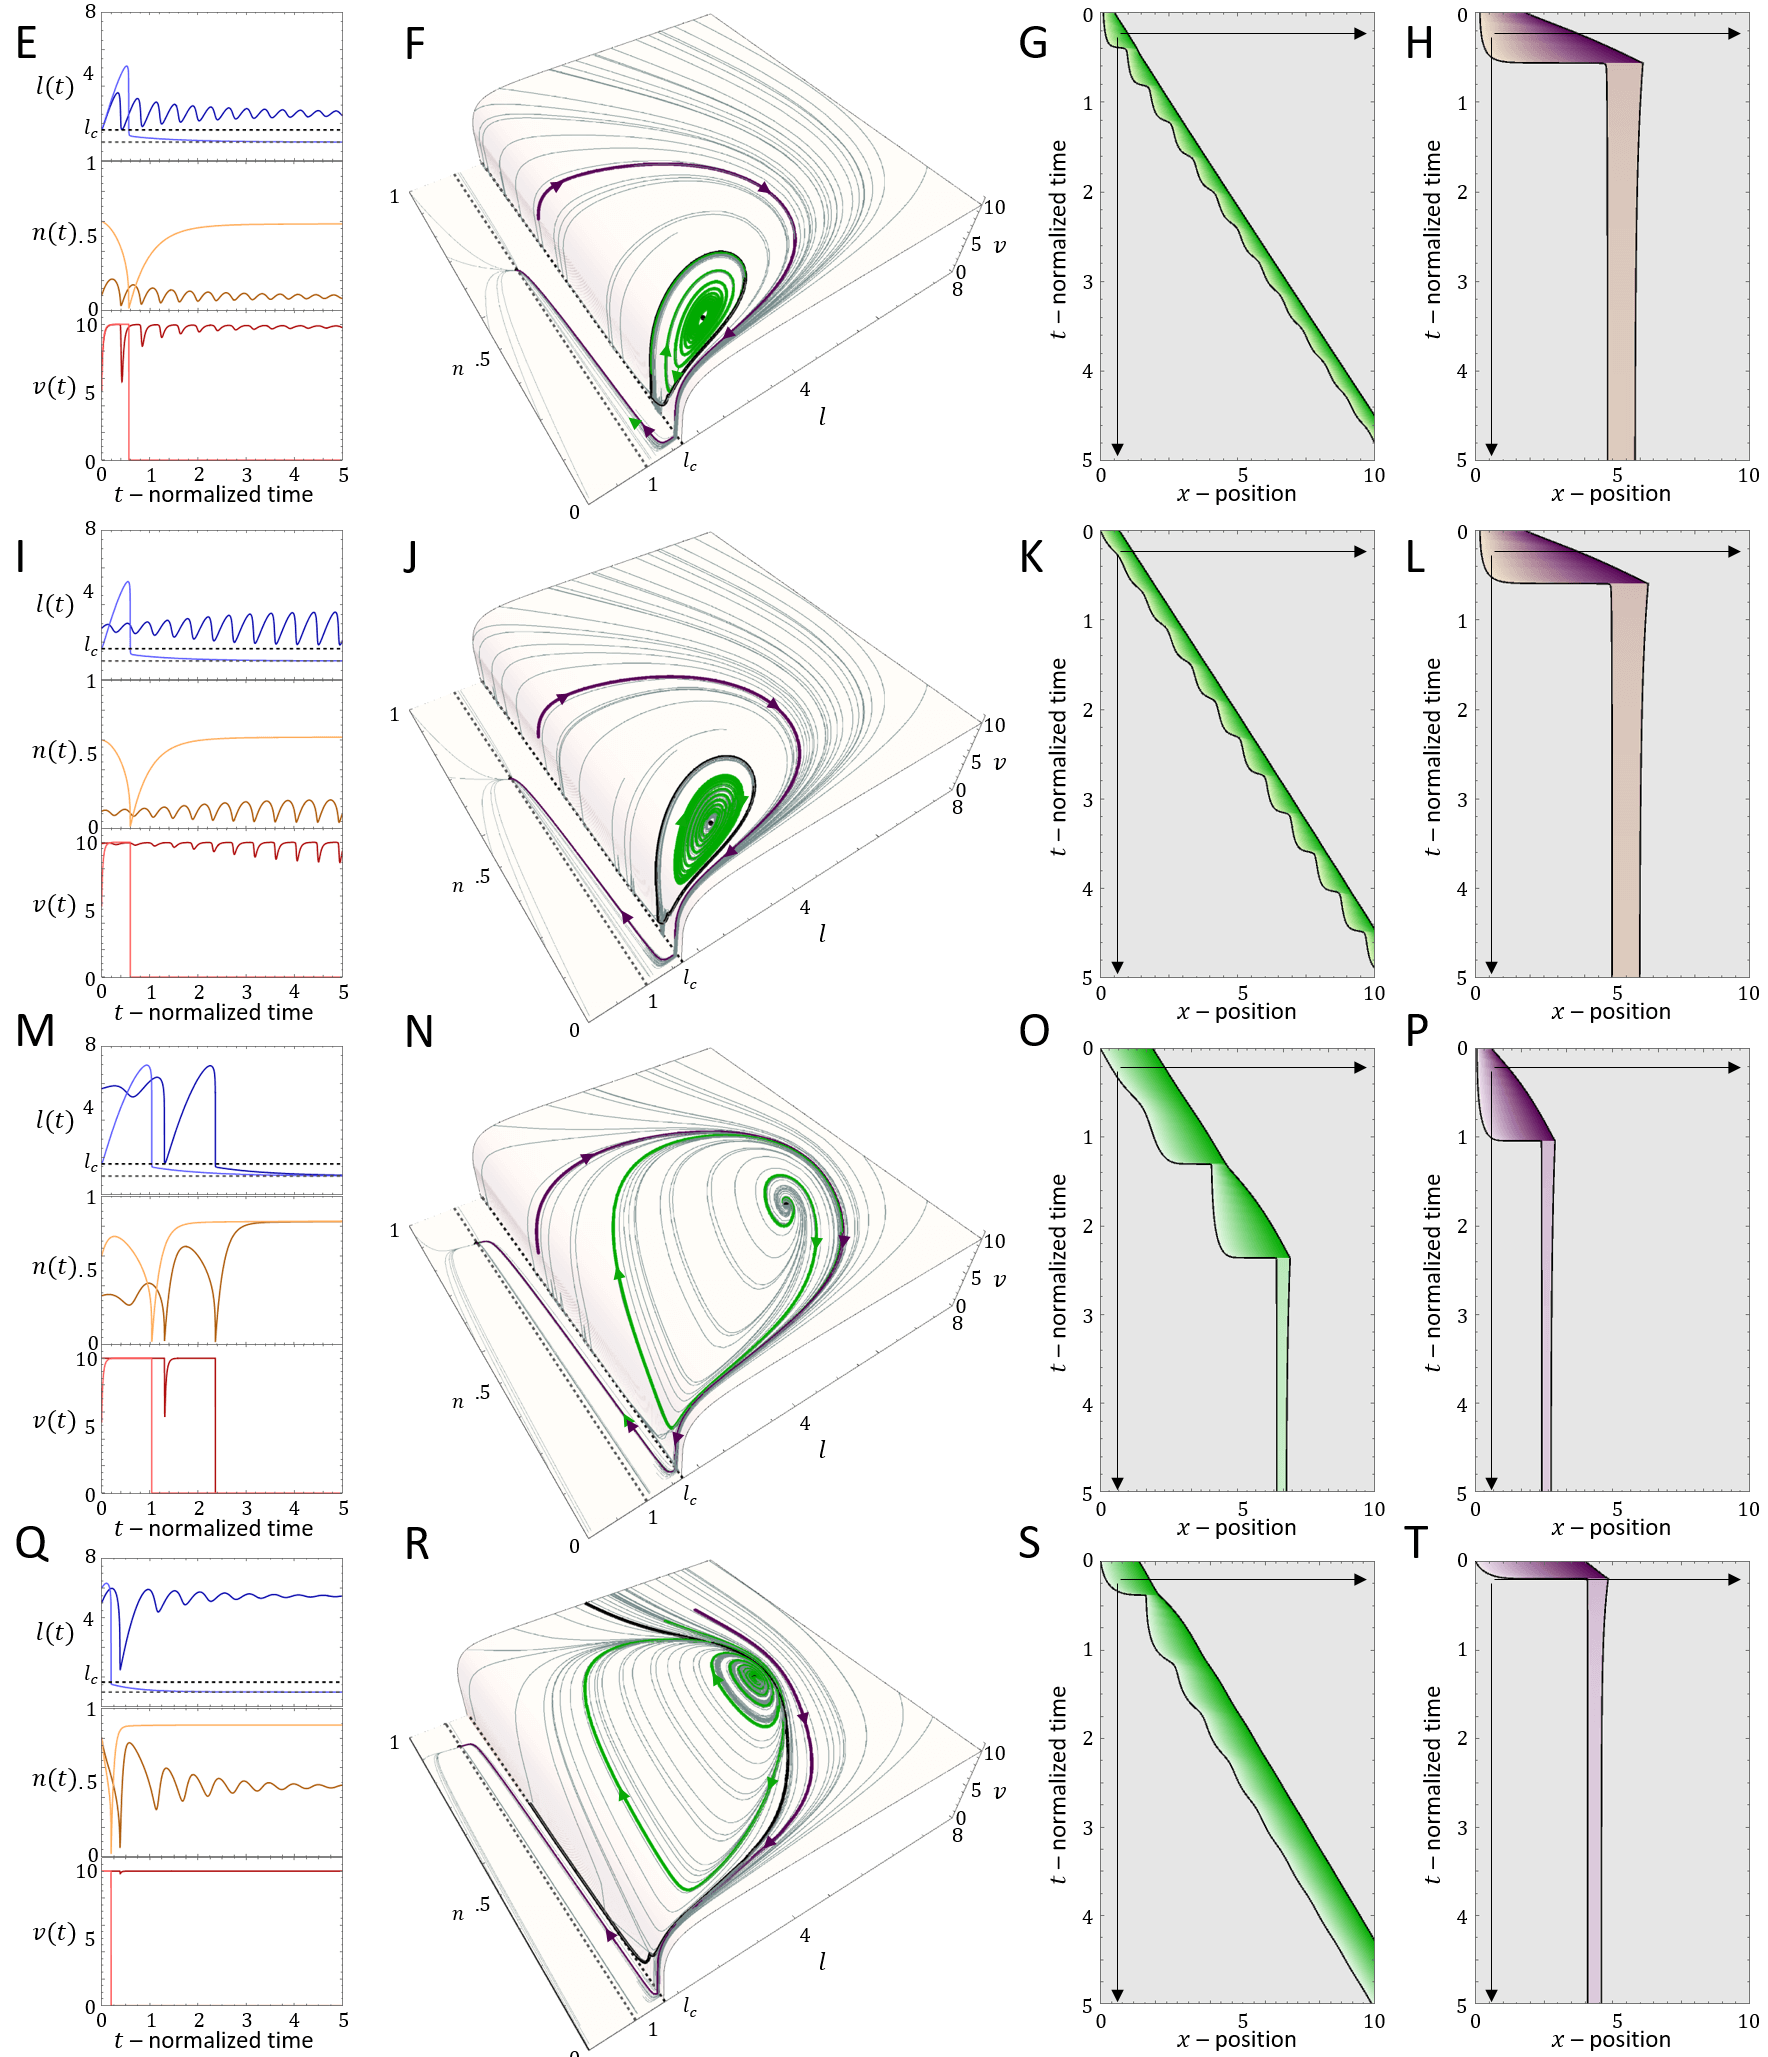
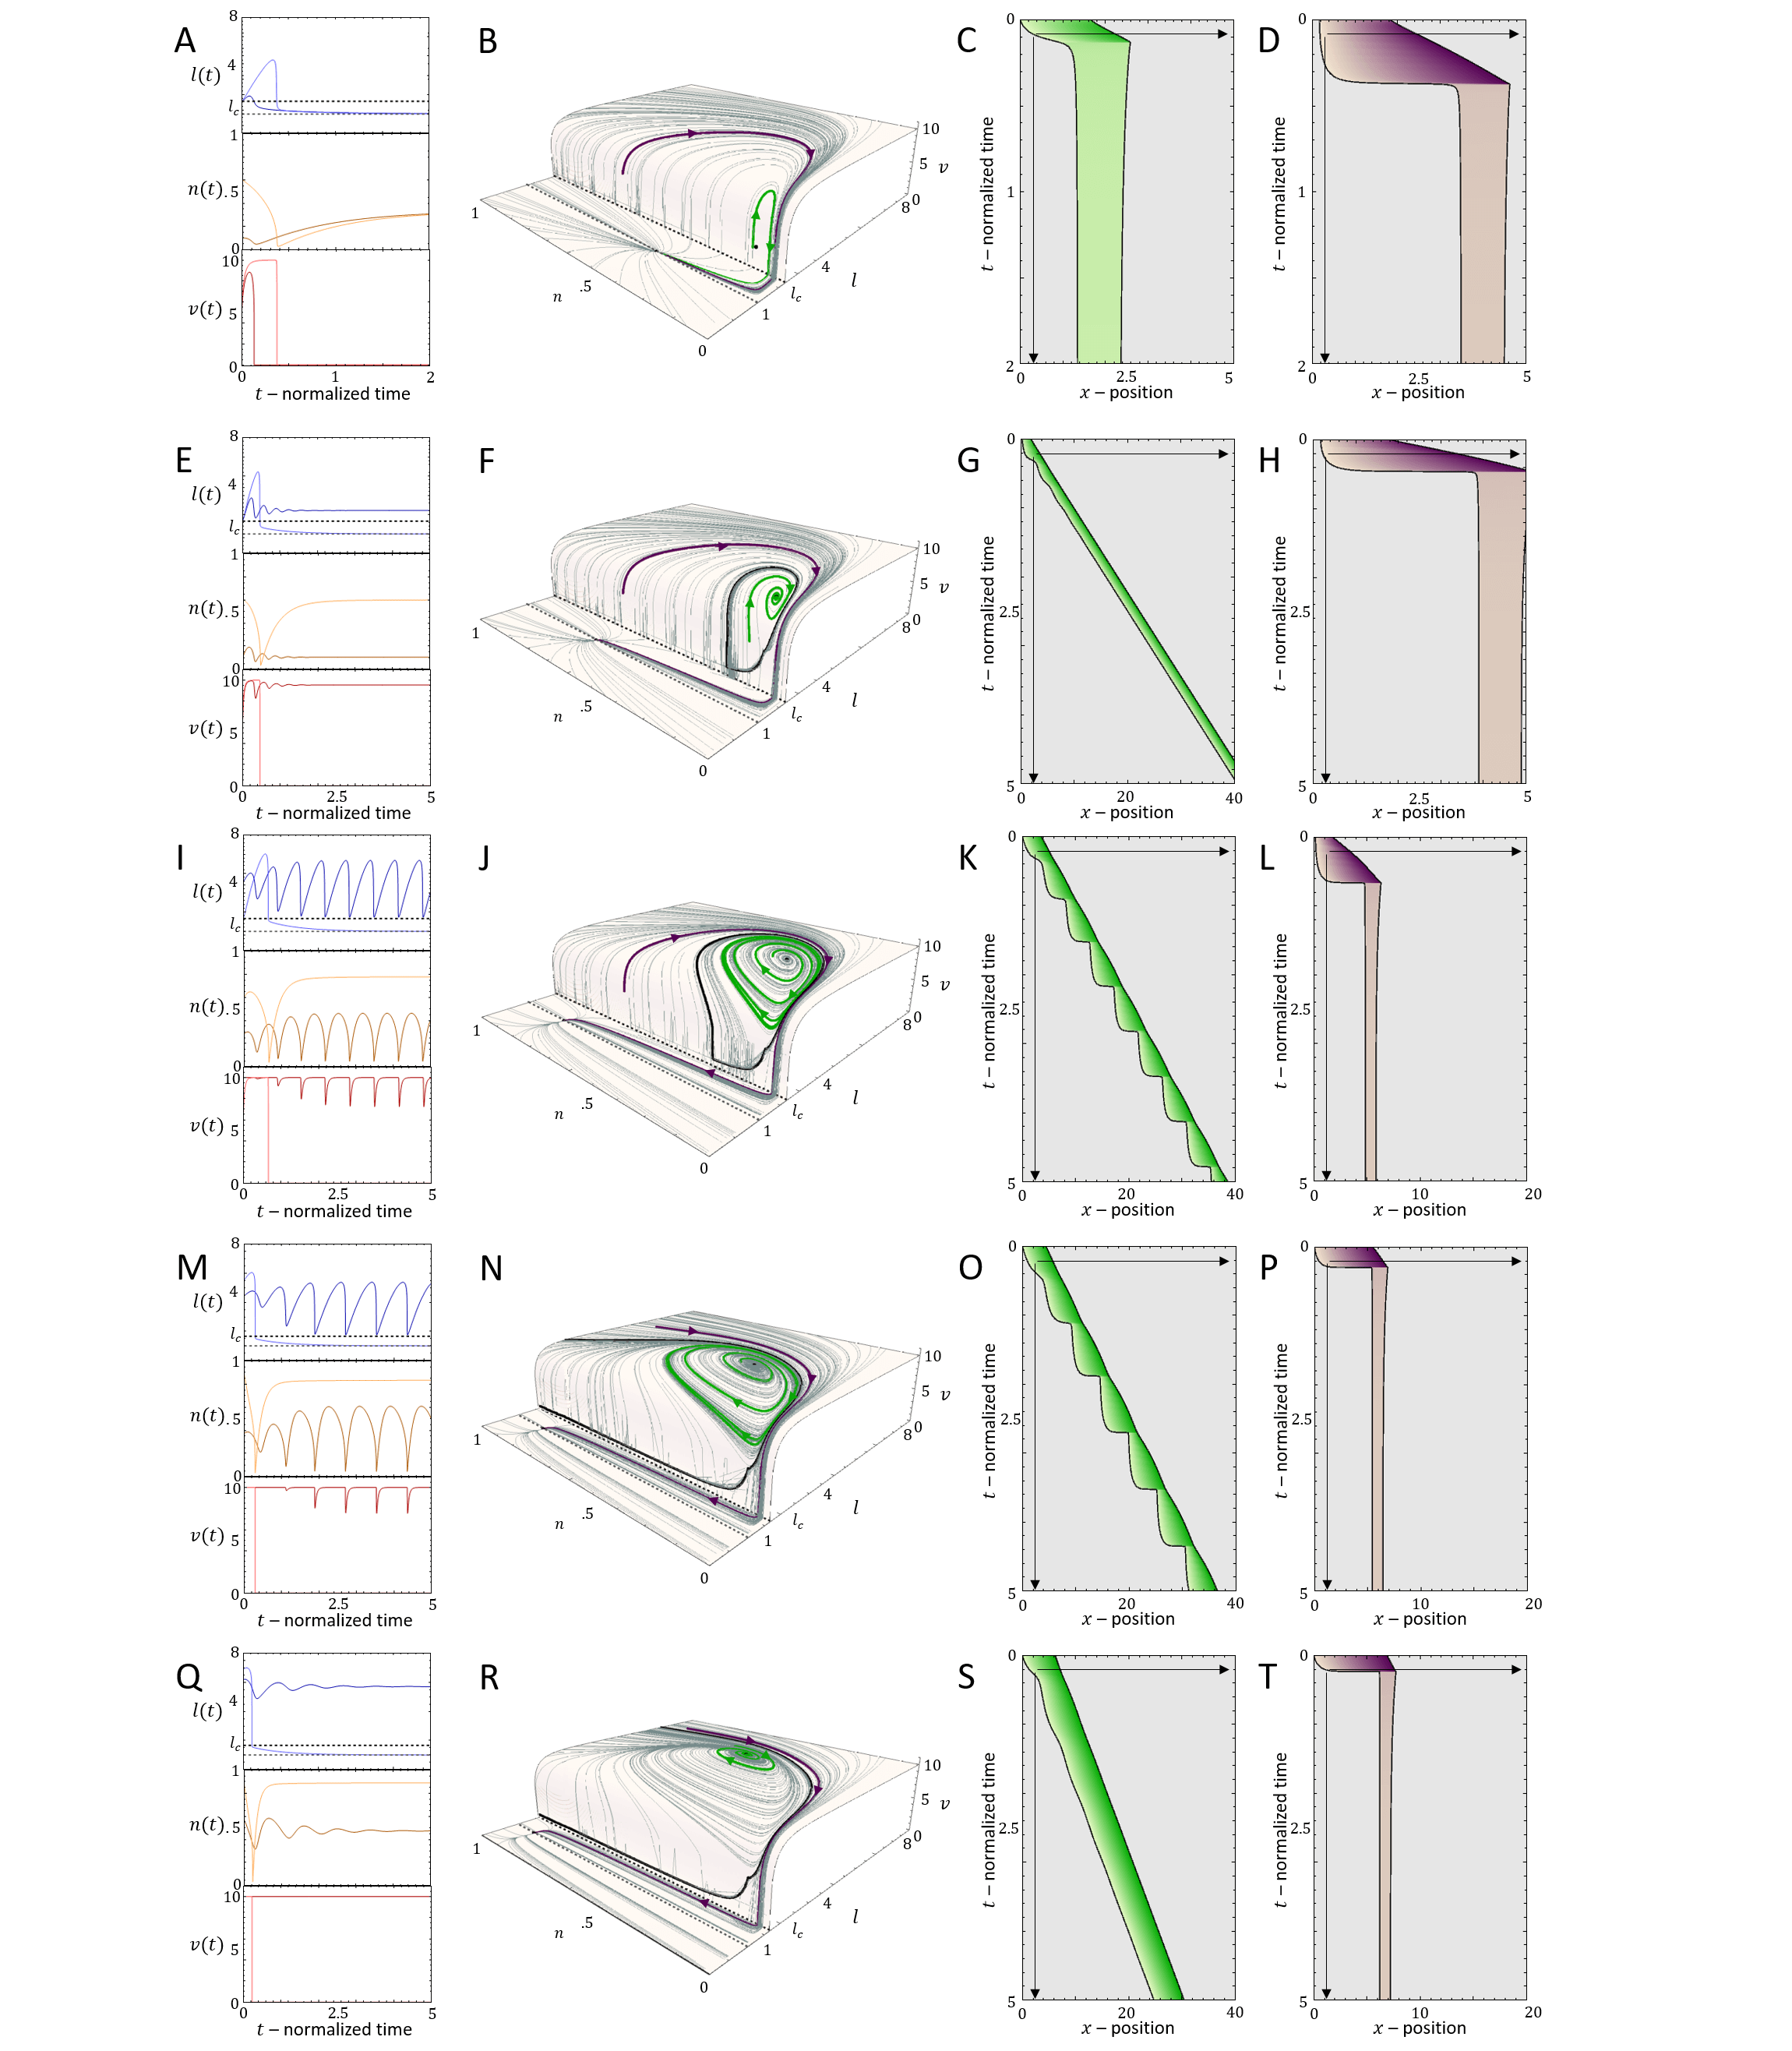
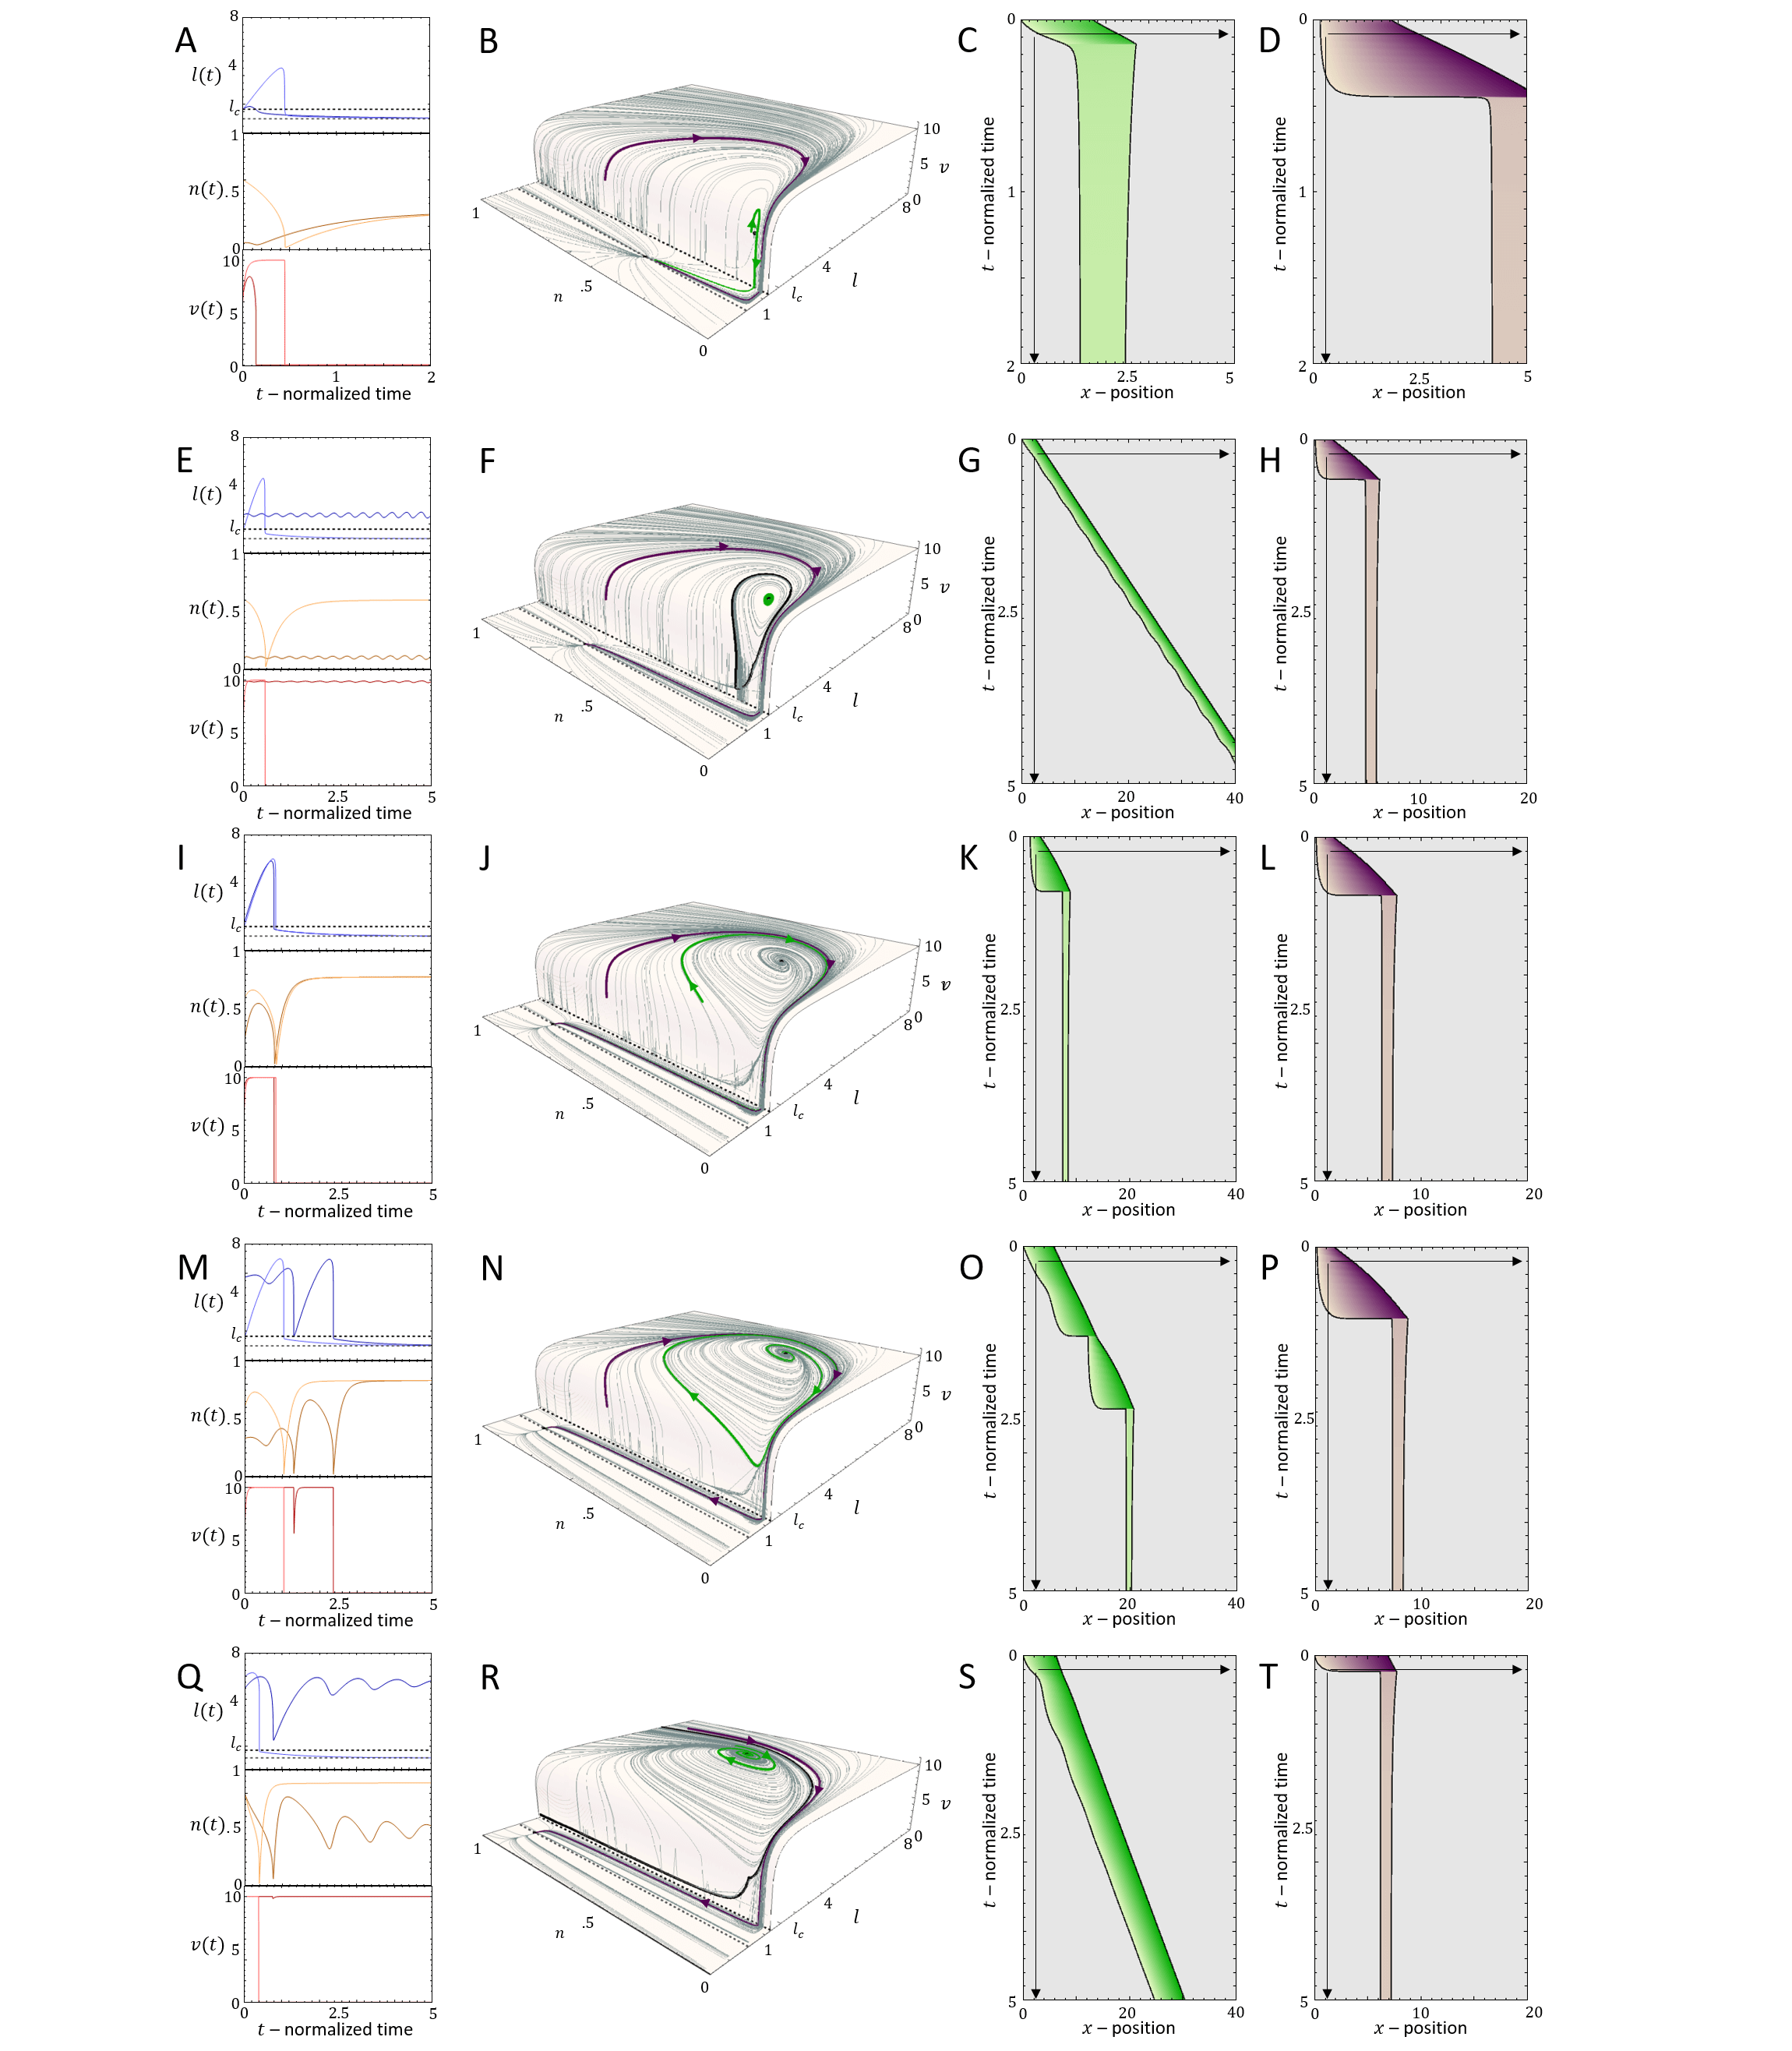
For very low values of , we find that there is a transition line below which the cell is non-motile (Brown region in Fig.8A), which corresponds to all the flows in the phase-space leading to the single fixed point at (Eq.26). Above this transition line, with increasing , there are phases of coexistence between smooth motion or stick-slip, and non-motile behavior. We plot in Fig.9 the dynamics for different points of increasing value of , for fixed (vertical dashed line in Fig.8A). Two flows are demonstrated for each case (green and purple paths and corresponding kymographs in Fig.9), exposing the coexistence of either smooth motion (E-H, Q-T) or stick-slip (I-L) with the non-motile phase. The bifurcations of the stable and unstable solutions are denoted by their cell length (and the limit cycle amplitude), as well as the limit cycle periods, in Fig.8B,C (along the same line).
There is even a thin region of tri-stability (Fig.8A), which we demonstrate in Fig.8D-F, by inducing a transition between the three phases by adding noise at specific times. For a fuller exploration of the phase diagram see Appendix E.
Next, we explore the effect of a finite value of , where the treadmilling velocity of the actin does not instantaneously adjust to its length-dependent value (Eq.25).
In Fig.10A we plot the shift in the stick-slip transition line to lower values of , for decreasing values of . The region of no-motility is now pushed to lower values of . The reason for this is shown in Fig.10B-D: when the length drops below after the slip event, the velocity of the actin does not drop to zero instantaneously (as in the case when ). There is therefore a region of the phase-diagram where the length recovers and increases above , allowing the stick-slip limit-cycle to survive. The ”stall duration”, during which and the cell is almost stalled, increases with increasing value of (Fig.10E).
Part 3: Self Polarized symmetric cell with a dynamic protrusion
Model description
In the model we developed so far, we did not allow for the actin polymerization to produce local traction and protrusive forces at both ends, but rather assumed that the competition between the two ends gives rise to a single leading edge (or to an unpolarized cell) (Fig.7A).
We now extend the model to describe the local protrusive forces that are produced by actin polymerization at the two ends of the cell (Fig.11A).
The dynamics of the moving front and back depend on their respective direction of motion: when they protrude there is a drag force that is given by a constant drag coefficient, while when they retract the friction depend on the slip-bond activity of the adhesion (Fig.11B). We therefore have the following equations of motion for the two ends of the cell
| (27) |
where the friction coefficients are given by
| (28) |
where is the theta Heaviside function. This way the friction coefficient depends on the local motion of each end. This is illustrated in Fig.11B, where the friction at the back is due to the slip-bonds when the back end of the cell is retracting and .
Note that the force that pulls on the adhesions during retraction (in the exponential function in Eq.28) is not only given by the elastic spring force (as in the previous models presented above), but is countered by the local force of actin polymerization that is pushing the membrane
Similarly, the dynamics of the adhesions are given by
| (29) |
The dynamics of the polymerization/tread-milling of the actin is now calculated separately on both sides of the cell, given by
| (30) |
where
| (31) |
The distribution of the inhibitor along the cell is affected by the competition between the treadmilling actin from both ends, so its given by Eq.19 with: .
Results
The solution of Eq.31 is shown in Fig.11C. The solution shows that the cell remains unpolarized for , and the actin tredmilling flows are equal at the two ends of the cell, given by . A polarized cell for has a higher treadmilling flow from the front, and in the limit of large the treadmilling velocity approaches these limiting values: and .
We find that there a new length scale in the system, which determines the ability of the cell to elongate and reach polarization. For the the unpolarized cell we equate the protrusive forces at both ends to the restoring force of the spring
| (32) |
which yields the polarization length
| (33) |
By equating the critical length (22) to the polarization length (33) we obtain a critical value of , above which the cell polarizes (Fig.12A,B)
| (34) |
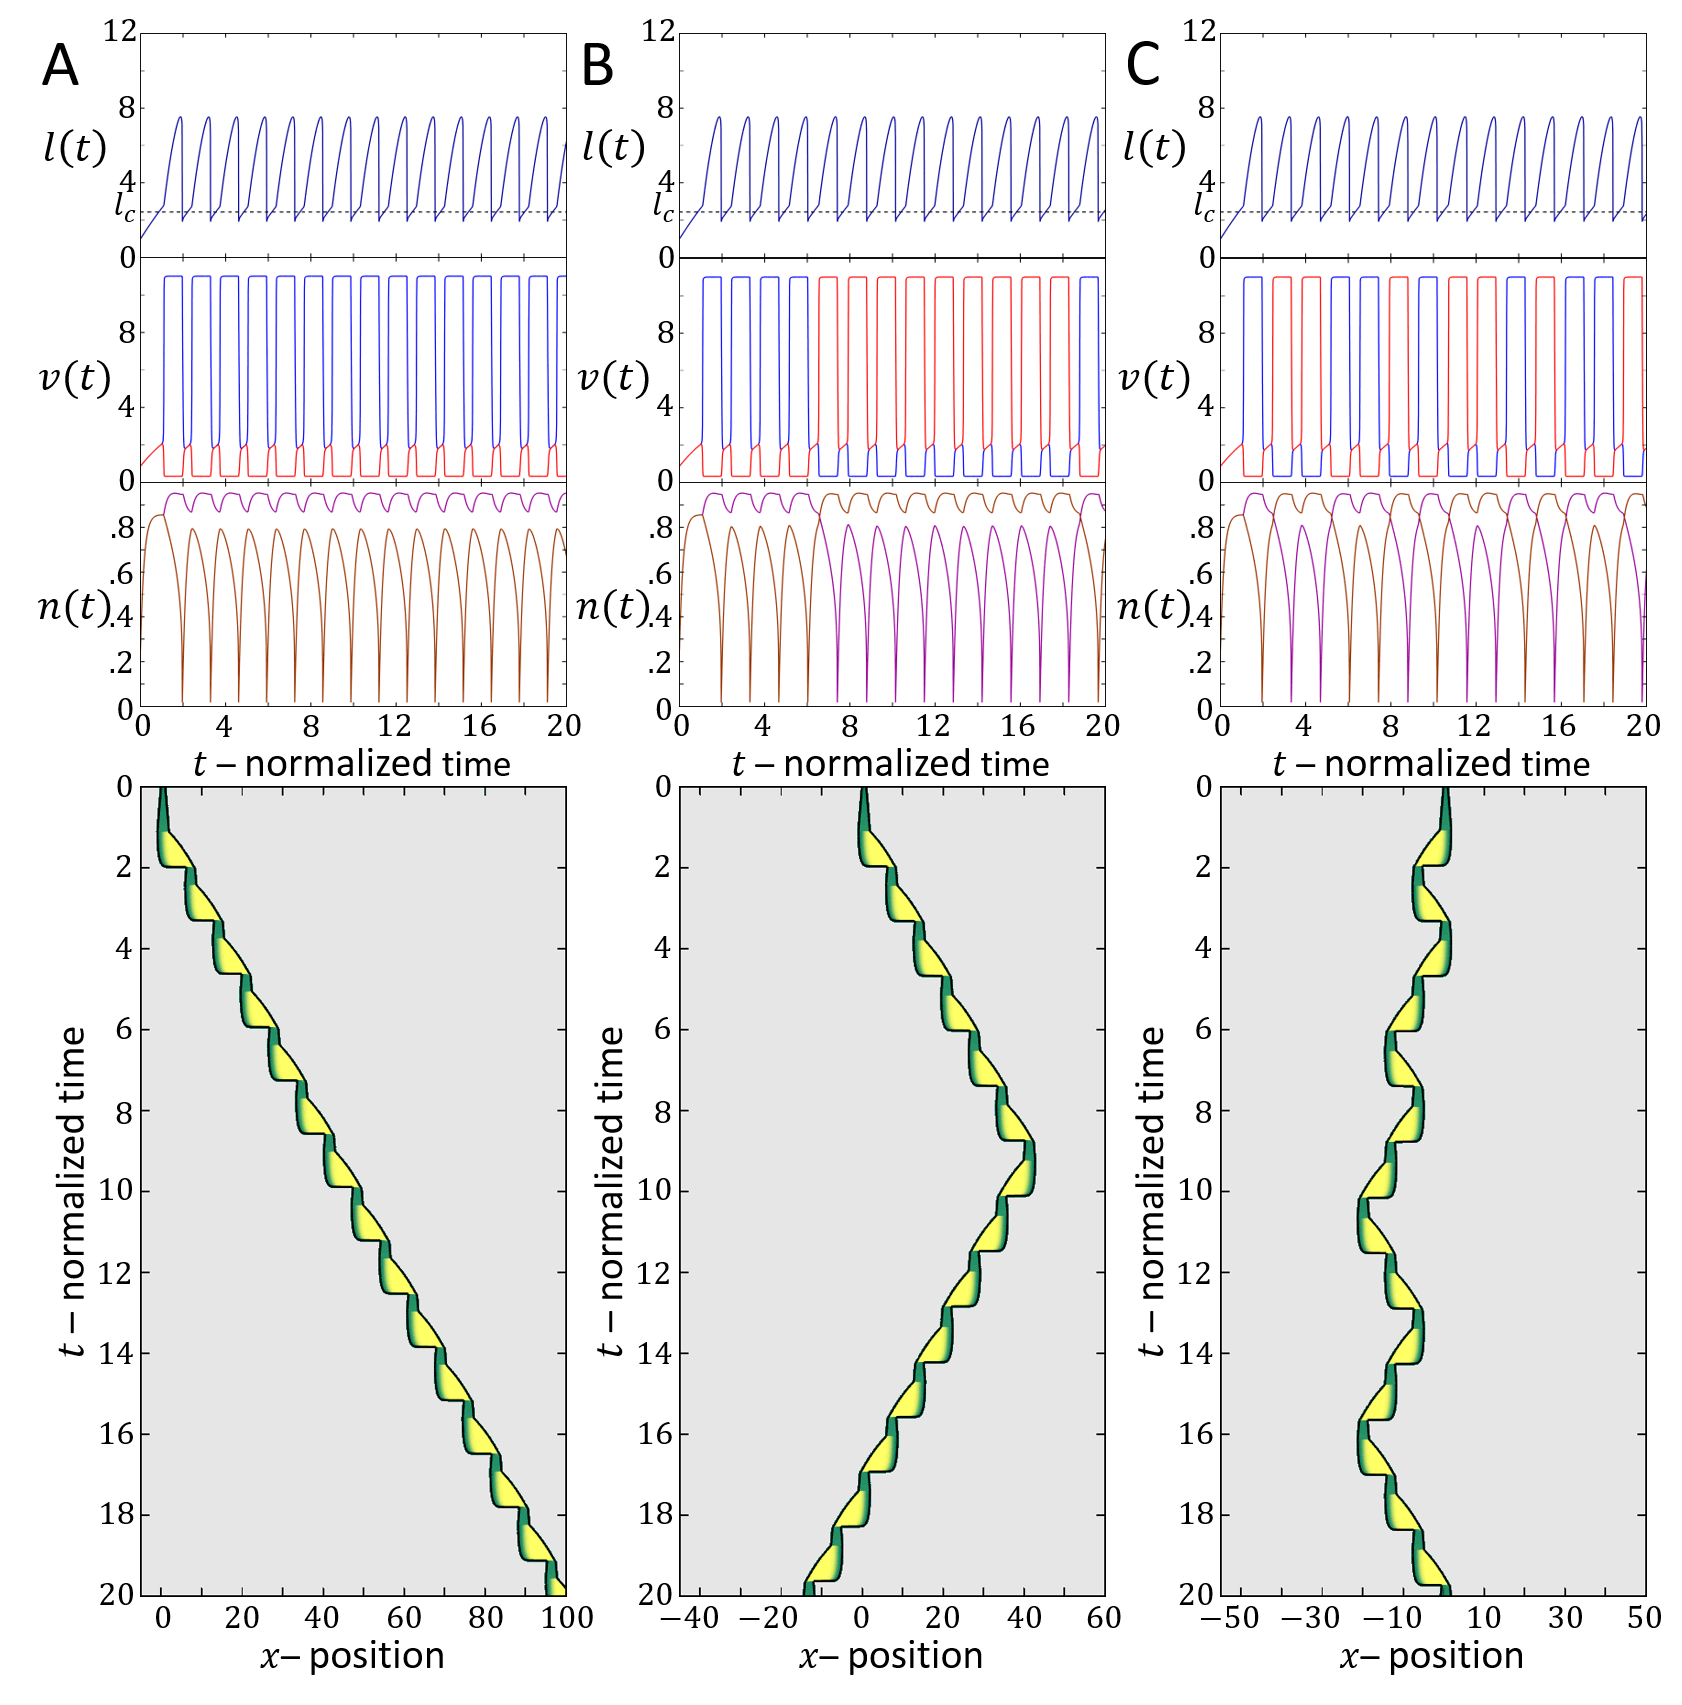
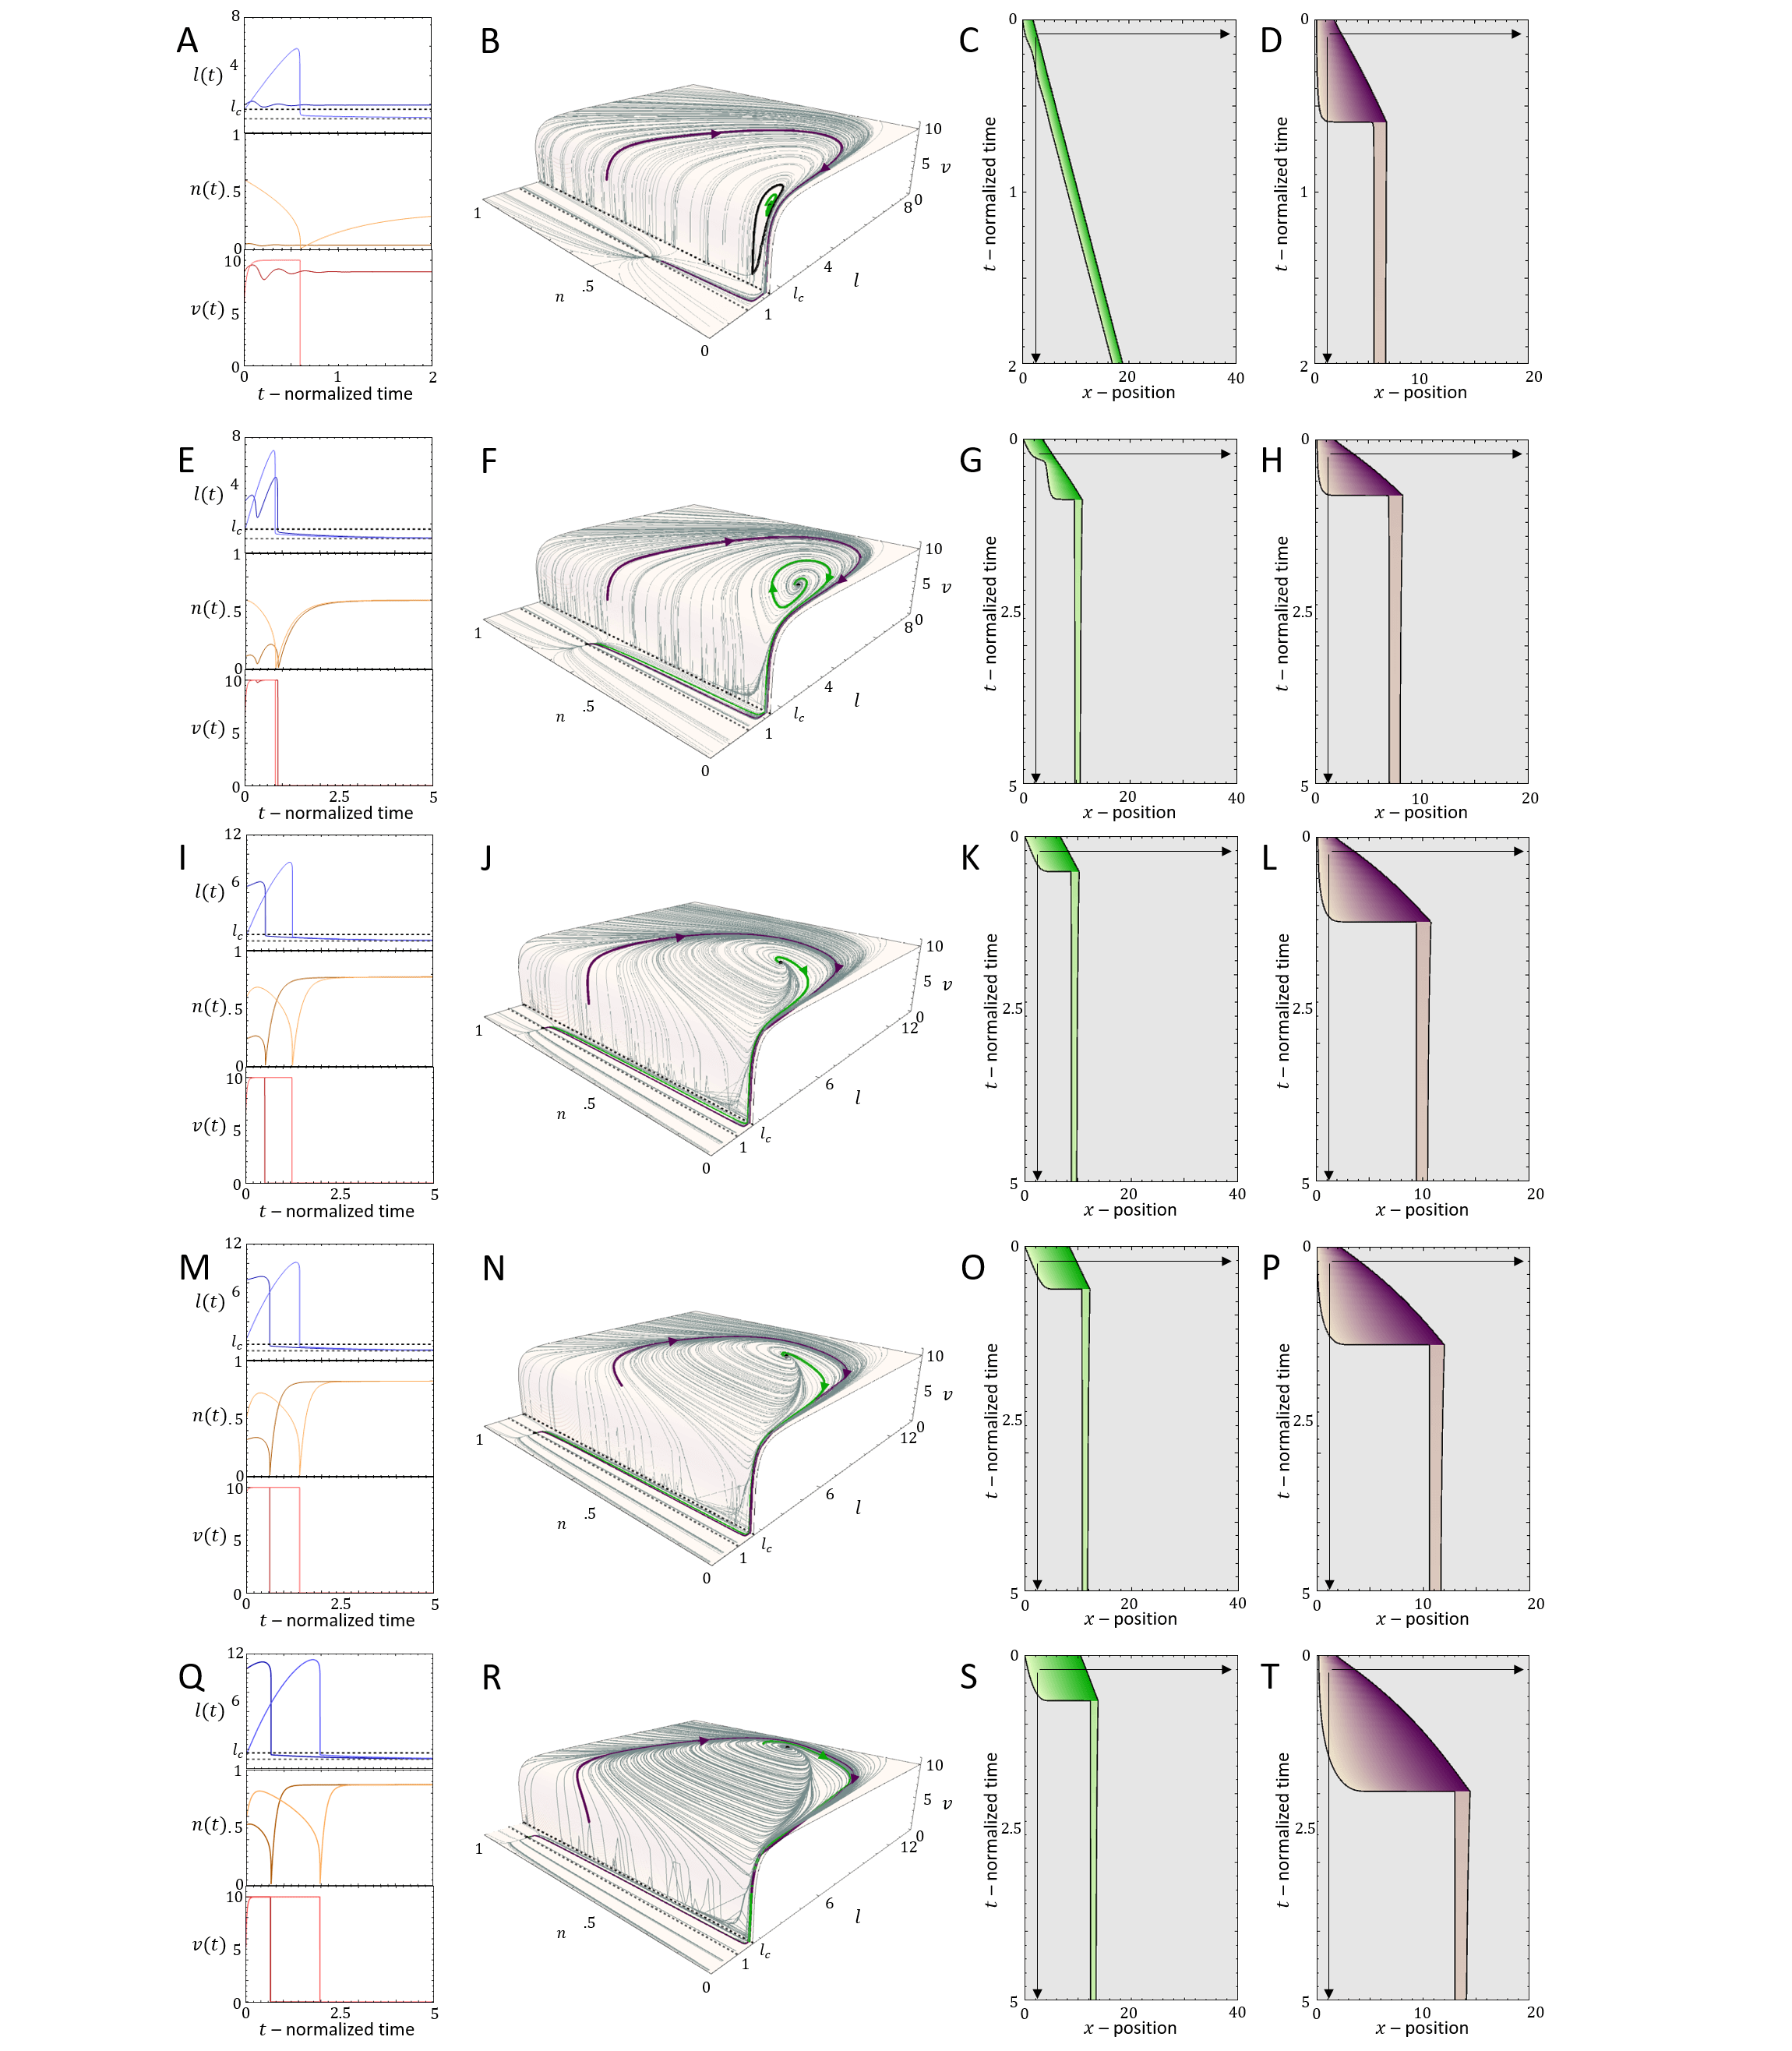
As for the previous model, the interesting behavior is for a cell that has a rest-length that is smaller than . For such a system we demonstrate the dynamics for different values of (above and below ), in Fig.12D-L. For the cell elongates symmetrically (Fig.12D-F), but does not polarize (no spontaneous symmetry breaking). For we find regimes of smooth motion (, Fig.12G-I) and stick-slip (, Fig.12J-L) for parameters that correspond to these phases in the phase diagram of the stationary treadmilling system (Fig.2).
When the cell is within the stick-slip regime, it may end up after each slip event with a cell length that is shorter than . Since in the symmetric model the protrusive force acts locally at both ends, the cell elongates symmetrically until and it repolarizes. This is demonstrated in Fig.11B. In Fig.20 we show the effect of the parameter on the stick-slip migration, where increasing decreases the retrograde flow and increases the time it takes the cell to repolarize following each slip event.
Furthermore, since the cell is effectively stalled when its length is shorter than , the time it takes for the cell to expand back to after each stick-slip event determines the overall migration velocity. This is demonstrated in Figs.21,22.
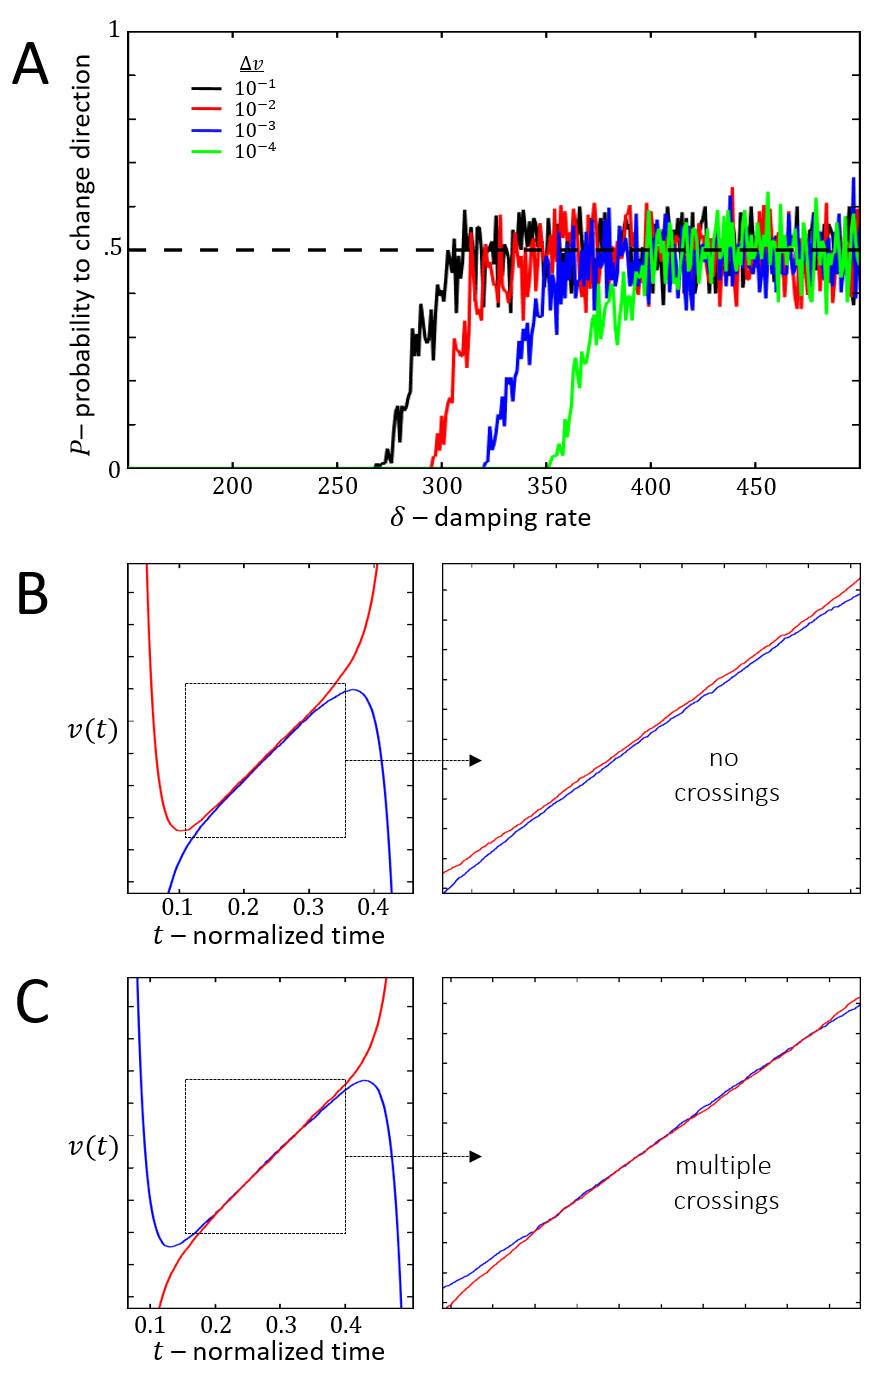
During each stick-slip event, since the cell loses polarity, it may repolarize in a new direction. This occurs when we add random noise to the equations of motion: the system is solved as a stochastic differential equation where additive noise is added to the actin flow and . For different amplitudes of the noise term we plot in Fig. 13A the probability that the cell changes its direction of motion per stick-slip event. We find that for each level of noise there is a critical value of the actin response rate (Fig.30) that sets a threshold between and . During each stick-slip event, when , the actin flow velocities on both sides approach each other exponentially with a time-scale of . As approach within the noise amplitude, they cross each other (Fig. 13B,C), and the side that has the higher flow when determines the new direction of cell motion. The dynamics around the critical where the turning probability increases strongly, are demonstrated in Fig.14.
Comparison to experiments
When comparing the results of our fully symmetric model to the experimental observations of motile cells along one-dimensional tracks, we need to note that the cellular system is very noisy. Nevertheless, our model exposes distinct motility patterns that should underlie the noisy motion of the cells.
First, we wish to show that the main classes of cell behaviors, which is observed within a uniform population of identical cells (Fig.15) can be qualitatively spanned by the model if, for example, the actin treadmilling activity (model parameter ) is variable within the population.
Next, we focus on the stick-slip migration pattern, and compare several examples of such observed cell trajectories to the dynamics predicted by the model (Fig.16). We find that there is strong similarity between the dynamics exhibited by the cell and in the model, regarding the oscillations in the cell length and velocity. The limit-cycle trajectory predicted by the model can be observed in the experimental data. For slightly different set of parameters, we find that the model gives rise to other stick-slip regimes observed in the experiment: a cell with low-frequency of small-amplitude stick-sip events (Fig.17), and a cell with high-frequency of large-amplitude stick-slip events (Fig.18).
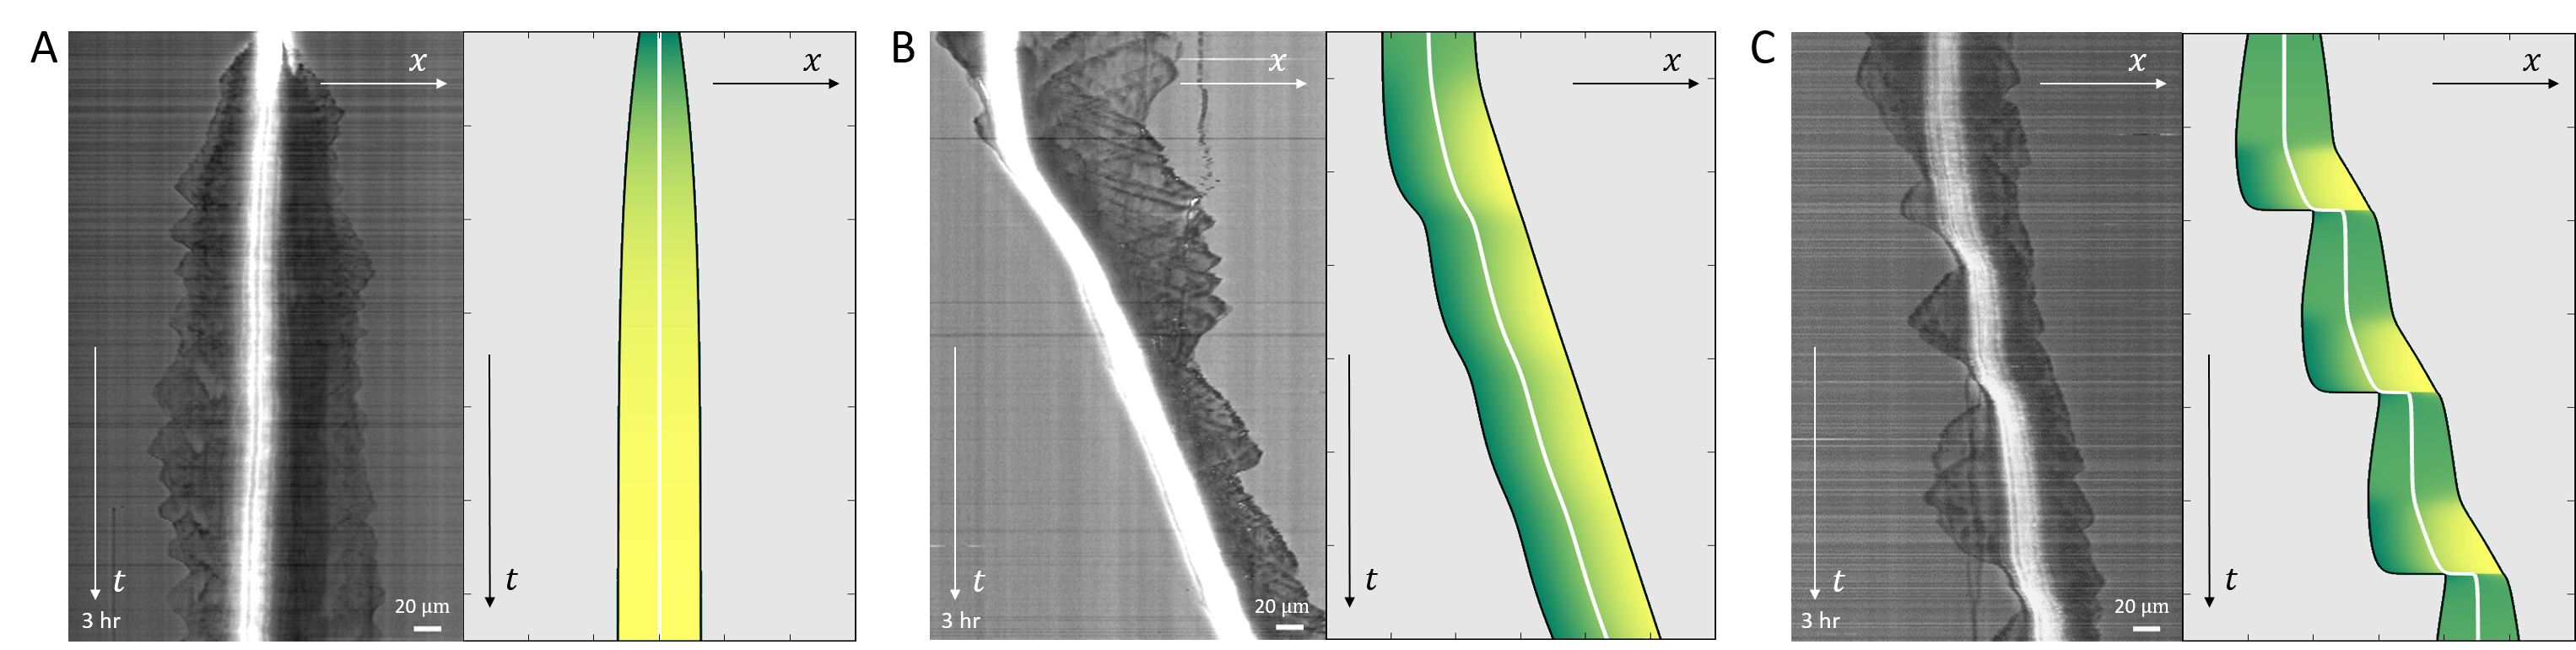
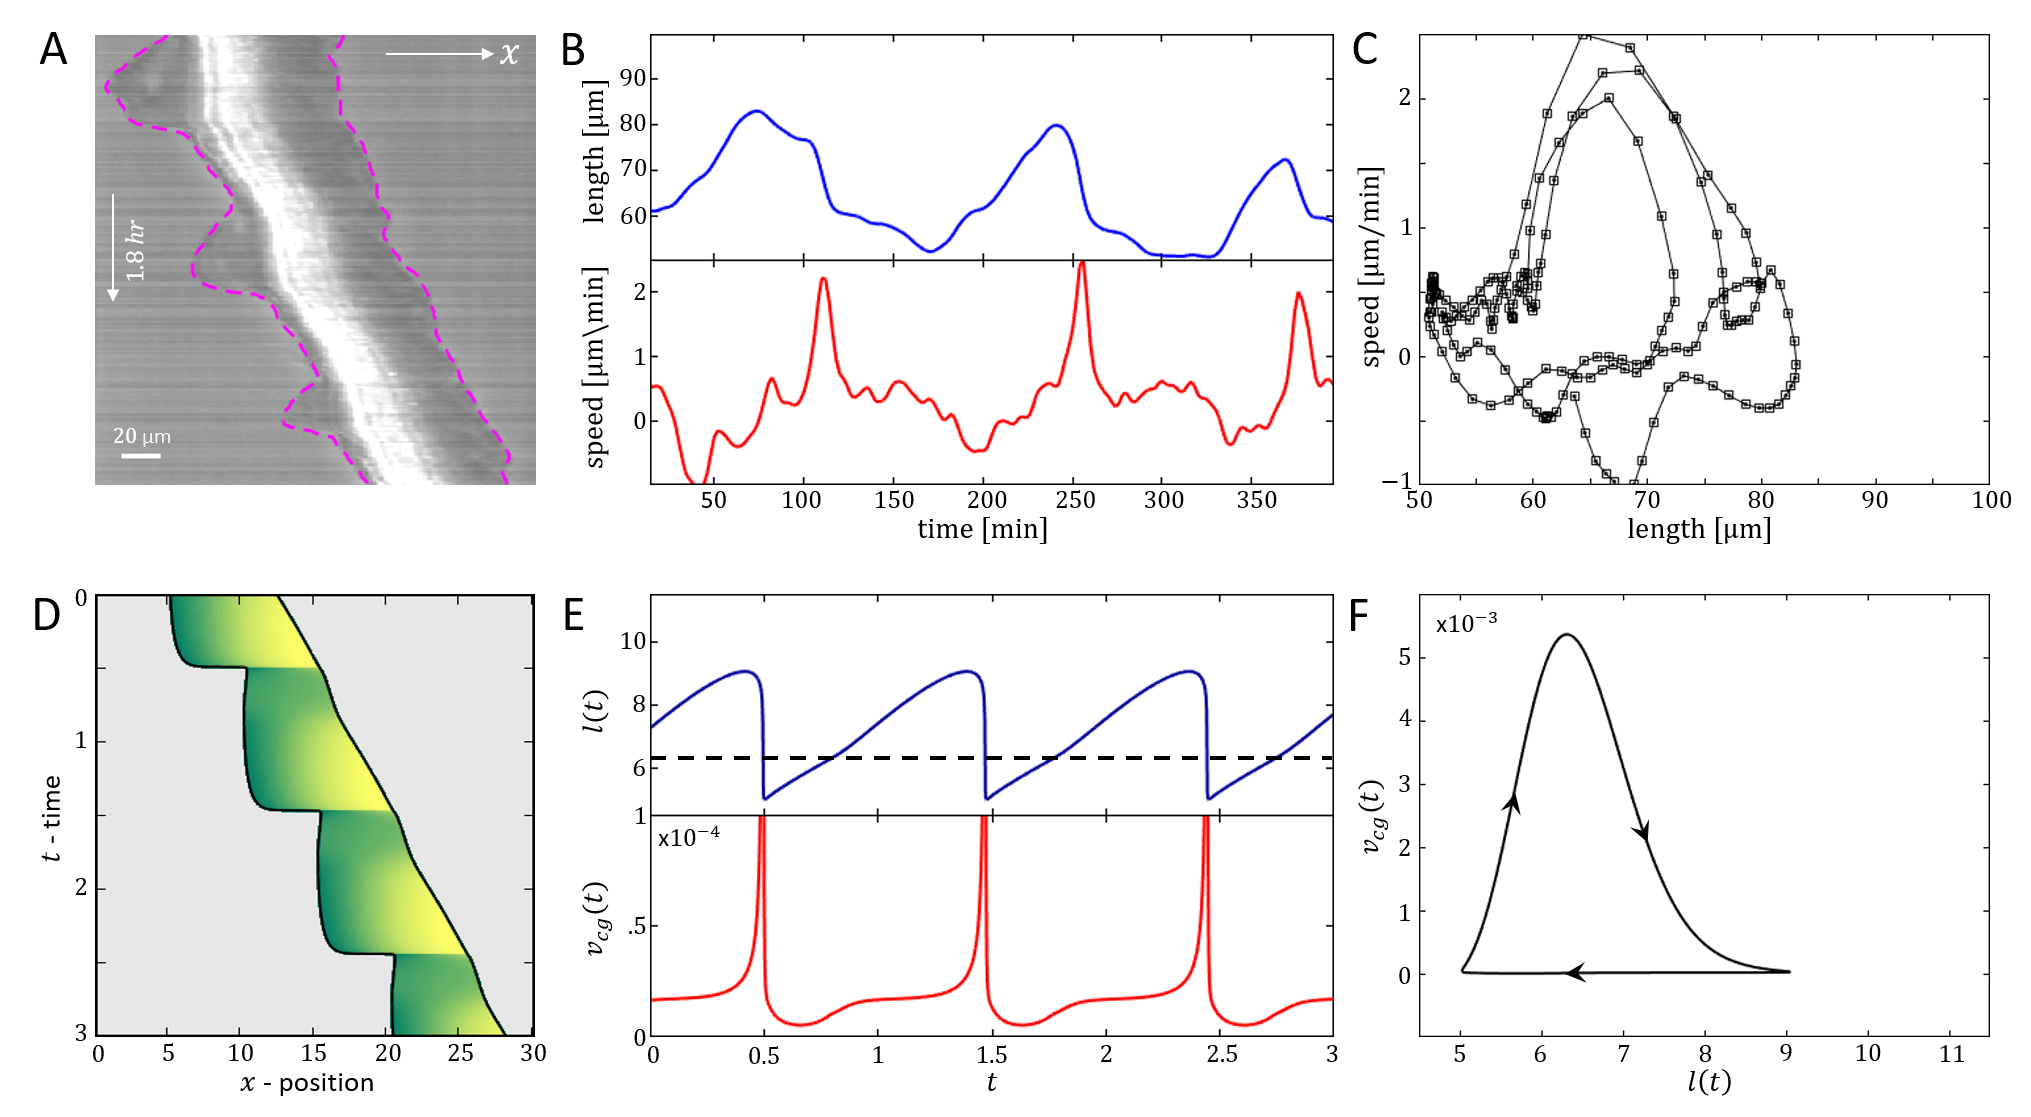
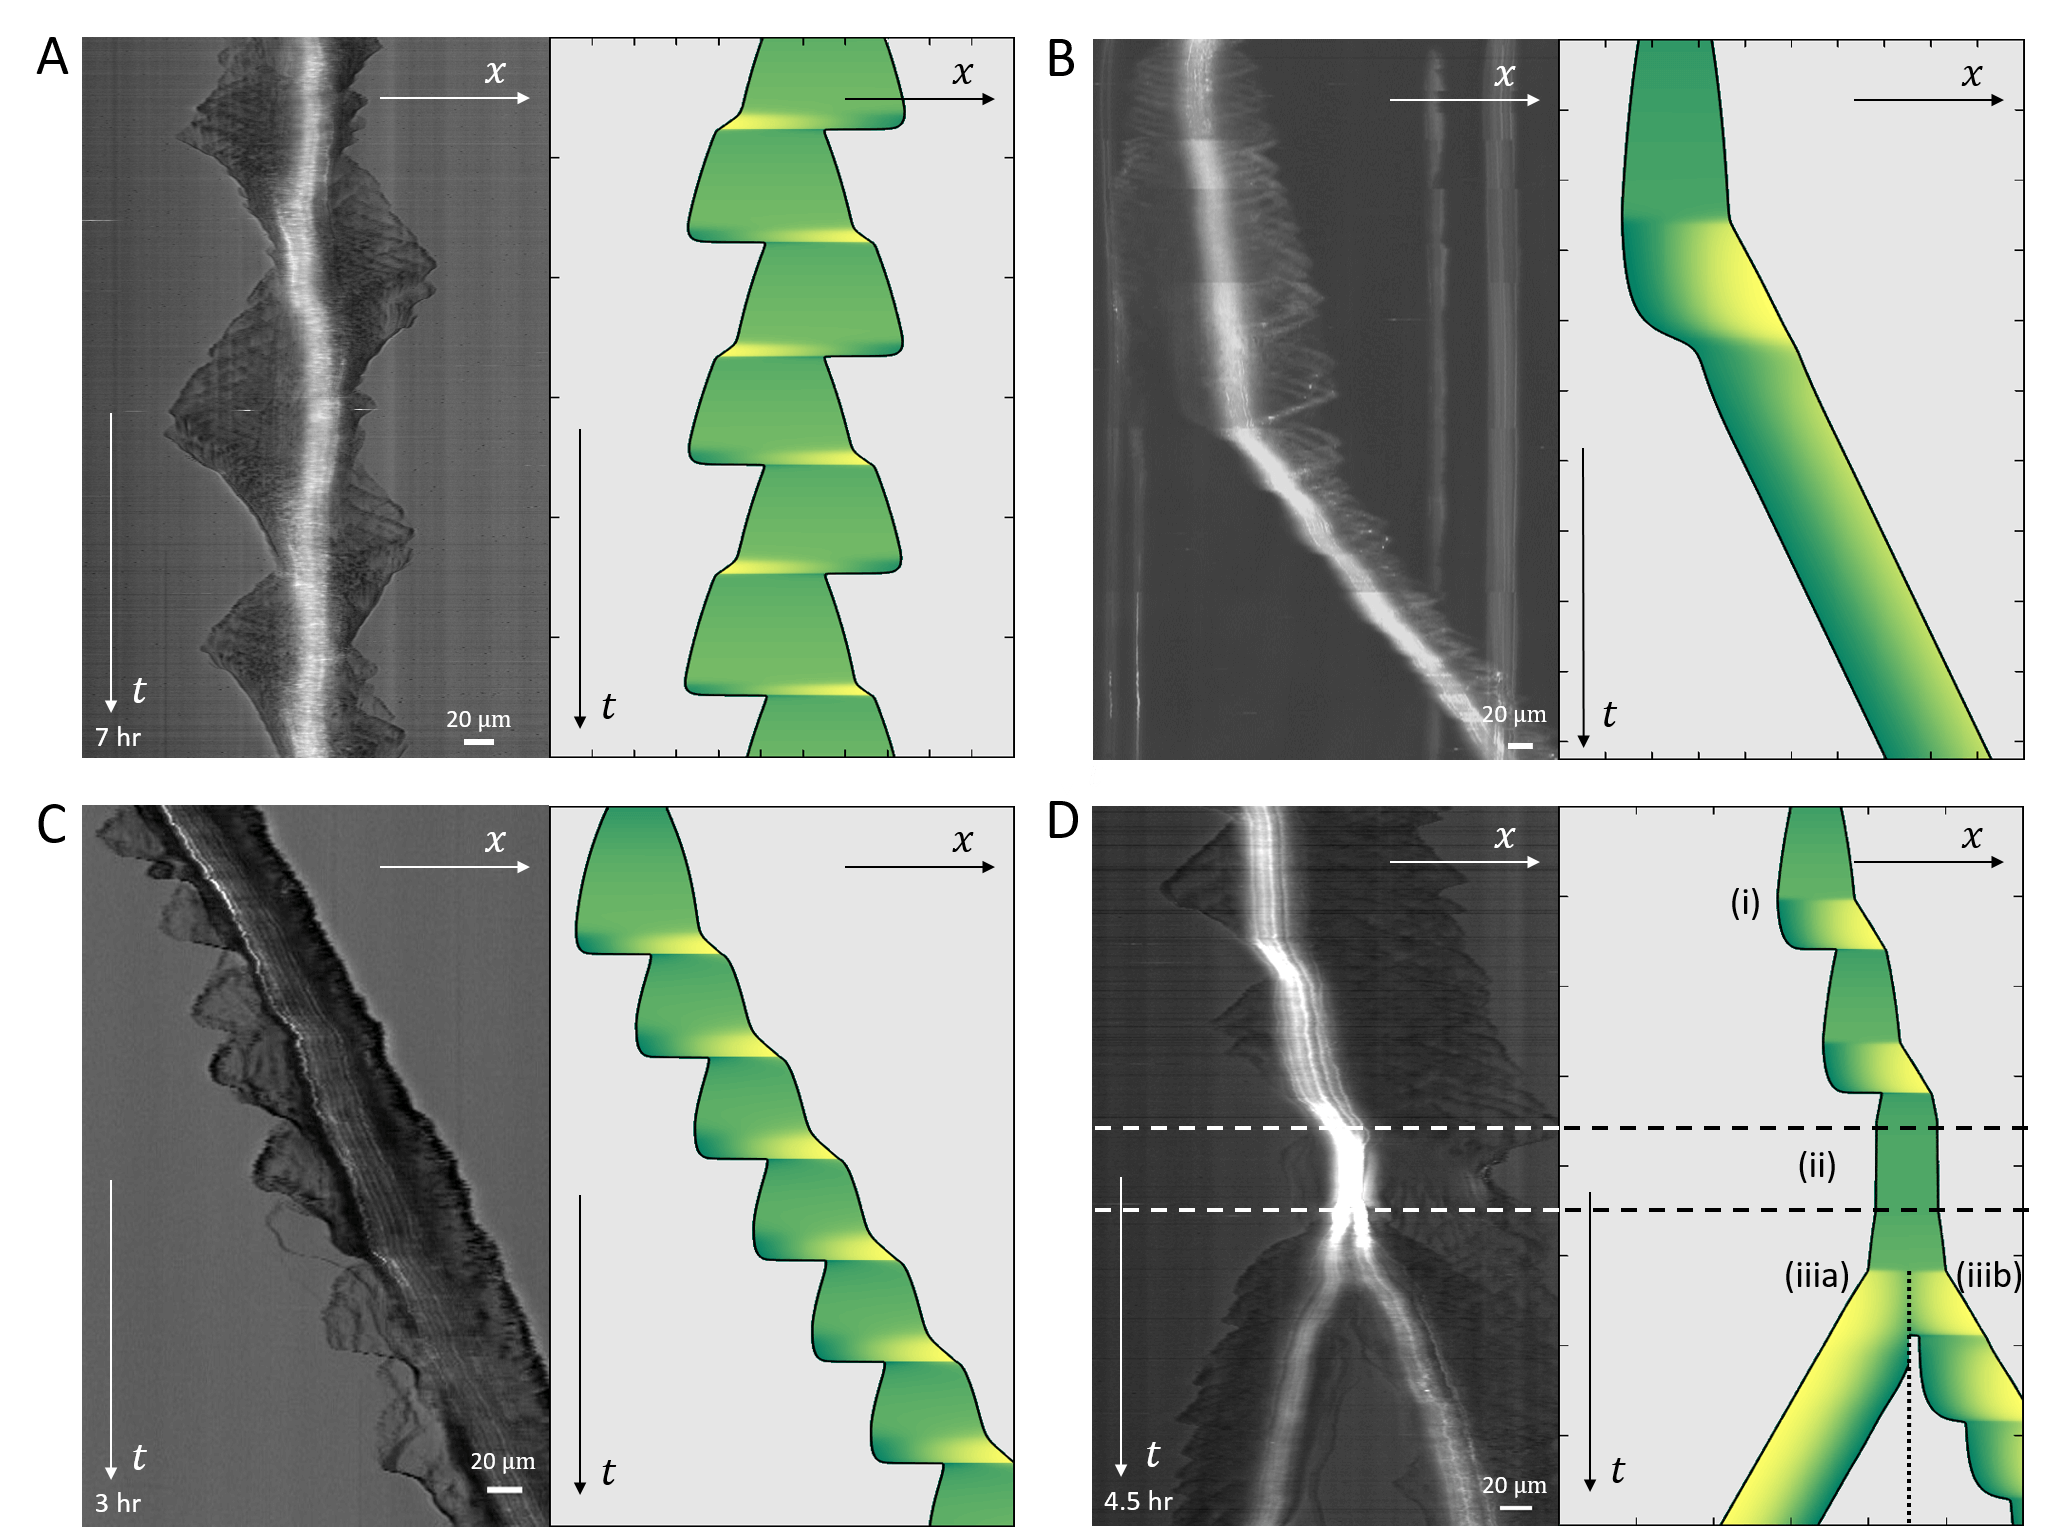
In Fig.19 we give a wide range of different cell migrations observed in experiments, demonstrating that the model can produce a similar range of cell migrations. In Fig.19A we show a cell that seems to be oscillating between being polarized to the right and to the left, such that it hardly migrates over time. In our model a similar behavior may occur if the cell is in the stick-slip regime, and following each slip event it is shorter than the critical length, allowing for noise to induce direction changes (as explained in Figs.13,14).
In Fig.19B a kymograph is shown of a cell that is initially at rest, and elongates symmetrically. At some later time it breaks the right-left symmetry and moves in a persistent manner. This behavior is well described by our model, where the rest-length of the cell is below the polarization length, but the conditions are such that and it elongates symmetrically until it reaches a length that is longer than the critical length . At a later time point we decreased the value of the surface adhesion strength , leading to a transition from long-slow to short-fast migration mode, which seems to fit this cellular behavior (similar to Fig.6).
In Fig.19C we plot a kymograph of a cell that is persistently moving on a 1D track in the stick-slip regime. During each stick-slip event the progression of the cell’s leading edge is slightly modulated, while at the back there are periodic extensions of lamellipodia that undergo large retractions. This behavior corresponds very well to the stick-slip behavior in our model.
Finally, in Fig.19D we present a kymograph of a cell that is first observed to be migrating by slow stick-slip events. At some point the cell stops and rounds up, as it enters mitosis, from which two daughter cells emerge, both migrating with similar speeds, but one seems to be moving smoothly while the other exhibits some stick-slip cycles. We demonstrate a similar chain of migration changes using our model, by modulating the parameters that determine the actin treadmilling activity () and adhesion strength ().
These comparisons serve to show that the model can describe the complex migration patterns of cells. The parameters used in the model may correspond to a unique migration mode, or correspond to regimes where different migration modes coexist. The transitions in the cell behavior from one migration mode to another may therefore correspond to the dynamics of the internal parameters of the cell. In addition, noise in the dynamical variables (such as in the actin treadmilling speed), can drive the enhanced polarization changes observed during stick-slip motion.
Conclusion
Cell motility involves a large number of cellular components, connected by a complex network of interactions. In addition, the system is noisy, which makes the analysis of cell migration a daunting task. In the present work we developed a theoretical model aimed at exposing the motility patterns of cells moving along a one-dimensional track. One dimensional motion is both simpler to analyze experimentally, and describe theoretically, as well as highly relevant to cells migrating within tissues during development and cancer progression.
We find that the coupling between the cell length and the slip-bonds of adhesion molecules, through the spring-like elasticity of the cell, provides the basic mechanism of stick-slip during cell migration. Furthermore, we show that when cells migrate and their polarization is maintained by the overall actin treadmilling flow, the cell length couples strongly to the polarization state of the cell: cells below a critical length do not polarize. While persistent smooth and stick-slip migration modes arise naturally in our model, we predict that stick-slip events may allow for noise-induced direction changes, as the cell recoils to less than the critical length at each stick-slip cycle.
The minimal model that we present recovers the rich variety of cellular migration patterns, which we then compare to experiments on migrating cancer cells (glioma). These comparisons validate the model and demonstrate how it can provide the framework for understanding the complex migration patterns exhibited by migrating cells.
Our model makes detailed predictions regarding the dependence of the cellular migration modes on the coarse-grained parameters of the model, which describe the cell’s mechanics (), actin-polymerization activity () and surface adhesion (). We predict a reentrant smooth migration regime as function of the surface adhesion, with stick-slip occurring only at the intermediate regime (Figs.2,8,10).
Despite the fact that cell motility is very noisy, our models help expose the underlying deterministic patterns of motility [26] that drive the cellular motion, which may be partially masked by noise. We show that the noise can also drive dramatic transitions between the different motility patterns, since the cell may reside close to the transition lines, or in a regime of coexistence, between such modes. These results ofer a new explanation for the large ”phenotypic heterogeneity” (CCV) that is observed in cell migration experiments, even under well controlled conditions and monoclonal cell population. These results offer a new framework to explain experimental observations of migrating cells, resulting from noisy switching between underlying deterministic migration modes. Small fluctuations in the cellular components that are greatly amplified due to shifting the cells’ internal state between coexisting migration modes, and across phase transition lines. The richness in migration modes that our model predicts for cells with identical or slightly different internal states offers a new paradigm to explain ”phenotypic heterogeneity” in cell migration.
Our results explain naturally many observations of cells that grow symmetrically, and migrate along 1D tracks. In addition, the model makes predictions that can motivate future experimental exploration. Finally, having a model for single-cell motility can serve as the basis for the description of collective cell migration [30], which goes beyond treatments of the cells as simplified self-propelled particles.
Acknowledgements.
NSG acknowledges that this work is made possible through the historic generosity of the Perlman family. NSG is the incumbent of the Lee and William Abramowitz Professorial Chair of Biophysics and this research was supported by the Israel Science Foundation (Grant No. 1459/17). NCG and PM acknowledge support by IFOM starting package, and the Italian Association for Cancer Research (AIRC), Investigator Grant (IG) 20716 to NCG.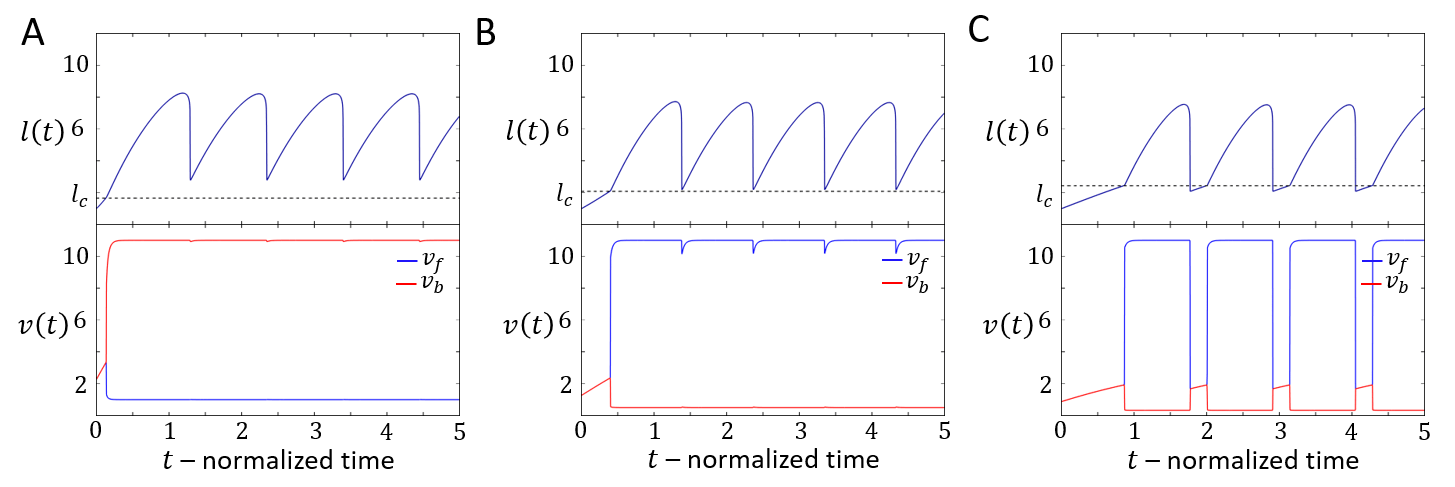
Appendix A Analysis of the stick-slip phase diagram as function of the adhesion saturation parameter .
In Eqs.1,2 the parameters and should be multiplied by a factor of , but throughout the main text (Fig.2) we treated the limit of . Here we show the effects of a finite value of . Fig. 23 demonstrates that as the value of increases the stick-slip region along the phase diagram decreases, and the cells migrate with a slower speed.
Appendix B Concentration profile of the polymerization inhibitor
Consider a generic polarity cue which follows an advection diffusion transport along the length of the cell . The polarity cue acts on both ends of the cell, and inhibits actin polymerization.
The derivation starts by dividing the cue into two populations: 1) bound cue proteins which are advected by the retrograde flow , and 2) unbound cue proteins which diffuse with a diffusion coefficient .
The bound/unbound proteins can attach/detach to/from the advected actin, with rates respectively. The total concentration of the polarity cue in the cell is considered as conserved, i.e, .
The advection-diffusion transport equations of and are given by
| (35) | |||||
At the limit of fast exchange, in which the kinetic rates , along any segment , (Eqs.35,B) reduce to
| (37) |
where .
The solution of (Eq.38) reads
| (39) |
and the coefficients are obtained by applying a no-flux boundary condition at and
| (40) |
By considering mass conservation we obtain
| (41) |
and therefore the concentration profile is given by Eq.19.
Appendix C Rescaling the velocity equation in the asymmetric self-polarized model
Appendix D Experimental methods
D.1 Cell culture
C6 rat glioma cells were obtained from ATCC and grown in High Glucose DMEM supplemented with 10 % heat inactivated FBS (HI-FBS) and glutamine (Invitrogen). Graded brain tumor specimens were obtained with informed consent, as part of a study protocol approved by the SingHealth Centralised Institutional Review Board A (Singapore). From one of those specimen, derived human glioma propagating cells NNI21 (generous gift from Carol Tang lab, National Neuroscience Institutte Singapore were isolated and cultured as described previously [31] as tumor spheres in high glucose DMEM/F12 (1:1) supplemented with sodium pyruvate, non-essential amino acid, penicillin/streptomycin, glutamine, B27 supplement (Invitrogen), bFGF (20ng/ml), EGF (20ng/ml) (PeproTech), and heparin (5µg/ml) (Sigma). For transfection and migration assays, NNI21 were cultured as monolayers on laminin (10 µg/ml) coated petri dishes for 3-5 days before transfection. HGPCs transfections were performed with a Neon electroporator (Invitrogen) as per manufacturer’s recommendations using vinculin-mCherry (gift from P. Kanchanawong, Mechanobiology Institute, National University of Singapore, Singapore) as an adhesion rapporteur and GFP-Plasma Membrane (GFP-PM, Clonetech) for plasma membrane staining.
D.2 Micropatterning
5m lines were printed on glass coverslips using deep UV photopatterning technique as directed in [32]. Briefly, 25-mm glass coverslips were plasma-treated for 5 min and incubated for 1h at room temperature (RT) with poly-l-lysine–grafted–polyethylene glycol (0.1 mg/ml, pLL-PEG, SuSoS) diluted in Hepes [10 mM (pH 7.4)]. After washing in water, the pLL-PEG–covered coverslip was placed with the polymer brush facing downward onto the chrome side of a quartz photomask for photolithography treatment (7-min ultraviolet-light exposure). Subsequently, the coverslip was removed from the mask and coated with laminin (10 g/ml) (Invitrogen) diluted in dPBS for 1h at 37C. Cells were seeded on the patterns and incubated at 37 C. Cell imaging typically started within the following hour.
D.3 Microscopy
Phase contrast of live specimens were performed on a Leica AM TIRF MC system equipped with temperature, humidity, and CO2 control. Long term imaging was done using a 10X objective (Leica HCX PL FLUOTAR 10x/0.30NA PH1 Objective). Acquisitions were typically obtained over a period varying from 2 to 12 h (1 image/30 s).
Appendix E Bifurcation analysis
The introduction of the actin dynamics in Part 2, introduces to the vector field a discontinuity at . The vector discontinuity gives rise to an additional unstable limit cycle due to a trajectory that collides with the line of (Figs.8,9). The period of the limit cycle is finite as long as the amplitude of the coordinate is limited to values: . When the coordinate amplitude grows beyond this limit, , the period of the discontinuous unstable limit cycle is infinite (Figs. 24,25,26,27).
References
- Shreiber et al. [2003] D. I. Shreiber, V. H. Barocas, and R. T. Tranquillo, Temporal variations in cell migration and traction during fibroblast-mediated gel compaction, Biophysical journal 84, 4102 (2003).
- Keren et al. [2008] K. Keren, Z. Pincus, G. M. Allen, E. L. Barnhart, G. Marriott, A. Mogilner, and J. A. Theriot, Mechanism of shape determination in motile cells, Nature 453, 475 (2008).
- Takagi et al. [2008] H. Takagi, M. J. Sato, T. Yanagida, and M. Ueda, Functional analysis of spontaneous cell movement under different physiological conditions, PloS one 3 (2008).
- Wu et al. [2014] P.-H. Wu, A. Giri, S. X. Sun, and D. Wirtz, Three-dimensional cell migration does not follow a random walk, Proceedings of the National Academy of Sciences 111, 3949 (2014).
- Kowalewski et al. [2015] J. M. Kowalewski, H. Shafqat-Abbasi, M. Jafari-Mamaghani, B. E. Ganebo, X. Gong, S. Strömblad, and J. G. Lock, Disentangling membrane dynamics and cell migration; differential influences of f-actin and cell-matrix adhesions, PloS one 10 (2015).
- Brückner et al. [2020] D. B. Brückner, A. Fink, J. O. Rädler, and C. P. Broedersz, Disentangling the behavioural variability of confined cell migration, J. R. Soc. Interface 17, 20190689 (2020).
- Petrie et al. [2009] R. J. Petrie, A. D. Doyle, and K. M. Yamada, Random versus directionally persistent cell migration, Nature reviews Molecular cell biology 10, 538 (2009).
- Miao et al. [2017] Y. Miao, S. Bhattacharya, M. Edwards, H. Cai, T. Inoue, P. A. Iglesias, and P. N. Devreotes, Altering the threshold of an excitable signal transduction network changes cell migratory modes, Nature cell biology 19, 329 (2017).
- Monzo et al. [2016] P. Monzo, Y. K. Chong, C. Guetta-Terrier, A. Krishnasamy, S. R. Sathe, E. K. Yim, W. H. Ng, B. T. Ang, C. Tang, B. Ladoux, et al., Mechanical confinement triggers glioma linear migration dependent on formin fhod3, Molecular biology of the cell 27, 1246 (2016).
- Hennig et al. [2020] K. Hennig, I. Wang, P. Moreau, L. Valon, S. DeBeco, M. Coppey, Y. Miroshnikova, C. Albiges-Rizo, C. Favard, R. Voituriez, et al., Stick-slip dynamics of cell adhesion triggers spontaneous symmetry breaking and directional migration of mesenchymal cells on one-dimensional lines, Science Advances 6, eaau5670 (2020).
- Han et al. [2013] L. Han, Z. Mao, J. Wu, Y. Guo, T. Ren, and C. Gao, Unidirectional migration of single smooth muscle cells under the synergetic effects of gradient swelling cue and parallel groove patterns, Colloids and Surfaces B: Biointerfaces 111, 1 (2013).
- Stroka et al. [2014] K. M. Stroka, H. Jiang, S.-H. Chen, Z. Tong, D. Wirtz, S. X. Sun, and K. Konstantopoulos, Water permeation drives tumor cell migration in confined microenvironments, Cell 157, 611 (2014).
- Chabaud et al. [2015] M. Chabaud, M. L. Heuzé, M. Bretou, P. Vargas, P. Maiuri, P. Solanes, M. Maurin, E. Terriac, M. Le Berre, D. Lankar, et al., Cell migration and antigen capture are antagonistic processes coupled by myosin ii in dendritic cells, Nature communications 6, 7526 (2015).
- Sheets et al. [2013] K. Sheets, S. Wunsch, C. Ng, and A. S. Nain, Shape-dependent cell migration and focal adhesion organization on suspended and aligned nanofiber scaffolds, Acta biomaterialia 9, 7169 (2013).
- Guetta-Terrier et al. [2015] C. Guetta-Terrier, P. Monzo, J. Zhu, H. Long, L. Venkatraman, Y. Zhou, P. Wang, S. Y. Chew, A. Mogilner, B. Ladoux, et al., Protrusive waves guide 3d cell migration along nanofibers, J Cell Biol 211, 683 (2015).
- Friedl and Gilmour [2009] P. Friedland D. Gilmour, Collective cell migration in morphogenesis, regeneration and cancer, Nature reviews Molecular cell biology 10, 445 (2009).
- Rakic [1990] P. Rakic, Principles of neural cell migration, Experientia 46, 882 (1990).
- Parnavelas [2000] J. G. Parnavelas, The origin and migration of cortical neurones: new vistas, Trends in neurosciences 23, 126 (2000).
- Paul et al. [2017] C. D. Paul, P. Mistriotis, and K. Konstantopoulos, Cancer cell motility: lessons from migration in confined spaces, Nature Reviews Cancer 17, 131 (2017).
- Danuser et al. [2013] G. Danuser, J. Allard, and A. Mogilner, Mathematical modeling of eukaryotic cell migration: insights beyond experiments, Annual review of cell and developmental biology 29, 501 (2013).
- [21] D. Selmeczi, L. Li, N. Pedersen, H. SF, and M. PH, S., larsen, nb, cox, ec, flyvbjerg, h., 2008, Cell motility as random motion: A review. Eur. Phys. J. Spec. Top 157, 1.
- Vestergaard et al. [2015] C. L. Vestergaard, J. N. Pedersen, K. I. Mortensen, and H. Flyvbjerg, Estimation of motility parameters from trajectory data, The European Physical Journal Special Topics 224, 1151 (2015).
- Chan and Odde [2008] C. E. Chanand D. J. Odde, Traction dynamics of filopodia on compliant substrates, Science 322, 1687 (2008).
- Sens [2013] P. Sens, Rigidity sensing by stochastic sliding friction, EPL (Europhysics Letters) 104, 38003 (2013).
- Maiuri et al. [2015] P. Maiuri, J.-F. Rupprecht, S. Wieser, V. Ruprecht, O. Bénichou, N. Carpi, M. Coppey, S. De Beco, N. Gov, C.-P. Heisenberg, et al., Actin flows mediate a universal coupling between cell speed and cell persistence, Cell 161, 374 (2015).
- Lavi et al. [2016] I. Lavi, M. Piel, A.-M. Lennon-Duménil, R. Voituriez, and N. S. Gov, Deterministic patterns in cell motility, Nature Physics 12, 1146 (2016).
- Tsai et al. [2019] T. Y.-C. Tsai, S. R. Collins, C. K. Chan, A. Hadjitheodorou, P.-Y. Lam, S. S. Lou, H. W. Yang, J. Jorgensen, F. Ellett, D. Irimia, et al., Efficient front-rear coupling in neutrophil chemotaxis by dynamic myosin ii localization, Developmental cell 49, 189 (2019).
- Dang et al. [2013] I. Dang, R. Gorelik, C. Sousa-Blin, E. Derivery, C. Guérin, J. Linkner, M. Nemethova, J. G. Dumortier, F. A. Giger, T. A. Chipysheva, et al., Inhibitory signalling to the arp2/3 complex steers cell migration, Nature 503, 281 (2013).
- Putelat et al. [2018] T. Putelat, P. Recho, and L. Truskinovsky, Mechanical stress as a regulator of cell motility, Physical Review E 97, 012410 (2018).
- Jain et al. [2019] S. Jain, V. M. Cachoux, G. H. Narayana, S. de Beco, J. D’Alessandro, V. Cellerin, T. Chen, M. L. Heuzé, P. Marcq, R.-M. Mège, et al., Emergence of single cell mechanical behavior and polarity within epithelial monolayers drives collective cell migration, bioRxiv (2019).
- Chong et al. [2009] Y.-K. Chong, T.-B. Toh, N. Zaiden, A. Poonepalli, S. H. Leong, C. E. L. Ong, Y. Yu, P. B. Tan, S.-J. See, W.-H. Ng, et al., Cryopreservation of neurospheres derived from human glioblastoma multiforme, Stem cells 27, 29 (2009).
- Azioune et al. [2010] A. Azioune, N. Carpi, Q. Tseng, M. Thery, and M. Piel, Protein micropatterns: A direct printing protocol using deep uvs, in Methods in cell biology, Vol. 97 (Elsevier, 2010) pp. 133–146.