On the Scarcity of Dense Cores ( cm-3) in High-latitude Planck Galactic Cold Clumps
Abstract
High-latitude () molecular clouds have virial parameters that exceed 1, but whether these clouds can form stars has not been studied systematically. Using JCMT SCUBA-2 archival data, we surveyed 70 fields that target high-latitude Planck Galactic cold clumps (HLPCs) to find dense cores with density of – cm-3 and size of pc. The sample benefits from both the representativeness of the parent sample and its coverage of the densest clumps at the high column density end ( cm-2). At an average rms of 15 , we detected Galactic dense cores in only one field, G6.04+36.77 (L183) while also identifying 12 extragalactic objects and two young stellar objects. Compared to the low-latitude clumps, dense cores are scarce in HLPCs. With synthetic observations, the densities of cores are constrained to be cm-3 should they exist in HLPCs. Low-latitude clumps, Taurus clumps, and HLPCs form a sequence where a higher virial parameter corresponds to a lower dense-core detection rate. If HLPCs were affected by the Local Bubble, the scarcity should favor turbulence-inhibited rather than supernova-driven star formation. Studies of the formation mechanism of the L183 molecular cloud are warranted.
=50
=50
1 Introduction
The high latitude (HL) of the Milky Way, also called the “underwater iceberg” guards its secrets about molecular gas and star formation, due in part to the limited scope of previous CO surveys (Xu et al., 2021). Observational challenges essentially originate from the large area of the HL, leading to much longer integration times compared to those required for blind surveys of the Galactic plane. The Planck satellite provides an unprecedented all-sky census of the coldest (6–20 K with a median value of 14 K; Planck Collaboration et al., 2011a) Galactic objects by combining the highest-frequency channels of the Planck survey 353–857 GHz (i.e., 850–350 m) with the far-infrared IRAS 100 m data (Neugebauer et al., 1984; Miville-Deschênes & Lagache, 2005). As a result, the Planck team has cataloged 13,188 Planck Galactic Cold Clumps (PGCCs; Planck Collaboration et al., 2016), including 793 with absolute value of Galactic latitude higher than 30∘, a group we refer to as high-latitude Planck cold clumps (HLPCs). Benefiting from the unbiased nature of its parent sample, the 793 HLPCs are the least-biased sample of HL cold dust clumps, therefore serving as a foundation for studying the properties of the HL molecular gas and investigating the initial condition of star formation (Wu et al., 2012; Liu et al., 2013).
Our previous work performed a 12CO/13CO/C18O (1-0) survey toward 41 early cold cores (ECCs; i.e., most reliable detections of PGCCs with signal-to-noise ratio ; Planck Collaboration et al., 2011b) with the Purple Mountain Observatory (PMO) 13.7 m millimeter-wavelength telescope (Xu et al., 2021). Although detected CO cores have a typical density of several times cm-3, consistent with what has been found in nearby molecular cloud cores (Benson & Myers, 1983; Myers et al., 1983; Myers & Benson, 1983; Myers, 1983; Benson & Myers, 1989), the turbulent energy is significantly higher than the gravitational energy, with median virial parameters of (Xu et al., 2021). Therefore, our CO surveys unveiled a highly turbulent, diffuse molecular gas environment as a first glimpse of the initial conditions of star formation in the HL clouds.
Stars form in dense cores (Shu et al., 1987) with a typical size of pc and density of – cm-3 (Ward-Thompson et al., 1994, 1999; Kirk et al., 2005). The CO (1-0) transitions suffer from optical thickness and depletion at low temperature, so it is hard to probe the densest regions of molecular clouds. For example, a high-latitude cloud L1780 shows a cometary morphology and a CO core (Toth et al., 1995) but contains no dense core in our survey (field G358.96+36.81). Furthermore, the angular resolution of Planck used for the extraction of PGCCs is ′, corresponding to 0.3 pc at a typical distance of HL clouds of 200 pc (Xu et al., 2021), which is marginal for resolving dense cores. Working at 850 m with an effective beam FWHM of 146, Submillimetre Common-User Bolometer Array 2 (SCUBA-2; Dempsey et al., 2013) provides times better resolution than the Planck, pinpointing cold dense cores inside the molecular clouds.
In this Letter, we perform a systematic search for dense cores within 70 HLPCs using the latest JCMT SCUBA-2 archival data. The sample selection and distance estimation are summarized in Section 2. As shown in Section 3, dense cores are only identified in one HLPC (G6.04+36.77). In Section 4, we show the robustness of the scarcity of Galactic dense cores in HLPCs, investigate the upper limit of the dense core density, and then discuss star formation picture at high latitude. Finally, we give a brief summary in Section 5.
2 Data
2.1 Sample Selection
A thorough search of the SCUBA-2 850 m data in the JCMT Science Archive111https://www.cadc-ccda.hia-iha.nrc-cnrc.gc.ca/en/jcmt/, and crossmatching with 793 HLPCs that satisfy the latitude criterion of , gave 138 observing fields in total. We dismiss six of the fields that have limited integration time or nonstandard scan modes. Different scan patterns include constant velocity daisy patterns (CV Daisy) and rotating curvy pong patterns (Curvy Pong), so the field offsets vary significantly between different patterns. We make sure that the observing fields cover the peak of PGCCs at 353 GHz. We also check superposition or repetition: if two fields cover the same PGCC, we choose the one with the higher sensitivity. After the work flow, a total of 70 SCUBA-2 fields are selected as the sample in this work.
2.2 Sample Properties
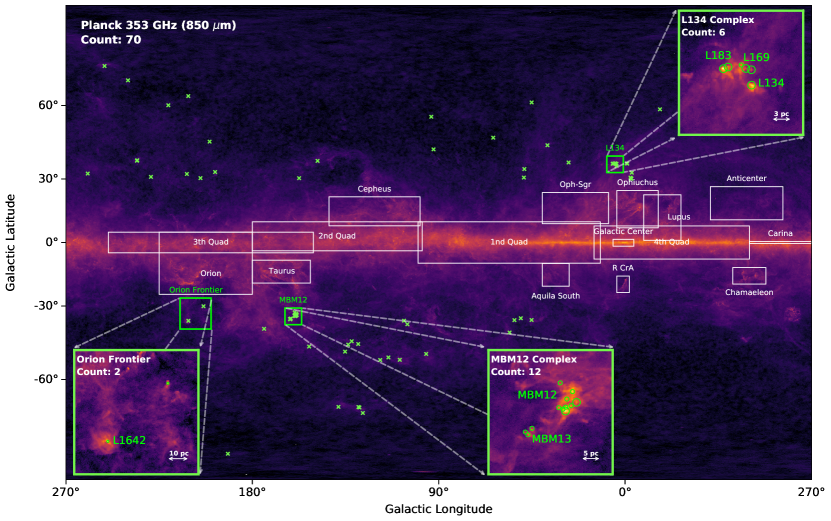
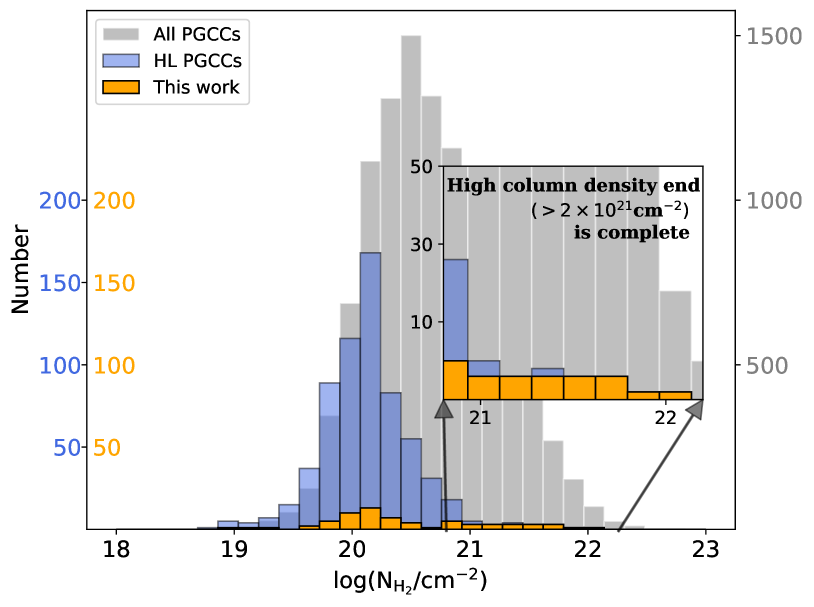
Seventy HLPCs are shown with green crosses, overlaid on the background Planck 353 GHz (850 m) continuum emission in Figure 1. White rectangles outline the CO emission regions defined by Dame et al. (1987). The clump-averaged H2 column density was calculated assuming a dust-emissivity model at 857 GHz (Planck Collaboration et al., 2016). The distributions of three samples–all the PGCCs, 793 high-latitude PGCCs, and 70 HLPCs–are plotted as gray, blue and orange histograms in Figure 2, respectively. 70 HLPCs has been evenly sampled in the space, ensuring a similar distribution with its parent sample, 793 HL PGCCs. More importantly, the studied sample includes the densest clumps at the high-column-density end ( cm-2). Considering that the denser clumps should be more likely to produce dense cores, we have covered the complete HLPCs where dense cores could form.
Three regions with relatively higher column density, namely the Orion Frontier, the MBM 12 Complex, and the L134 Complex, are further zoomed in with subpanels in Figure 1. The HLPCs therein correspond to those at the high-density end as mentioned above. The Orion Frontier contains the dark cloud L1642, which together with the MBM 12 Complex are two famous HL clouds that have confirmed star-forming activity (Malinen et al., 2014). The L134 Complex is another region containing several HLPCs, including the widely studied dark cloud L183 (Lee & Myers, 1999; Lee et al., 2001; Juvela et al., 2002; Pagani et al., 2003).
2.3 Distance Estimation
Distance is always a difficult quantity to estimate in astronomy. Previous studies have estimated the distances of HL molecular clouds to be 100 pc from the velocity dispersion and the scale height of an ensemble of clouds (Blitz et al., 1984; Magnani et al., 1985). The star counting confirms that the HL molecular clouds are indeed nearby objects with upper limit ranges from 125 to 275 pc (Magnani & de Vries, 1986). Using Strömgren photometry, Franco (1989) derive the distances of several HGaL clouds to be 100–230 pc. Both the small and the lack of a double-sine wave signature in the distribution on the (Galactic longitude ) plane demonstrate that HL molecular gas belongs to the local interstellar medium (ISM) and is too close to the Sun for Galactic rotation to modulate the velocities (Magnani et al., 1996).
Recently, the Gaia satellite has provided new photometric measurements toward galactic stars (Gaia Collaboration et al., 2016). Together with 2MASS and Pan-STARRS 1 optical and near-infrared photometry, Gaia DR2 parallaxes can help to infer distances and reddenings of 800 million stars. These stars trace the reddening on a small patch of the sky, along different lines of sight and different distance intervals, allowing us to build a 3D dust-reddening map (Green et al., 2014, 2019). In a given direction, a jump of dust reddening is expected at a distance where there is a dust clump. Distances are estimated by this method and are listed in column (9) of Table A1, with an average value of pc, indicating that HLPCs are mostly local ISM. Adopting Eq. 1 in Xu et al. (2021) and considering that the Sun is 10 pc above the Galactic midplane (Griv et al., 2021), the altitude from the midplane (in units of parsecs) is calculated from where is the distance and is the latitude, and listed in column (10). We note that some fields may contain extragalactic objects, so the distance should be only for foreground Galactic dust.
3 Results
3.1 Source Extraction
We adopt the dendrogram algorithm (Rosolowsky et al., 2008) to extract dense structures and then measure their integrated flux, peak flux, size, and position by 2D Gaussian fitting. The details of the algorithm parameter settings and the source extraction procedure are introduced in Appendix B. Within the 70 input fields, we have initially detected a total of 20 sources that belong to 15 SCUBA-2 observing fields. The field names and extracted sources are listed in columns (1)–(2) of Table 1. Central coordinates, standard deviation of the deconvolved major and minor axes, integrated flux, and peak intensity are listed in columns (3)–(7).
3.2 Source Identification and Dense Core Definition
The CV Daisy mode of observation can produce artifacts (Liu et al., 2018; Eden et al., 2019) that are extracted by the algorithm as false source detections. Therefore, we additionally require that both the peak intensity after being smoothed to the Planck beam and the total flux of the source at 353 GHz, are lower than those of the parent PGCC. This results in two sources, G50.41-35.40 SMM1 and G197.98+33.10 SMM1, being classified as artifacts and excluded from further analyses. We note that the flux given by the PGCC catalog should be from the cold residual map (Planck Collaboration et al., 2016), so the original Planck flux at 353 GHz could be even larger. However, considering the cold nature of dense cores, this should contribute little to the warm component.
We crossmatch the true detections within 1′ using SIMBAD222http://simbad.u-strasbg.fr/simbad/. We find that only one field, G6.04+36.77, pointing toward the molecular cloud L183, contains three resolved (or marginally resolved) sources, which were previously identified as low-mass prestellar cores (Dickens et al., 2000; Pagani et al., 2003). Our other detections are unresolved as point sources, classified as either young stellar object (YSO) or extragalactic object (point sources) – including gravitational lensed galaxy (LeG), BL Lacertae object (BLL), protocluster of galaxies (PClG), active nuclei candidate (AGN), and quasar (QSO). The determined identifiers and references are given in columns (8) and (9) of Table 1.
4 Discussion
4.1 Dense Cores Are Scarce In HLPCs
Having only one detection among the 70 HLPCs highlights the scarcity of dense cores at these latitudes. To further confirm this discrepancy compared to the low-latitude () counterpart, 1235 observing fields from the JCMT Large Project “SCUBA-2 Continuum Observations of Pre-protostellar Evolution” (SCOPE; Liu et al., 2018; Eden et al., 2019) are used as a comparison group because of the following two reasons: (1) twenty-one HLPC fields in this work come from the SCOPE project so that they have been observed with comparable sensitivities; (2) the SCOPE observations serve as a representative sample of PGCCs, with similar distributions in distance, size, and temperature, and with complete column density coverage over cm-2 (Liu et al., 2018).
Considering the beam dilution effects for marginally resolved sources, the column densities are corrected by a beam filling factor where is the Planck beam size at 857 GHz (Planck Collaboration et al., 2016) and is the intrinsic size deconvolved from the beam. For extended sources of which intrinsic size exceeds the beam size, is set to 1, and no correction is performed. As a result, the corrected column density increases by a factor of 1.1 on average and 9 at maximum.
In Figure 3, we present the number distributions of different samples across a set of bins, denoted as where indicates bin index. Specifically, the distributions for the low-latitude SCOPE fields and the HLPC fields are depicted using the gray and blue histograms, respectively. We also collect the number distribution of those fields with dense cores detected . The dense core detection rate (DCDR), defined as , is shown with connected data points. For the low-latitude SCOPE, the DCDR experiences a pronounced increase at a threshold of column density around cm-2, reaching 90% at the cm-2 regime. The column density threshold for forming dense cores is consistent with what has been found in Gould Belt clouds (e.g., Johnstone et al., 2004). The sudden peak at cm-2 likely results from the limited sample size. In contrast to the DCDR of the low-latitude SCOPE clumps, the DCDR for the HLPCs remains zero for cm-2, until dense cores in the HLPC G6.04+36.77 are detected.
The SCOPE serve as a gauge to tell whether the HLPCs have significantly scarce dense cores. Given the null hypothesis that the HLPCs share a DCDR greater or equal to that of the SCOPE, the number of the HLPC fields containing dense cores in each bin of cm-2 can be predicted, as . The one-sided Mann–Whitney U test (Mann & Whitney, 1947) is performed between the and , giving a p-value of . This is , thus robustly excluding the null hypothesis. In other words, dense cores are scarce in HLPCs compared to the low latitude.
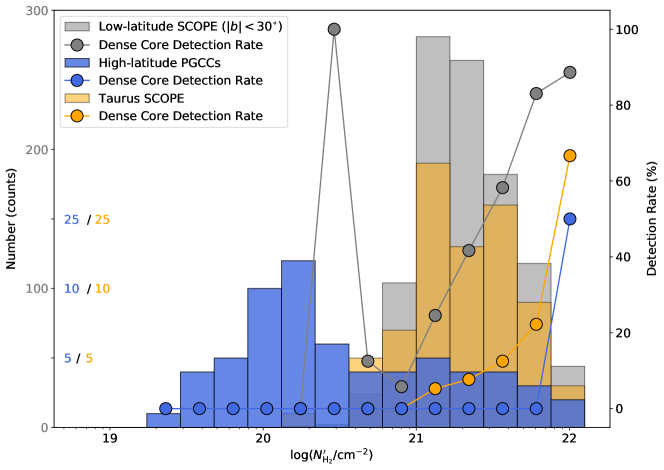
for low-latitude SCOPE fields (gray), the HLPC fields (blue) and Taurus SCOPE fields (orange), respectively. The connected data points in corresponding colors depict the DCDR in various bins.
4.2 What Does “Dense” Mean?
The scarcity of detection does not necessarily indicate the scarcity of dense cores, primarily due to two factors: (1) the limited sensitivity of identifying sources and (2) the absence of large-scale flux in the SCUBA-2 data processing. Therefore, to understand what the scarcity of dense cores means, it is essential to clarify what “dense” means.
Prestellar cores are observed to have flat inner-density gradients that approach beyond a few thousand astronomical units (Ward-Thompson et al., 1994, 1999; Kirk et al., 2005), which can be reproduced by a nonmagnetic and Plummer-like model (Whitworth & Ward-Thompson, 2001) as
| (1) |
where is the central H2 number density and is the flat inner radius. The column density profile of such a model core has the analytical form of
| (2) |
where is the distance from core center in the plane of the sky (Dapp & Basu, 2009) and pc au defines the boundary of core.
Using the combined ammonia data from the Green Bank Telescope and Karl G. Jansky Very Large Array, the temperatures of the three prestellar cores are observed to have a minor decrease toward the center of the core au (Lin et al., 2023). Therefore, we consider a constant temperature profile as K in the following discussion.
Assuming optically thin dust emission, the column density can be used to synthesize model intensity as,
| (3) |
where measures the solid angle (in unit of radian) per JCMT beam (with FWHM of ), is the molecular weight per hydrogen molecule (Evans et al., 2022), is the mass of a hydrogen atom, cm2 g-1 (Beckwith et al., 1990) is the dust opacity at frequency of GHz ( m), is the Planck function at a given dust temperature , and is the gas-to-dust mass ratio.
Now we synthesize the SCUBA-2 image by adding a high-frequency filter , where corresponds to in the frequency space (Mairs et al., 2015),
| (4) |
where is the synthetic model in the Fourier frequency space. As a result, the synthetic observed intensity can simulate the observed large-scale missing flux at the SCUBA-2 data processing.
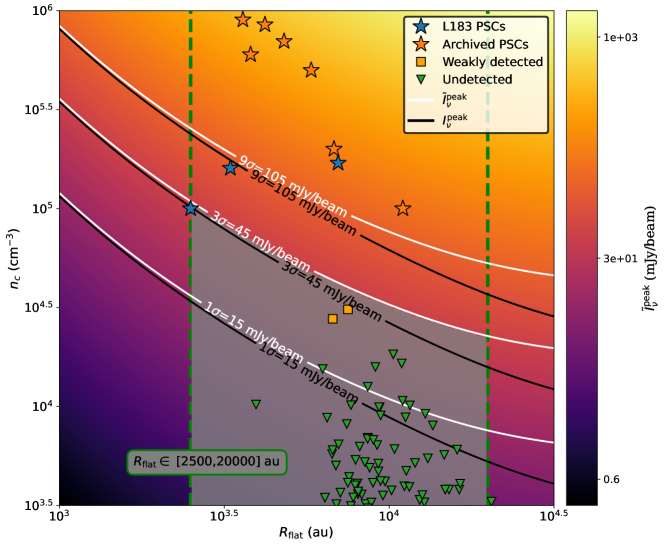
In Figure 4, the background color map shows observed peak intensities across the 2D parameter space of flat radius au and central density cm-3. The prestellar cores have been reported to have au (Ward-Thompson et al., 1999; Kirk et al., 2005), which are delineated by the left green dashed line in Figure 4. The right green dashed line marks 20,000 au, which corresponds to 0.1 pc.
Consistent with the criteria in the source extraction algorithm (see Appendix B), a threshold of is adopted to constrain the upper limit of . As a result, the gray shaded region traces the permissible parameter interval for an undetected core in our observations. In other words, if such cores exist, they should have cm-3, which is considerably less dense than those that have been identified in nearby low-mass cloud cores (Ward-Thompson et al., 1999; Kirk et al., 2005).
To further demonstrate this upper limit of density, we smooth the images to a resolution of 20″. With better sensitivity, two new cores (on in HLPC G159.41-34.37 and one in G161.87-35.76) are identified by the same algorithm and parameter input, which are called weakly detected cores. They have radii of about 6700 and 7500 au and averaged density of cm-3 and cm-3, respectively. The two cores are labeled as orange rectangles in Figure 4. We also retrieve Herschel cold cores in L134 (HLPCs G4.13+35.75 and G4.17+36.67 in our survey), MBM12 (G159.21-34.28, G158.51-33.99, G159.14-33.79, G159.23-34.51, G159.41-34.37, G159.66-34.31), L1642 (G210.90-36.55), and LDN1780 (G358.96+36.81, G359.21+36.89) from Montillaud et al. (2015) which are labeled as green triangles. As they all lie in the gray region which is below the sensitivity limit, these cold cores are not dense enough for detection and are consistently below the density limit of cm-3. As noted by Ward-Thompson et al. (2016), SCUBA-2 selects the densest cores from a population at a given temperature, which makes SCUBA-2 ideal for identifying those cores in Herschel catalogs that are closest to forming stars. So it is of great interest to study how these low-density cores form and whether they can still form stars or are transient objects.
As indicated by the black curves, peak intensity of a synthetic model is always below the corresponding outlined by white curves. The difference reflects the missing large-scale flux, which increases in importance from 0.06 to 0.31 dex with from 2500 to 20,000 au. Therefore, if we do not consider missing flux, the density limit can be even lower, especially for those cores with larger flat radius.
4.3 Star Formation at High Galactic Latitude
Low density and high virial parameter lead to a challenge for direct gravitational collapse and then star formation of HL clouds. Observationally, it is consistent with infrared cirrus which is thought to be hostile to star formation (Low et al., 1984) and the dispersed populations of pre-main-sequence stars (see review by McGehee, 2008). Recently, a clear decreasing trend of N2H+ (1–0) and C2H (1–0) detection rates with latitude is found by Xu et al. (2021). Besides, HCN (1–0) and HCO+ (1–0) line survey by Braine et al. (2023) reveals that HL molecular clouds have lower dense gas fractions compared to those in the Galactic plane. Theoretically, based on Jeans mass arguments, these low-density turbulent clouds have molecular gas mass lower than the turbulent Jeans mass (see Table 5 in Xu et al., 2021), therefore unable to fragment into dense dust cores, or protostellar embryos, which agrees with the scarcity of dense cores observed by SCUBA-2.
Previous studies have reported that the virial parameters of the PGCCs in the Taurus region (Taurus clumps hereafter) are predominantly greater than 1, with a median value of approximately 9 (Meng et al., 2013). This value is considerably lower than the median virial parameter of HLPCs, which stands at about 35. The Taurus clumps covered by the SCOPE project are designated as the Taurus SCOPE subsample. Figure 3 displays the number distribution and the DCDR for the Taurus SCOPE in orange. In the same way as above, the Mann-Whitney U test gives a -value of , thus favoring that the DCDR of the Taurus clumps is statistically larger than that of HLPCs. Interestingly, the Taurus clumps also exhibit a significantly smaller DCDR compared to the low-latitude SCOPE clumps, as evidenced by a Mann-Whitney U test p-value of . This indicates that dense cores within the Taurus clumps are relatively rarer compared to other SCOPE clumps. Consequently, the Taurus clumps occupy an intermediate position between the HLPCs and low-latitude SCOPE clumps in terms of DCDR and virial parameter. The observed trend of decreasing DCDR with increasing virial parameter further substantiates the link between core formation efficiency and the dynamic state of the gas, as previously suggested (Eden et al., 2019).
HLPCs have a distance of 200 pc which is highly consistent with the radius of the Local Bubble (LB) created by supernovae (Zucker et al., 2022). The LB is reported to expand and sweep up the ambient interstellar medium into a shell that has now fragmented and collapsed into the most prominent nearby molecular clouds. Interestingly, Zucker et al. (2022) also found that the Taurus star formation region is very likely being compressed by two super bubbles: the local super bubble and the smaller Per-Tau super bubble. If so, it is probable that the formation of dense cores can be hindered by supernova shocks in the solar neighborhood. If the HLPCs and the Taurus clumps were on the shell of LB, the scarcity of dense cores should favor turbulence-inhibited rather than supernova-driven star formation.
On the other hand, the scarcity itself is what gives the only detection (L183) in our survey, as well as a few other clouds (such as MBM 12 and 20), unique status. The capacity of these high-latitude clouds to form cold molecular cores and young stars could arise from a confluence of conditions including variations in the interstellar radiation field, changes in dust grain size and chemistry, the occurrence of shocks, and transient events in the ISM (McGehee, 2008). Consequently, in-depth explorations of the physical and chemical processes within these high-latitude dense cores, for example the L183 dense cores, are merited.
5 Conclusion
We performed a JCMT SCUBA-2 archival investigation of 70 fields toward HLPCs to search for dense cores. The sample benefits from being representative of the total HLPC population at low column density ( cm-2) and covering the densest clumps at the high column density end ( cm-2). Using dust reddening in 3D map, the distances of the HLPCs are estimated to be 110–410 pc with a mean value of 200(60) pc. A total of 17 SCUBA-2 sources are identified from a mean noise rms of 15 . Only one field G6.04+36.77 (L183) contains three dense Galactic cores. The other 14 unresolved sources include 12 extragalactic objects and two Galactic YSOs.
Compared to the low-latitude SCOPE clumps and the Taurus clumps (at a similar distance to HLPCs), the DCDR of HLPCs is significantly lower at the high column density end ( cm-2). Statistical tests verify the scarcity of dense cores in HLPCs. With synthetic observations of known dense cores, the central density of any undetected dense cores is constrained to be cm-3, should they exist in HLPCs. The observed scarcity of dense cores aligns with the low-density turbulent environment in HLPCs, as proposed in previous far-infrared and CO line surveys. If the HLPCs and the Taurus clumps were on the shell of the Local Bubble, the scarcity of dense cores should favor turbulence-inhibited rather than supernova-driven star formation. Furthermore, the scarcity also calls for further study on the formation mechanism of L183 dense cores.
Acknowledgment
This work has been supported by the National Key R&D Program of China (No. 2022YFA1603102, 2019YFA0405100), the National Science Foundation of China (12033005, 11973013), and the China Manned Space Project (CMS-CSST-2021-A09, CMS-CSST-2021-B06), and the China-Chile Joint Research Fund (CCJRF No. 2211). CCJRF is provided by Chinese Academy of Sciences South America Center for Astronomy (CASSACA) and established by National Astronomical Observatories, Chinese Academy of Sciences (NAOC) and Chilean Astronomy Society (SOCHIAS) to support China-Chile collaborations in astronomy. T.L. acknowledges the support by the international partnership program of Chinese academy of sciences through grant No.114231KYSB20200009, and Shanghai Pujiang Program 20PJ1415500. This research was carried out in part at the Jet Propulsion Laboratory, which is operated by the California Institute of Technology under a contract with the National Aeronautics and Space Administration (80NM0018D0004). This work is sponsored (in part) by the Chinese Academy of Sciences (CAS), through a grant to the CAS South America Center for Astronomy (CASSACA) in Santiago, Chile. D.J. is supported by NRC Canada and by an NSERC Discovery grant. G.G. acknowledges support from the ANID BASAL project FB210003. E.F. acknowledges support from the European Council, under the European Community’s Seventh framework Programme, through the Advance Grant MIST (FP7/2017-2024, No. 742719). P.S. was partially supported by a Grant-in-Aid for Scientific Research (KAKENHI Number JP22H01271 and JP23H01221) of JSPS. C.W.L. is supported by the Basic Science Research Program through the National Research Foundation of Korea (NRF) funded by the Ministry of Education, Science and Technology (NRF-2019R1A2C1010851), and by the Korea Astronomy and Space Science Institute grant funded by the Korea government (MSIT) (Project No. 2023-1-84000). G.J.W. gratefully acknowledges receipt of an Emeritus Fellowship from The Leverhulme Trust. M.J. acknowledges support from the Research Council of Finland grant 348342. The work of M.G.R. is supported by NOIRLab, which is managed by the Association of Universities for Research in Astronomy (AURA) under a cooperative agreement with the National Science Foundation. N.H. acknowledges support from the Nation Science and Technology Council (NSTC) of Taiwan with grant NSTC 111-2112-M-001-060.SPL acknowledges the Ministry of Science and Technology of Taiwan for grant 112-2112-M-007 -011. This research used the facilities of the Canadian Astronomy Data Centre operated by the National Research Council of Canada with the support of the Canadian Space Agency. The James Clerk Maxwell Telescope is operated by the East Asian Observatory on behalf of The National Astronomical Observatory of Japan; Academia Sinica Institute of Astronomy and Astrophysics; the Korea Astronomy and Space Science Institute; the National Astronomical Research Institute of Thailand; Center for Astronomical Mega-Science (as well as the National Key R&D Program of China with No. 2017YFA0402700). Additional funding support is provided by the Science and Technology Facilities Council of the United Kingdom and participating universities and organizations in the United Kingdom and Canada. Additional funds for the construction of SCUBA-2 were provided by the Canada Foundation for Innovation.
| Field | Source | RA | DEC | Identifier[refs]a | Classb | |||
|---|---|---|---|---|---|---|---|---|
| deg | deg | arcsec2 | ||||||
| G6.04+36.77 | SMM1 | 238.5361 | -2.8732 | 34.217.2 | 3.36 | 218.4 | \addstackgap[0pt]\Centerstack[c]Position C[1] Region 3[2] | PSC |
| SMM2 | 238.5025 | -2.8786 | 10.27.4 | 0.13 | 57.4 | \addstackgap[0pt]\Centerstack[c]Position W[1] Region 4[2] | PSC | |
| SMM3 | 238.5404 | -2.8154 | 13.510.0 | 0.35 | 64.2 | \addstackgap[0pt]\Centerstack[c]Position N[1] Region 5[2] | PSC | |
| G45.12+61.11 | SMM1 | 225.6511 | 29.3460 | point | 0.08 | 111.2 | \addstackgap[0pt]\Centerstack[c]PLCK G045.1+61.1[3,4] | LeG |
| G50.41-35.40 | SMM1 | 321.7839 | -2.7151 | 10.38.3 | 0.52 | 148.5 | - | Artifact |
| G53.44-36.25 | SMM1 | 323.7980 | -1.0478 | point | 0.09 | 111.8 | SMMJ2135-0102[5] | LeG |
| G92.49+42.88 | SMM1 | 242.3232 | 60.7542 | point | 0.08 | 110.4 | PLCK G092.5+42.9[3,4] | LeG |
| G152.54-47.36 | SMM1 | 32.8050 | 10.8598 | point | 0.89 | 942.0 | J021113.1+105134[6] | BLL |
| G157.44+30.33 | SMM1 | 113.3787 | 117.2158 | point | 0.07 | 74.8 | PLCKESZ[7] | ClG |
| G197.98+33.10 | SMM1 | 128.3946 | 26.1982 | 36.827.7 | 6.29 | 176.6 | - | Artifact |
| G200.62+46.09 | SMM1 | 143.0981 | 27.4163 | point | 0.06 | 75.1 | PLCK G200.6+46.1[3] | LeG |
| G204.99+30.38 | SMM1 | 127.6930 | 19.6131 | point | 0.014 | 20.5 | Planck18p194-0[8] | PClG |
| SMM2 | 127.7268 | 19.6251 | point | 0.009 | 15.4 | Planck18p194-1[8] | PClG | |
| SMM3 | 127.6705 | 19.6631 | point | 0.008 | 14.2 | Planck18p194-3[8] | PClG | |
| G210.90-36.55 | SMM1 | 68.7600 | -14.2287 | point | 0.05 | 64.1 | \addstackgap[0pt]\Centerstack[c]GCVS EW Eri[9] MJR2015 1752[10] | \addstackgap[0pt]\Centerstack[c]V* Y*O |
| SMM2 | 68.7080 | -14.2195 | point | 0.08 | 82.1 | \addstackgap[0pt]\Centerstack[c]HH123[11] MJR2015 1751[10] | \addstackgap[0pt]\Centerstack[c]HH Y*O | |
| G211.62+32.23 | SMM1 | 131.7098 | 15.0943 | point | 0.11 | 125.8 | J084650.1+150547[12] | AGN? |
| G228.99+30.91 | SMM1 | 137.2924 | 1.3599 | point | 0.23 | 274.9 | 4C 01.24B[13] | QSO |
| G343.12+58.61 | SMM1 | 212.5190 | 2.0516 | point | 0.04 | 68.4 | J141004.6+020306[14] | BLL |
Note. — The HLPC fields are listed in column (1). The extracted sources are named as SMM, as listed in column (2). The equatorial coordinates of R.A. and Dec. in Epoch J2000 are listed in columns (3) and (4). The deconvolved standard deviation along the major and minor axis are listed in columns (5), and marked as “point” if the source is unresolved as a point source. The integrated flux and peak intensity are listed in columns (6) and (7). Identifier(s) and classifications retrieved from SIMBAD are listed in columns (8) and (9).
Appendix A SCUBA-2 Observation Archive
Table A1 presents the information for JCMT SCUBA-2 observations toward 70 High Latitude Planck Galactic Cold Clumps (HLPCs). We sort the observations by Galactic longitude and number the fields from 1 to 70. The serial number and the name of HLPC are listed in columns (1) and (2). The equatorial coordinates Right Accession (RA) and Declination (DEC) of the field center in Epoch J2000 are listed in columns (3) and (4). The project ID and scan pattern of the JCMT SCUBA-2 observation are listed in columns (5) and (6). The angular offset, which is defined by the angular distance from the field center to the center of the corresponding PGCC, is listed in column (7). The rms noise of the field is listed in column (8). As mentioned in Section 2.3, the estimated distances and altitude are listed in columns (9)–(10).
| No. | Field | RA | Dec. | Project ID | Scan Patterna | Offset | rms | Distance | Altitude |
|---|---|---|---|---|---|---|---|---|---|
| deg | deg | arcmin | pc | pc | |||||
| 1 | G4.13+35.75 | 238.3879 | -4.6406 | M14AU35 | Curvy Pong | 2.17 | 6.2 | 140 | 90 |
| 2 | G4.17+36.67 | 237.6817 | -4.0717 | M15AI05 | CV Daisy | 0.55 | 13.8 | 130 | 87 |
| 3 | G4.55+36.73 | 237.8058 | -3.7993 | M15AI05 | CV Daisy | 1.55 | 14.1 | 130 | 88 |
| 4 | G4.80+37.02 | 237.7933 | -3.4799 | M15AI05 | CV Daisy | 4.53 | 13.7 | 130 | 88 |
| 5 | G5.70+36.84 | 238.31 | -3.0125 | M16AL003 | CV Daisy | 0.01 | 15.9 | 120 | 83 |
| 6 | G6.04+36.77 | 238.5362 | -2.8793 | M16AL003 | CV Daisy | 2.38 | 9.6 | 120 | 83 |
| 7 | G27.31+37.33 | 246.8812 | 11.9261 | M15AI57 | Curvy Pong | 2.73 | 13.7 | 190 | 128 |
| 8 | G37.52+44.57 | 242.6992 | 21.7625 | M15AI57 | Curvy Pong | 1.61 | 24.8 | 120 | 96 |
| 9 | G45.12+61.11 | 225.65 | 29.3475 | M13AC22 | CV Daisy | 1.03 | 13.0 | 180 | 170 |
| 10 | G45.16-36.19 | 320.2862 | -6.7184 | M15AI57 | Curvy Pong | 0.64 | 15.9 | 370 | -206 |
| 11 | G48.63+34.42 | 256.0433 | 27.17 | M15AI57 | Curvy Pong | 1.08 | 14.0 | 220 | 133 |
| 12 | G48.88+30.61 | 260.2037 | 26.2654 | M15AI57 | Curvy Pong | 0.57 | 10.2 | 240 | 134 |
| 13 | G50.41-35.40 | 321.7487 | -2.6816 | M14AU02 | CV Daisy | 1.67 | 25.0 | 240 | -131 |
| 14 | G53.44-36.25 | 323.7992 | -1.0448 | M15AI29 | CV Daisy | 0.6 | 5.7 | 260 | -143 |
| 15 | G55.83-41.59 | 329.223 | -2.5211 | M19BP010 | CV Daisy | 2.3 | 21.3 | 170 | -105 |
| 16 | G63.65+47.67 | 241.9708 | 40.0444 | M13AC22 | CV Daisy | 1.25 | 3.7 | 190 | 153 |
| 17 | G92.49+42.88 | 242.3242 | 60.7558 | M13AC22 | CV Daisy | 0.81 | 15.0 | 240 | 176 |
| 18 | G93.60+55.86 | 221.0292 | 54.3658 | M13AC22 | CV Daisy | 0.81 | 4.6 | - | - |
| 19 | G96.05-50.34 | 355.8812 | 8.9585 | M15AI57 | Curvy Pong | 0.79 | 20.1 | 170 | -123 |
| 20 | G105.07-38.06 | 357.7146 | 22.7272 | M16AL003 | CV Daisy | 2.32 | 18.3 | 240 | -141 |
| 21 | G106.71-36.53 | 358.5827 | 24.566 | M16AL003 | CV Daisy | 1.61 | 20.0 | 190 | -105 |
| 22 | G108.74-52.67 | 4.2204 | 9.2853 | M15AI57 | Curvy Pong | 2.6 | 21.4 | 190 | -144 |
| 23 | G114.26-51.70 | 7.4162 | 10.7958 | M15AI57 | Curvy Pong | 0.87 | 26.3 | 210 | -151 |
| 24 | G118.25-52.70 | 9.9721 | 10.0741 | M15AI57 | Curvy Pong | 0.6 | 25.4 | 190 | -144 |
| 25 | G126.65-71.45 | 14.0508 | -8.5967 | M14AU02 | CV Daisy | 0.96 | 10.1 | 180 | -164 |
| 26 | G128.30-69.65 | 14.7304 | -6.8572 | M15AI57 | Curvy Pong | 0.48 | 13.4 | 160 | -143 |
| 27 | G128.76-69.46 | 14.9083 | -6.6946 | M15AI57 | Curvy Pong | 1.1 | 13.6 | 170 | -152 |
| 28 | G128.94-46.39 | 17.1279 | 16.3175 | M16AL003 | CV Daisy | 3.56 | 32.1 | 190 | -130 |
| 29 | G132.04-45.20 | 19.5372 | 17.2079 | M16AL003 | CV Daisy | 1.8 | 29.0 | 260 | -174 |
| 30 | G133.71-46.64 | 20.5246 | 15.6283 | M19BP010 | CV Daisy | 2.17 | 25.8 | 180 | -123 |
| 31 | G135.11-49.44 | 21.0113 | 12.685 | M19BP010 | CV Daisy | 4.59 | 24.2 | 230 | -165 |
| 32 | G138.36-69.45 | 18.2708 | -7.2253 | M15AI57 | Curvy Pong | 0.74 | 17.5 | 160 | -143 |
| 33 | G148.45+37.96 | 136.1146 | 65.9864 | M19BP010 | CV Daisy | 3.05 | 20.5 | 330 | 210 |
| 34 | G152.54-47.36 | 32.7862 | 10.8591 | M14AU02 | CV Daisy | 0.96 | 8.8 | 180 | -125 |
| 35 | G157.44+30.33 | 117.2383 | 59.6949 | M15AI29 | CV Daisy | 1.35 | 9.2 | 240 | 133 |
| 36 | G158.51-33.99 | 43.7871 | 20.1953 | M16AL003 | CV Daisy | 0.0 | 14.0 | 220 | -112 |
| 37 | G158.75-33.31 | 44.3617 | 20.6131 | M16AL003 | CV Daisy | 2.54 | 17.8 | 230 | -117 |
| 38 | G158.86-34.19 | 43.9292 | 19.8755 | M16AL003 | CV Daisy | 0.01 | 15.0 | 240 | -127 |
| 39 | G159.14-33.79 | 44.3671 | 20.0704 | M16AL003 | CV Daisy | 0.0 | 14.8 | 220 | -111 |
| 40 | G159.21-34.28 | 44.1358 | 19.6369 | M15BI061 | CV Daisy | 0.0 | 19.2 | 240 | -128 |
| 41 | G159.23-34.51 | 44.0096 | 19.4369 | M15BI061 | CV Daisy | 0.0 | 19.2 | 240 | -128 |
| 42 | G159.41-34.37 | 44.1917 | 19.4608 | M15BI061 | CV Daisy | 1.95 | 13.8 | 210 | -106 |
| 43 | G159.58-32.83 | 45.2717 | 20.6667 | M16AL003 | CV Daisy | 0.39 | 17.7 | 210 | -101 |
| 44 | G159.66-34.31 | 44.4433 | 19.3998 | MJLSY14B | CV Daisy | 0.11 | 14.2 | 190 | -99 |
| 45 | G161.43-35.60 | 44.9392 | 17.5759 | MJLSY14B | CV Daisy | 4.28 | 14.2 | 180 | -97 |
| 46 | G161.67-35.92 | 44.8883 | 17.1405 | M16AL003 | CV Daisy | 0.01 | 15.9 | 180 | -97 |
| 47 | G161.87-35.76 | 45.1096 | 17.1912 | M14AU02 | CV Daisy | 1.02 | 15.4 | 160 | -85 |
| 48 | G174.35-39.98 | 50.0233 | 7.6149 | M14AU02 | CV Daisy | 1.06 | 11.2 | 150 | -89 |
| 49 | G191.73-83.41 | 19.6517 | -24.5784 | M14AC02 | CV Daisy | 2.36 | 2.4 | 180 | -172 |
| 50 | G197.98+33.10 | 128.4412 | 26.1953 | M14AU02 | CV Daisy | 0.44 | 17.2 | 260 | 151 |
| 51 | G200.62+46.09 | 143.1058 | 27.3923 | M14AC02 | CV Daisy | 0.37 | 3.8 | - | - |
| 52 | G203.57-30.09 | 71.9871 | -5.9299 | M16AL003 | CV Daisy | 0.0 | 12.5 | 220 | -99 |
| 53 | G204.99+30.38 | 127.7183 | 19.6509 | M13BU09 | CV Daisy | 1.48 | 2.4 | 240 | 133 |
| 54 | G210.90-36.55 | 68.7596 | -14.2279 | M15BI041 | CV Daisy | 2.37 | 5.1 | 150 | -77 |
| 55 | G210.90+63.39 | 163.2525 | 24.9403 | M15AI57 | Curvy Pong | 1.75 | 15.2 | 110 | 108 |
| 56 | G211.62+32.23 | 131.6992 | 15.1041 | M14AU02 | CV Daisy | 0.71 | 13.0 | 310 | 174 |
| 57 | G220.55+60.12 | 161.2271 | 19.6588 | M14AU02 | CV Daisy | 0.95 | 12.9 | 150 | 144 |
| 58 | G228.99+30.91 | 137.2925 | 1.3597 | M14AU15 | CV Daisy | 2.63 | 9.6 | 410 | 221 |
| 59 | G235.60+38.28 | 146.4071 | 0.7633 | M15AI57 | Curvy Pong | 1.9 | 16.7 | 180 | 123 |
| 60 | G235.67+38.00 | 146.2854 | 0.5485 | M15AI57 | Curvy Pong | 2.83 | 16.7 | 180 | 123 |
| 61 | G240.03+68.75 | 173.2117 | 16.1356 | M15AI57 | Curvy Pong | 1.59 | 14.7 | 130 | 131 |
| 62 | G251.29+73.32 | 179.3175 | 16.1378 | M15AI57 | Curvy Pong | 1.41 | 15.3 | 120 | 127 |
| 63 | G259.63+31.89 | 155.3671 | -17.5 | MJLSY01 | Curvy Pong | 32.99 | 38.8 | 240 | 139 |
| 64 | G343.12+58.61 | 212.5196 | 2.0519 | M14AU15 | CV Daisy | 2.32 | 9.3 | 140 | 127 |
| 65 | G356.76+32.82 | 236.6396 | -11.2159 | M15AI57 | Curvy Pong | 1.88 | 29.4 | 150 | 89 |
| 66 | G356.93+30.19 | 238.7129 | -12.8761 | M15AI57 | Curvy Pong | 0.98 | 28.8 | 180 | 102 |
| 67 | G357.11+30.06 | 238.8917 | -12.8652 | M15AI57 | Curvy Pong | 0.7 | 26.7 | 160 | 92 |
| 68 | G357.38+30.60 | 238.6437 | -12.3195 | M15AI57 | Curvy Pong | 0.51 | 25.0 | 150 | 84 |
| 69 | G358.96+36.81 | 234.8908 | -7.1984 | M15AI57 | Curvy Pong | 1.73 | 27.5 | 130 | 88 |
| 70 | G359.21+36.89 | 234.9154 | -6.9746 | M15AI57 | Curvy Pong | 1.4 | 14.2 | 120 | 83 |
Note. — The serial number and the name of HLPC are listed in columns (1) and (2). The equatorial coordinates Right Accession (RA) and Declination (Dec.) of the field center in Epoch J2000 are listed in columns (3) and (4). The project ID and scan pattern of the JCMT SCUBA-2 observation are listed in columns (5) and (6). The angular offset, which is defined by the angular distance from the field center to the center of the corresponding PGCC, is listed in column (7). The rms noise of the field is listed in column (8). The distance derived from dust map is listed in column (9). The altitude from the Galactic mid-plane is listed in column (10). This table is available in its entirety in machine-readable form.
Appendix B Source Extraction
To avoid large marginal noise features masquerading as sources, we set a “cut-off radius” within which we estimate noise and extract sources for each field. The “cut-off radius” depends on FoV. For the CV Daisy observation mode, the radius is set to 5′. For Curvy Pong, the radius is set 10′. One exception is the field 63 with FoV, so we set the diameter to be ′. We carefully select emission-free pixels and take the root mean square (rms) as a uniform noise in each field (i.e., column (8) of Table A1). An intensity threshold of , a step of , and a minimum number of pixels (12 in our case) slightly larger than those contained in a JCMT beam are used for the input of the algorithm. In the output, “leaves” are the smallest structures and then defined as detected sources or sources hereafter.
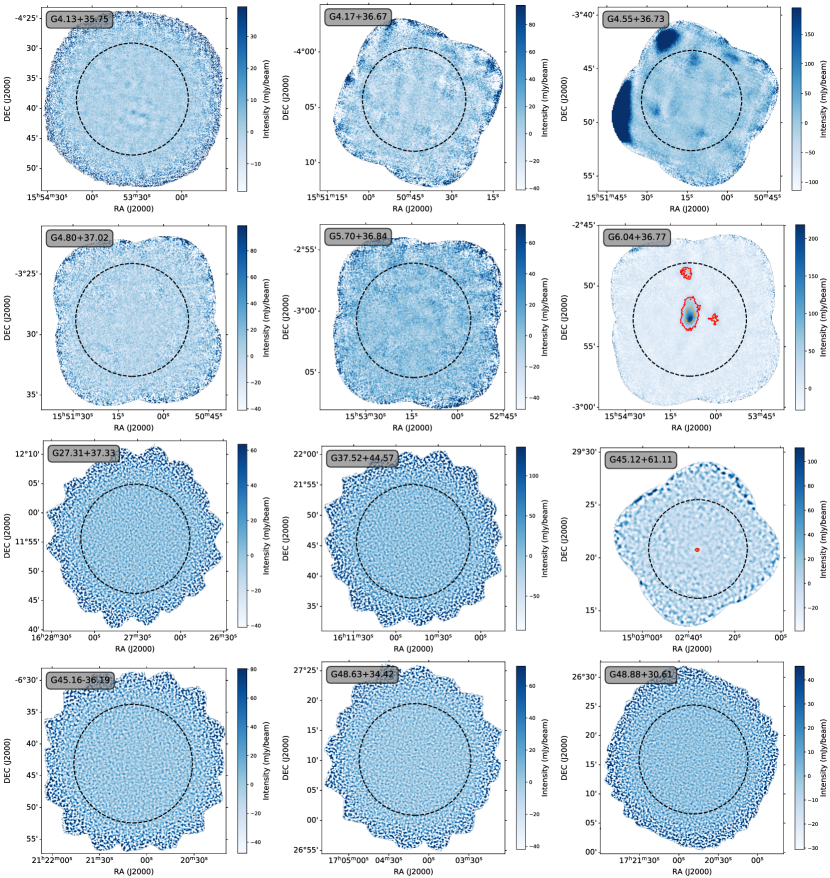
Figure B1 displays all of the SCUBA-2 fields towards HLPCs. The “cut-off radius” utilized for source extraction is demarcated by the black dashed circles. The red contours demarcate the mask of extracted sources, while the outcomes of the 2D Gaussian fitting are visualized through orange ellipses.
Appendix C L183 Prestellar Cores
Assuming that total emission in column (6) of Table 1 is dust blackbody emission, then the mass of the three prestellar cores in L183 can be derived from,
| (C1) |
where is distance of 120 pc and is estimated from the temperature map which is derived from pixelwise SED fitting by Karoly et al. (2020). As a result, , , and . The mass of SMM1 is consistent with what has been derived in Karoly et al. (2020), but the masses of SMM2 and SMM3 are much smaller. The reason is likely the 6 times better sensitivity in Karoly et al. (2020) than ours, resulting in more extended emission being included.
The physical radius can be derived from deconvolved size by where (Rosolowsky et al., 2010). We obtain au, au, and au. And the averaged volume density of molecular hydrogen can be calculated assuming a sphere as,
| (C2) |
So we derive cm-3, cm-3, and cm-3, which are all consistent with values in Karoly et al. (2020).
References
- Astropy Collaboration et al. (2013) Astropy Collaboration, Robitaille, T. P., Tollerud, E. J., et al. 2013, A&A, 558, A33, doi: 10.1051/0004-6361/201322068
- Astropy Collaboration et al. (2018) Astropy Collaboration, Price-Whelan, A. M., Sipőcz, B. M., et al. 2018, AJ, 156, 123, doi: 10.3847/1538-3881/aabc4f
- Astropy Collaboration et al. (2022) Astropy Collaboration, Price-Whelan, A. M., Lim, P. L., et al. 2022, ApJ, 935, 167, doi: 10.3847/1538-4357/ac7c74
- Beckwith et al. (1990) Beckwith, S. V. W., Sargent, A. I., Chini, R. S., & Guesten, R. 1990, AJ, 99, 924, doi: 10.1086/115385
- Benson & Myers (1983) Benson, P. J., & Myers, P. C. 1983, ApJ, 270, 589, doi: 10.1086/161151
- Benson & Myers (1989) —. 1989, ApJS, 71, 89, doi: 10.1086/191365
- Berriman & Good (2017) Berriman, G. B., & Good, J. C. 2017, PASP, 129, 058006, doi: 10.1088/1538-3873/aa5456
- Blitz et al. (1984) Blitz, L., Magnani, L., & Mundy, L. 1984, ApJ, 282, L9, doi: 10.1086/184293
- Braine et al. (2023) Braine, J., Sun, Y., Shimajiri, Y., et al. 2023, A&A, 676, A27, doi: 10.1051/0004-6361/202039923
- Cañameras et al. (2015) Cañameras, R., Nesvadba, N. P. H., Guery, D., et al. 2015, A&A, 581, A105, doi: 10.1051/0004-6361/201425128
- Dame et al. (1987) Dame, T. M., Ungerechts, H., Cohen, R. S., et al. 1987, ApJ, 322, 706, doi: 10.1086/165766
- Dapp & Basu (2009) Dapp, W. B., & Basu, S. 2009, MNRAS, 395, 1092, doi: 10.1111/j.1365-2966.2009.14616.x
- Dempsey et al. (2013) Dempsey, J. T., Friberg, P., Jenness, T., et al. 2013, MNRAS, 430, 2534, doi: 10.1093/mnras/stt090
- Dickens et al. (2000) Dickens, J. E., Irvine, W. M., Snell, R. L., et al. 2000, ApJ, 542, 870, doi: 10.1086/317040
- Eden et al. (2019) Eden, D. J., Liu, T., Kim, K.-T., et al. 2019, MNRAS, 485, 2895, doi: 10.1093/mnras/stz574
- Evans et al. (2022) Evans, N. J., Kim, J.-G., & Ostriker, E. C. 2022, ApJ, 929, L18, doi: 10.3847/2041-8213/ac6427
- Franco (1989) Franco, G. A. P. 1989, A&A, 223, 313
- Frye et al. (2019) Frye, B. L., Pascale, M., Qin, Y., et al. 2019, ApJ, 871, 51, doi: 10.3847/1538-4357/aaeff7
- Gaia Collaboration et al. (2016) Gaia Collaboration, Prusti, T., de Bruijne, J. H. J., et al. 2016, A&A, 595, A1, doi: 10.1051/0004-6361/201629272
- Green et al. (2019) Green, G. M., Schlafly, E., Zucker, C., Speagle, J. S., & Finkbeiner, D. 2019, ApJ, 887, 93, doi: 10.3847/1538-4357/ab5362
- Green et al. (2014) Green, G. M., Schlafly, E. F., Finkbeiner, D. P., et al. 2014, ApJ, 783, 114, doi: 10.1088/0004-637X/783/2/114
- Griv et al. (2021) Griv, E., Gedalin, M., Pietrukowicz, P., Majaess, D., & Jiang, I.-G. 2021, MNRAS, 502, 4194, doi: 10.1093/mnras/stab321
- Healey et al. (2008) Healey, S. E., Romani, R. W., Cotter, G., et al. 2008, ApJS, 175, 97, doi: 10.1086/523302
- Jacob et al. (2010) Jacob, J. C., Katz, D. S., Berriman, G. B., et al. 2010, Montage: An Astronomical Image Mosaicking Toolkit, Astrophysics Source Code Library, record ascl:1010.036. http://ascl.net/1010.036
- Johnstone et al. (2004) Johnstone, D., Di Francesco, J., & Kirk, H. 2004, ApJ, 611, L45, doi: 10.1086/423737
- Juvela et al. (2002) Juvela, M., Mattila, K., Lehtinen, K., et al. 2002, A&A, 382, 583, doi: 10.1051/0004-6361:20011539
- Karoly et al. (2020) Karoly, J., Soam, A., Andersson, B. G., et al. 2020, ApJ, 900, 181, doi: 10.3847/1538-4357/abad37
- Kirk et al. (2005) Kirk, J. M., Ward-Thompson, D., & André, P. 2005, MNRAS, 360, 1506, doi: 10.1111/j.1365-2966.2005.09145.x
- Lee & Myers (1999) Lee, C. W., & Myers, P. C. 1999, ApJS, 123, 233, doi: 10.1086/313234
- Lee et al. (2001) Lee, C. W., Myers, P. C., & Tafalla, M. 2001, ApJS, 136, 703, doi: 10.1086/322534
- Lin et al. (2023) Lin, Y., Spezzano, S., Pineda, J. E., et al. 2023, arXiv e-prints, arXiv:2308.12835, doi: 10.48550/arXiv.2308.12835
- Liu et al. (2013) Liu, T., Wu, Y., & Zhang, H. 2013, ApJ, 775, L2, doi: 10.1088/2041-8205/775/1/L2
- Liu et al. (2018) Liu, T., Kim, K.-T., Juvela, M., et al. 2018, ApJS, 234, 28, doi: 10.3847/1538-4365/aaa3dd
- Low et al. (1984) Low, F. J., Beintema, D. A., Gautier, T. N., et al. 1984, ApJ, 278, L19, doi: 10.1086/184213
- MacKenzie et al. (2017) MacKenzie, T. P., Scott, D., Bianconi, M., et al. 2017, MNRAS, 468, 4006, doi: 10.1093/mnras/stx512
- Magnani et al. (1985) Magnani, L., Blitz, L., & Mundy, L. 1985, ApJ, 295, 402, doi: 10.1086/163385
- Magnani & de Vries (1986) Magnani, L., & de Vries, C. P. 1986, A&A, 168, 271
- Magnani et al. (1996) Magnani, L., Hartmann, D., & Speck, B. G. 1996, ApJS, 106, 447, doi: 10.1086/192344
- Mairs et al. (2015) Mairs, S., Johnstone, D., Kirk, H., et al. 2015, MNRAS, 454, 2557, doi: 10.1093/mnras/stv2192
- Malinen et al. (2014) Malinen, J., Juvela, M., Zahorecz, S., et al. 2014, A&A, 563, A125, doi: 10.1051/0004-6361/201323026
- Mann & Whitney (1947) Mann, H. B., & Whitney, D. R. 1947, The Annals of Mathematical Statistics, 18, 50 , doi: 10.1214/aoms/1177730491
- McGehee (2008) McGehee, P. M. 2008, in Handbook of Star Forming Regions, Volume II, ed. B. Reipurth, Vol. 5, 813
- Meng et al. (2013) Meng, F., Wu, Y., & Liu, T. 2013, ApJS, 209, 37, doi: 10.1088/0067-0049/209/2/37
- Miville-Deschênes & Lagache (2005) Miville-Deschênes, M.-A., & Lagache, G. 2005, ApJS, 157, 302, doi: 10.1086/427938
- Montillaud et al. (2015) Montillaud, J., Juvela, M., Rivera-Ingraham, A., et al. 2015, A&A, 584, A92, doi: 10.1051/0004-6361/201424063
- Myers (1983) Myers, P. C. 1983, ApJ, 270, 105, doi: 10.1086/161101
- Myers & Benson (1983) Myers, P. C., & Benson, P. J. 1983, ApJ, 266, 309, doi: 10.1086/160780
- Myers et al. (1983) Myers, P. C., Linke, R. A., & Benson, P. J. 1983, ApJ, 264, 517, doi: 10.1086/160619
- Neugebauer et al. (1984) Neugebauer, G., Habing, H. J., van Duinen, R., et al. 1984, ApJ, 278, L1, doi: 10.1086/184209
- Pagani et al. (2003) Pagani, L., Lagache, G., Bacmann, A., et al. 2003, A&A, 406, L59, doi: 10.1051/0004-6361:20030903
- Planck Collaboration et al. (2011a) Planck Collaboration, Ade, P. A. R., Aghanim, N., et al. 2011a, A&A, 536, A23, doi: 10.1051/0004-6361/201116472
- Planck Collaboration et al. (2011b) —. 2011b, A&A, 536, A7, doi: 10.1051/0004-6361/201116474
- Planck Collaboration et al. (2014) —. 2014, A&A, 571, A29, doi: 10.1051/0004-6361/201321523
- Planck Collaboration et al. (2016) —. 2016, A&A, 594, A28, doi: 10.1051/0004-6361/201525819
- Plotkin et al. (2008) Plotkin, R. M., Anderson, S. F., Hall, P. B., et al. 2008, AJ, 135, 2453, doi: 10.1088/0004-6256/135/6/2453
- Reipurth & Heathcote (1990) Reipurth, B., & Heathcote, S. 1990, A&A, 229, 527
- Rosolowsky et al. (2010) Rosolowsky, E., Dunham, M. K., Ginsburg, A., et al. 2010, ApJS, 188, 123, doi: 10.1088/0067-0049/188/1/123
- Rosolowsky et al. (2008) Rosolowsky, E. W., Pineda, J. E., Kauffmann, J., & Goodman, A. A. 2008, ApJ, 679, 1338, doi: 10.1086/587685
- Samus’ et al. (2017) Samus’, N. N., Kazarovets, E. V., Durlevich, O. V., Kireeva, N. N., & Pastukhova, E. N. 2017, Astronomy Reports, 61, 80, doi: 10.1134/S1063772917010085
- Shu et al. (1987) Shu, F. H., Adams, F. C., & Lizano, S. 1987, ARA&A, 25, 23, doi: 10.1146/annurev.aa.25.090187.000323
- Swinbank et al. (2010) Swinbank, A. M., Smail, I., Longmore, S., et al. 2010, Nature, 464, 733, doi: 10.1038/nature08880
- Toth et al. (1995) Toth, L. V., Haikala, L. K., Liljestroem, T., & Mattila, K. 1995, A&A, 295, 755
- Truebenbach & Darling (2017) Truebenbach, A. E., & Darling, J. 2017, MNRAS, 468, 196, doi: 10.1093/mnras/stx456
- Ward-Thompson et al. (1999) Ward-Thompson, D., Motte, F., & Andre, P. 1999, MNRAS, 305, 143, doi: 10.1046/j.1365-8711.1999.02412.x
- Ward-Thompson et al. (1994) Ward-Thompson, D., Scott, P. F., Hills, R. E., & Andre, P. 1994, MNRAS, 268, 276, doi: 10.1093/mnras/268.1.276
- Ward-Thompson et al. (2016) Ward-Thompson, D., Pattle, K., Kirk, J. M., et al. 2016, MNRAS, 463, 1008, doi: 10.1093/mnras/stw1978
- Whitworth & Ward-Thompson (2001) Whitworth, A. P., & Ward-Thompson, D. 2001, ApJ, 547, 317, doi: 10.1086/318373
- Wright et al. (2009) Wright, E. L., Chen, X., Odegard, N., et al. 2009, ApJS, 180, 283, doi: 10.1088/0067-0049/180/2/283
- Wu et al. (2012) Wu, Y., Liu, T., Meng, F., et al. 2012, ApJ, 756, 76, doi: 10.1088/0004-637X/756/1/76
- Xu et al. (2021) Xu, F., Wu, Y., Liu, T., et al. 2021, ApJ, 920, 103, doi: 10.3847/1538-4357/ac1686
- Zucker et al. (2022) Zucker, C., Goodman, A. A., Alves, J., et al. 2022, Nature, 601, 334, doi: 10.1038/s41586-021-04286-5