On the evidence of dynamical dark energy
Abstract
To elucidate the robustness of the baryon acoustic oscillation (BAO) data measured by the Dark Energy Spectroscopic Instrument (DESI) in capturing the dynamical behavior of dark energy, we assess the model dependence of the evidence for dynamical dark energy inferred from the DESI BAO data. While the DESI BAO data slightly tightens the constraints on model parameters and increases the tension between the Chevallier-Polarski-Linder (CPL) model and the CDM model, we find that the influence of DESI BAO data on the constraint of is small in the SSLCPL model. In comparison to the CPL model, the tension with the CDM model is reduced for the SSLCPL model, suggesting that the evidence for dynamical dark energy from DESI BAO data is dependent on cosmological models. The inclusion of spatial curvature has little impact on the results in the SSLCPL model.
I Introduction
Since the discovery of accelerated expansion of the Universe by observations of type Ia supernovae (SNe Ia) in 1998 [1, 2], the nature of dark energy remains one of the most profound mysteries in modern cosmology. Despite being one of the simplest candidates for dark energy, the expected value of the cosmological constant from vacuum energy is larger than the observed value by [3], and the CDM model faces the fine tuning and coincidence problems. Additionally, the Hubble constant derived from observations of cosmic microwave background (CMB) anisotropies using the CDM model [4], is away from the local measurements obtained through SNe Ia observations [5].
Recent advancements in observations, particularly through the Data Release 1 (DR1) from the first year of observations of baryon acoustic oscillations (BAO) by the Dark Energy Spectroscopic Instrument (DESI), have provided new insights into the property of dark energy, specifically its dynamical aspects [6]. Using the flat Chevallier-Polarski-Linder (CPL) model [7, 8], DESI BAO data gives at the confidence level and at the 95% confidence level [6], suggesting a mild tension with the CDM model. The combination of DESI BAO and Planck 2018 data gives and , indicating a preference for dynamical dark energy at the significance level [6]. Furthermore, the CPL model is favored over the CDM model at the , and significance level using the combination of DESI BAO, CMB [4] and Pantheon Plus SNe Ia [9], the combination of DESI BAO, CMB and Union3 SNe Ia [10], and the combination of DESI BAO, CMB and SNe Ia data discovered and measured during the full five year of the Dark Energy Survey (DES) program [11], respectively [6]. For more discussions on the evidence for dynamical dark energy, please see Refs [12, 13, 14, 15, 16, 17, 18, 19, 20, 21, 22] and references therein.
However, the evidence for evolving dark energy depends on the underlying cosmological models such as the CDM model or the CPL model. For a slowly rolling scalar field, the dynamics of thawing fields over a large redshift range can be approximated by the CPL parameterization with an explicit dengeneracy relation between and , where is the scale factor [23, 24]. The so called SSLCPL parameterization models a wide class of thawing scalar fields with only one free parameter [23, 24]. In this paper, we explore the model dependence of the evidence for dynamical dark energy as inferred from DESI BAO data using the SSLCPL model. We further investigate the impact of spatial curvature on the results.
II Observational data and cosmology models
II.1 Observational data
For the BAO data, we use the BAO measurements in the redshift range of , from the first year of observations with the DESI [6], and we label the dataset as BAO. DESI is carrying out a five-year survey across 14,200 square degrees and uses six different galaxy tracers, including bright galaxies from the low-redshift survey, luminous red galaxies, emission line galaxies, quasars as direct tracers, and Lyman- forest quasars, to trace the distribution of neutral hydrogen. DESI BAO measures the volume-averaged distance in terms of the quantity at two effective redshifts and , the tansverse comvoing angular diameter distance in terms of and at five different redshits, where and is the sound horizon at the drag epoch , the drag redshift is fitted as [25],
| (1) | |||||
| (2) | |||||
| (3) |
the comoving sound horizon is
| (4) |
the sound speed , and . Since the DESI BAO data points at the redshift show a statistical fluctuation [26, 6], so we also use the DESI BAO data without the data points at the redshift to avoid the problem and label the dataset excluding the data points at the redshift as BAO-.
For the CMB data from the Planck 2018 legacy release [27, 4], instead of the full temperature anisotropy and polarization power spectra dataset, we use the results of compressed parameters given in the Table F1 in Ref. [10], the sift parameter at recombination with the redshift ,
| (5) |
the acoustic angular scale at recombination, and the baryon density , where is the sound horizon at recombination, and the recombination redshift is fitted as [25],
| (6) | |||||
| (7) | |||||
| (8) |
We label the compressed Planck data as P18.
We use three different SNe Ia data: 1829 SNe Ia compiled by DES [28], the Union3 compilation of 2087 SNe Ia [10], and the Pantheon Plus sample of 1550 spectroscopically confirmed SNe Ia [9]. The DES SNe Ia dataset, labeled as D5, includes 1635 photometrically-classified DES SNe Ia in the redshift range and 194 low-redshift SNe Ia with redshifts . The Union3 SNe Ia dataset, labeled as U3, comes from 24 datasets spanning the redshift range . The Pantheon Plus SNe Ia dataset, labeled as PP, covers the redshift range . In order to mitigate the effects of peculiar velocity corrections, a bound was imposed, resulting in a subset of 1590 SNe Ia data points with redshifts in the Pantheon Plus SNe Ia dataset.
The Hubble parameter data compiled in Ref. [29], labeled as H, includes 32 data points obtained with the cosmic chronometer (CCH) method using the differential redshift time derived from the the age evolution of passively evolving galaxies [30, 31, 32, 33, 34, 35, 36, 37, 38], and 26 data points obtained from radial BAO observations, covering the redshits [39, 40, 41, 42, 43, 44, 45, 46, 47, 48, 49].
II.2 Methods
We perform Markov Chain Monte Carlo (MCMC) simulations by using the publicly available emcee Python code [50] and analyze the samples using the GetDist Python module [51] to give constraints on model parameters. We combine the CMB and data with different SNe Ia data to get the datasets: P18+H+PP, P18+H+D5 and P18+H+U3, to derive the average values, confidence levels and likelihood distributions of model parameters for various models. Then we combine the DESI BAO data including and excluding the data points at the redshfit with the above datasets to obtain datasets: BAO+P18+H+PP, BAO+P18+H+D5, BAO+P18+H+U3, BAO-+P18+H+PP, BAO-+P18+H+D5 and BAO-+P18+H+U3, and use the combined data to constrain the model parameters of various models.
To assess the performance of the models, we calculate the Akaike information criterion (AIC),
| (9) |
where is the minimum value of for the best-fit cosmological parameters and is the number of independent cosmological parameters. We compare the performance of CPL and SSLCPL models with the CDM model by calculating the difference in the value of AIC between the CPL and SSLCPL model and that of CDM model. If , then the model is favored over the CDM model with weak evidence. If AIC, then the evidence in favor of the model is positive. If AIC, then there is strong evidence in favor of the model. When , there is very strong evidence in favor of the model against the CDM model [15].
II.3 Cosmological models
The luminosity distance is
| (10) |
where and
| (11) |
The transverse comoving distance . The volume-averaged distance .
For the CDM model,
| (12) |
For Chevallier-Polarski-Linder (CPL) parametrization,
| (13) |
where and are model parameters,
| (14) |
III Results and Discussion
To verify if the compressed CMB data yields results consistent with the full power spectra data, we compare the constraints on the CDM and CPL models obtained from the combined CMB and BAO data, labeled as BAO+P18, and the results are shown in Table 1. From Table 1, we see that the results are similar and consistent for CDM and flat CPL models. For the CPL model with spatial curvature, although the best fit value for using the full power spectra is smaller–especially for the constraint from the combination of DESI BAO and Planck 2018 data– the results remain consistent with those obtained using the compressed data points at the level. These results confirm that we can use the three compressed data points to represent the full power spectra.
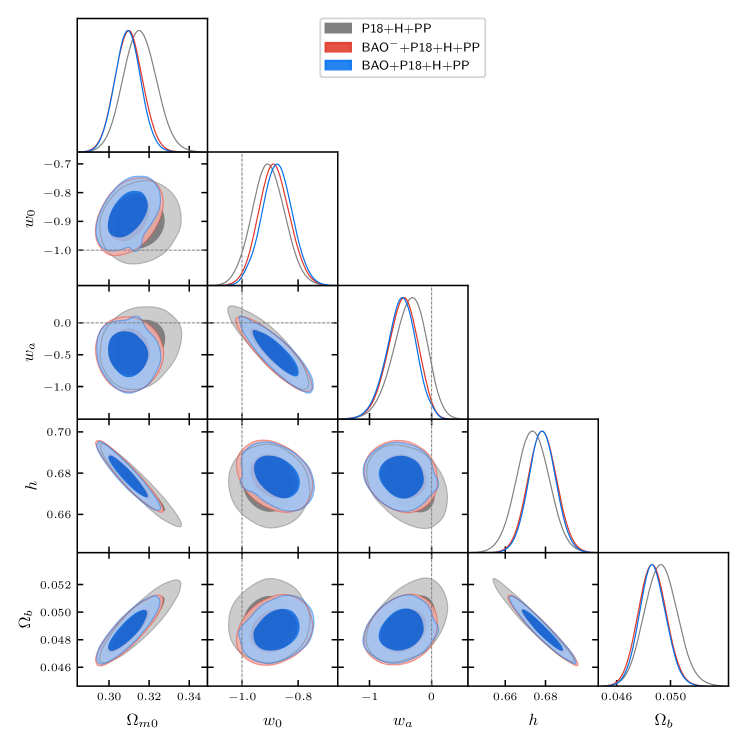
We fit the flat CPL model to the combined data: P18+H+PP, P18+H+D5 and P18+H+U3, then we add BAO and BAO- data to the combined dataset to assess the impact of BAO data on the constraints. We repeat the process with non-flat CPL model to see the effect of the spatial curvature on the results. Finally, we replace the CPL model with the SSLCPL model to evaluate whether the conclusion depends on cosmological models. We fit both flat and non-flat CPL and SSLCPL models to nine combinations of data: P18+H+PP, P18+H+D5, P18+H+U3, BAO+P18+H+PP, BAO+P18+H+D5, BAO+P18+H+U3, BAO-+P18+H+PP, BAO-+P18+H+D5 and BAO-+P18+H+U3. The results are shown in Table 2 and 3, and Figs. 1-5.
As shown in Table 2, Figs. 1 and 2, for the flat CPL model, the best fit values of and are smallest with the combined P18+H+PP data, while they are largest with the combined P18+H+U3 data. The best fit value of is largest with the combined P18+H+PP data, while it is smallest or further away from with the combined P18+H+U3 data. The error bars with the combined P18+H+U3 data are a little larger than those obtained with the other two combinations. The best fit value for and are both negative. The results with the combined P18+H+PP data are more consistent with the CDM model compared with those obtained from the combinations with D5 and U3. Adding the DESI BAO data, with or without the data points at the redshift , to the combined CMB, and SNe Ia data, we observe the same trend for the best fit values of the model parameters obtained from different SNe Ia data, with the constraints on these parameters becoming slightly more stringent. With the data points at the redshift , the addition of BAO data decreases the values of and , and increases , thereby intensifying the tension with the CDM model. In the absence of the data points at the redshift , the results are similar, although the tension with CDM diminishes slightly, indicating that the impact of data points at the redshift is small. By introducing spatial curvature as a free parameter, the constraints on the parameters , and broaden a little compared to those in the flat case and the same trend for the constraints with different SNe Ia data continues to persist. With the combined BAO+P18+H+D5 data, we get and for the flat CPL model, and for the non-flat flat CPL model, the values of AIC reach and for the flat and non-flat cases, respectively, indicating strong evidence for dynamical dark energy. The constraints on and from the combined BAO+P18+H+U3 data are similar, although the values of AIC are smaller.
As shown in Table 3 and Figs. 3-5, for the SSLCPL model, the constraints on from the combination with D5 and U3 are similar, although the error bars on from the combination with U3 are bigger that those from the combination with D5. The constraints on obtained from the combined data with PP are consistent with the CDM model at around the level, while the constraints on from the combined data with D5 and U3 are consistent with the CDM model at around the level. Without the DESI BAO data points at the redshift as shown in Figs. 3 and 4, the value of moves closer to . The impact of the spatial curvature on the constraints of is negligible. In summary, compared with the CPL model as shown in Fig. 5, the tension with the CDM model is reduced a little bit for the SSLCPL model. Even with the combined BAO+P18+H+D5 data, and AIC is for both flat and non-flat SSLCPL models.
| Model/Data | ||||
|---|---|---|---|---|
| Flat CDM | ||||
| BAO+P18 | ||||
| DESI | ||||
| CDM+ | ||||
| BAO+P18 | ||||
| DESI | ||||
| Flat CPL | ||||
| BAO+P18 | ||||
| DESI | ||||
| BAO+P18+PP | ||||
| DESI | ||||
| BAO+P18+U3 | ||||
| DESI | ||||
| BAO+P18+D5 | ||||
| DESI | ||||
| CPL+ | ||||
| BAO+P18 | ||||
| DESI | ||||
| BAO+P18+PP | ||||
| DESI | ||||
| BAO+P18+U3 | ||||
| DESI | ||||
| BAO+P18+D5 | ||||
| DESI |
| Data | AIC | ||||
|---|---|---|---|---|---|
| P18+H+PP | |||||
| P18+H+D5 | |||||
| P18+H+U3 | |||||
| BAO+P18+H+PP | |||||
| BAO+P18+H+D5 | |||||
| BAO+P18+H+U3 | |||||
| BAO-+P18+H+PP | |||||
| BAO-+P18+H+D5 | |||||
| BAO-+P18+H+U3 | |||||


| Data | AIC | |||
|---|---|---|---|---|
| P18+H+PP | ||||
| P18+H+D5 | ||||
| P18+H+U3 | ||||
| BAO+P18+H+PP | ||||
| BAO+P18+H+D5 | ||||
| BAO+P18+H+U3 | ||||
| BAO-+P18+H+PP | ||||
| BAO-+P18+H+D5 | ||||
| BAO-+P18+H+U3 | ||||
IV Conclusion
For the flat CPL model, the best fit values of and are smallest with the combined P18+H+PP data, while they are largest with the combined P18+H+U3 data. The best fit value of is largest with the combined P18+H+PP data, while it is smallest or further away from with the combined P18+H+U3 data. The error bars on from the combination with U3 are a little larger than those obtained with the other two combinations. Adding the DESI BAO data, with or without the data points at the redshift , to the combined CMB, and SNe Ia data, the constraints on model parameters become slightly more stringent. The addition of BAO data decreases the values of and , and increases , thereby intensifying the tension with the CDM model. The impact of data points at the redshift is small. Including the spatial curvature as a free parameter, the constraints on the parameters , and broaden a little compared to those in the flat case. With the combined BAO+P18+H+D5 data, we get and for the flat CPL model, and for the non-flat flat CPL model, the values of AIC reach and for the flat and non-flat cases, respectively, indicating strong evidence for dynamical dark energy. With the combined BAO+P18+H+U3 data, we get and for the flat CPL model, and for the non-flat flat CPL model, the values of AIC are and for the flat and non-flat cases, respectively. The results with the combined P18+H+PP data are more consistent with the CDM model compared with those obtained from the combinations with D5 and U3.
For the SSLCPL model, the constraints on from the combination with D5 and U3 are similar, although the error bars on from the combination with U3 are bigger that those from the combination with D5. The constraints on obtained from the combined data with PP are consistent with the CDM model at around the level, while the constraints on from the combined data with D5 and U3 are consistent with the CDM model at around the level.
In conclusion, the influence of DESI BAO data on the constraint of is small in the SSLCPL model. Compared with the CPL model, the tension with the CDM model is reduced a little bit for the SSLCPL model, indicating that the evidence for dynamical dark energy from DESI BAO data is contingent on cosmological models.
Acknowledgements.
This research is supported in part by the National Natural Science Foundation of China under Grant No. 12175184, the National Key Research and Development Program of China under Grant No. 2020YFC2201504 and the Chongqing Natural Science Foundation under Grant No. CSTB2022NSCQ-MSX1324.References
- Riess et al. [1998] A. G. Riess et al. (Supernova Search Team), Observational evidence from supernovae for an accelerating universe and a cosmological constant, Astron. J. 116, 1009 (1998).
- Perlmutter et al. [1999] S. Perlmutter et al. (Supernova Cosmology Project), Measurements of and from 42 High Redshift Supernovae, Astrophys. J. 517, 565 (1999).
- Weinberg [1989] S. Weinberg, The Cosmological Constant Problem, Rev. Mod. Phys. 61, 1 (1989).
- Aghanim et al. [2020a] N. Aghanim et al. (Planck), Planck 2018 results. VI. Cosmological parameters, Astron. Astrophys. 641, A6 (2020a), [Erratum: Astron.Astrophys. 652, C4 (2021)].
- Riess et al. [2022] A. G. Riess, L. Breuval, W. Yuan, S. Casertano, L. M. Macri, J. B. Bowers, D. Scolnic, T. Cantat-Gaudin, R. I. Anderson, and M. C. Reyes, Cluster Cepheids with High Precision Gaia Parallaxes, Low Zero-point Uncertainties, and Hubble Space Telescope Photometry, Astrophys. J. 938, 36 (2022).
- Adame et al. [2024] A. G. Adame et al. (DESI), DESI 2024 VI: Cosmological Constraints from the Measurements of Baryon Acoustic Oscillations, arXiv:2404.03002 .
- Chevallier and Polarski [2001] M. Chevallier and D. Polarski, Accelerating universes with scaling dark matter, Int. J. Mod. Phys. D 10, 213 (2001).
- Linder [2003] E. V. Linder, Exploring the expansion history of the universe, Phys. Rev. Lett. 90, 091301 (2003).
- Scolnic et al. [2022] D. Scolnic et al., The Pantheon+ Analysis: The Full Data Set and Light-curve Release, Astrophys. J. 938, 113 (2022).
- Rubin et al. [2023] D. Rubin et al., Union Through UNITY: Cosmology with 2,000 SNe Using a Unified Bayesian Framework, arXiv:2311.12098 .
- Abbott et al. [2024a] T. M. C. Abbott et al. (DES), The Dark Energy Survey: Cosmology Results with 1500 New High-redshift Type Ia Supernovae Using the Full 5 yr Data Set, Astrophys. J. Lett. 973, L14 (2024a).
- Cortês and Liddle [2024] M. Cortês and A. R. Liddle, Interpreting DESI’s evidence for evolving dark energy, arXiv:2404.08056 .
- Shlivko and Steinhardt [2024] D. Shlivko and P. J. Steinhardt, Assessing observational constraints on dark energy, Phys. Lett. B 855, 138826 (2024).
- Giarè et al. [2024] W. Giarè, M. Najafi, S. Pan, E. Di Valentino, and J. T. Firouzjaee, Robust preference for Dynamical Dark Energy in DESI BAO and SN measurements, J. Cosmol. Astropart. Phys. 10 (2024) 035.
- de Cruz Perez et al. [2024] J. de Cruz Perez, C.-G. Park, and B. Ratra, Updated observational constraints on spatially flat and nonflat CDM and XCDM cosmological models, Phys. Rev. D 110, 023506 (2024).
- Park et al. [2024] C.-G. Park, J. de Cruz Pérez, and B. Ratra, Using non-DESI data to confirm and strengthen the DESI 2024 spatially-flat CDM cosmological parameterization result, arXiv:2405.00502 .
- Roy [2024] N. Roy, Dynamical dark energy in the light of DESI 2024 data, arXiv:2406.00634 .
- Chatrchyan et al. [2024] A. Chatrchyan, F. Niedermann, V. Poulin, and M. S. Sloth, Confronting Cold New Early Dark Energy and its Equation of State with Updated CMB and Supernovae Data, arXiv:2408.14537 .
- Perivolaropoulos [2024] L. Perivolaropoulos, Hubble Tension or Distance Ladder Crisis?, arXiv:2408.11031 .
- Lu et al. [2024] X. Lu, S. Gao, and Y. Gong, The model-independent evidence of cosmic acceleration revisited, arXiv:2409.13399 .
- Linder [2024] E. V. Linder, Interpreting Dark Energy Data Away from , arXiv:2410.10981 .
- Payeur et al. [2024] G. Payeur, E. McDonough, and R. Brandenberger, Do Observations Prefer Thawing Quintessence?, arXiv:2411.13637 .
- Gao and Gong [2013] Q. Gao and Y. Gong, Constraints on slow-roll thawing models from fundamental constants, Int. J. Mod. Phys. D 22, 1350035 (2013).
- Gong and Gao [2014] Y. Gong and Q. Gao, On the effect of the degeneracy among dark energy parameters, Eur. Phys. J. C 74, 2729 (2014).
- Hu and Sugiyama [1996] W. Hu and N. Sugiyama, Small scale cosmological perturbations: An Analytic approach, Astrophys. J. 471, 542 (1996).
- Colgáin et al. [2024] E. O. Colgáin, M. G. Dainotti, S. Capozziello, S. Pourojaghi, M. M. Sheikh-Jabbari, and D. Stojkovic, Does DESI 2024 Confirm CDM?, arXiv:2404.08633 .
- Aghanim et al. [2020b] N. Aghanim et al. (Planck), Planck 2018 results. I. Overview and the cosmological legacy of Planck, Astron. Astrophys. 641, A1 (2020b).
- Abbott et al. [2024b] T. M. C. Abbott et al. (DES), The Dark Energy Survey: Cosmology Results with 1500 New High-redshift Type Ia Supernovae Using the Full 5 yr Data Set, Astrophys. J. Lett. 973, L14 (2024b).
- Gadbail et al. [2024] G. N. Gadbail, S. Mandal, and P. K. Sahoo, Gaussian Process Approach for Model-independent Reconstruction of f(Q) Gravity with Direct Hubble Measurements, Astrophys. J. 972, 174 (2024).
- Jimenez and Loeb [2002] R. Jimenez and A. Loeb, Constraining cosmological parameters based on relative galaxy ages, Astrophys. J. 573, 37 (2002).
- Simon et al. [2005] J. Simon, L. Verde, and R. Jimenez, Constraints on the redshift dependence of the dark energy potential, Phys. Rev. D 71, 123001 (2005).
- Stern et al. [2010] D. Stern, R. Jimenez, L. Verde, M. Kamionkowski, and S. A. Stanford, Cosmic Chronometers: Constraining the Equation of State of Dark Energy. I: H(z) Measurements, J. Cosmol. Astropart. Phys. 02 (2010) 008.
- Zhang et al. [2014] C. Zhang, H. Zhang, S. Yuan, T.-J. Zhang, and Y.-C. Sun, Four new observational data from luminous red galaxies in the Sloan Digital Sky Survey data release seven, Res. Astron. Astrophys. 14, 1221 (2014).
- Moresco et al. [2012] M. Moresco et al., Improved constraints on the expansion rate of the Universe up to z~1.1 from the spectroscopic evolution of cosmic chronometers, J. Cosmol. Astropart. Phys. 08 (2012) 006.
- Moresco [2015] M. Moresco, Raising the bar: new constraints on the Hubble parameter with cosmic chronometers at z 2, Mon. Not. R. Astron. Soc. 450, L16 (2015).
- Moresco et al. [2016] M. Moresco, L. Pozzetti, A. Cimatti, R. Jimenez, C. Maraston, L. Verde, D. Thomas, A. Citro, R. Tojeiro, and D. Wilkinson, A 6% measurement of the Hubble parameter at : direct evidence of the epoch of cosmic re-acceleration, J. Cosmol. Astropart. Phys. 05 (2016) 014.
- Ratsimbazafy et al. [2017] A. L. Ratsimbazafy, S. I. Loubser, S. M. Crawford, C. M. Cress, B. A. Bassett, R. C. Nichol, and P. Väisänen, Age-dating Luminous Red Galaxies observed with the Southern African Large Telescope, Mon. Not. R. Astron. Soc. 467, 3239 (2017).
- Borghi et al. [2022] N. Borghi, M. Moresco, and A. Cimatti, Toward a Better Understanding of Cosmic Chronometers: A New Measurement of H(z) at z 0.7, Astrophys. J. Lett. 928, L4 (2022).
- Gaztanaga et al. [2009] E. Gaztanaga, A. Cabre, and L. Hui, Clustering of Luminous Red Galaxies IV: Baryon Acoustic Peak in the Line-of-Sight Direction and a Direct Measurement of H(z), Mon. Not. R. Astron. Soc. 399, 1663 (2009).
- Chuang and Wang [2013] C.-H. Chuang and Y. Wang, Modeling the Anisotropic Two-Point Galaxy Correlation Function on Small Scales and Improved Measurements of , , and from the Sloan Digital Sky Survey DR7 Luminous Red Galaxies, Mon. Not. R. Astron. Soc. 435, 255 (2013).
- Blake et al. [2012] C. Blake et al., The WiggleZ Dark Energy Survey: Joint measurements of the expansion and growth history at z 1, Mon. Not. R. Astron. Soc. 425, 405 (2012).
- Busca et al. [2013] N. G. Busca et al. (BOSS), Baryon Acoustic Oscillations in the Ly- forest of BOSS quasars, Astron. Astrophys. 552, A96 (2013).
- Anderson et al. [2014] L. Anderson et al. (BOSS), The clustering of galaxies in the SDSS-III Baryon Oscillation Spectroscopic Survey: baryon acoustic oscillations in the Data Releases 10 and 11 Galaxy samples, Mon. Not. R. Astron. Soc. 441, 24 (2014).
- Oka et al. [2014] A. Oka, S. Saito, T. Nishimichi, A. Taruya, and K. Yamamoto, Simultaneous constraints on the growth of structure and cosmic expansion from the multipole power spectra of the SDSS DR7 LRG sample, Mon. Not. R. Astron. Soc. 439, 2515 (2014).
- Font-Ribera et al. [2014] A. Font-Ribera et al. (BOSS), Quasar-Lyman Forest Cross-Correlation from BOSS DR11 : Baryon Acoustic Oscillations, J. Cosmol. Astropart. Phys. 05 (2014) 027.
- Delubac et al. [2015] T. Delubac et al. (BOSS), Baryon acoustic oscillations in the Ly forest of BOSS DR11 quasars, Astron. Astrophys. 574, A59 (2015).
- Wang et al. [2017] Y. Wang et al. (BOSS), The clustering of galaxies in the completed SDSS-III Baryon Oscillation Spectroscopic Survey: tomographic BAO analysis of DR12 combined sample in configuration space, Mon. Not. R. Astron. Soc. 469, 3762 (2017).
- Alam et al. [2017] S. Alam et al. (BOSS), The clustering of galaxies in the completed SDSS-III Baryon Oscillation Spectroscopic Survey: cosmological analysis of the DR12 galaxy sample, Mon. Not. R. Astron. Soc. 470, 2617 (2017).
- Bautista et al. [2017] J. E. Bautista et al. (BOSS), Measurement of baryon acoustic oscillation correlations at with SDSS DR12 Ly-Forests, Astron. Astrophys. 603, A12 (2017).
- Foreman-Mackey et al. [2013] D. Foreman-Mackey, D. W. Hogg, D. Lang, and J. Goodman, emcee: The MCMC Hammer, Publ. Astron. Soc. Pac. 125, 306 (2013).
- Lewis [2019] A. Lewis, GetDist: a Python package for analysing Monte Carlo samples, arXiv:1910.13970 .