On the distribution of the time-integral of the geometric Brownian motion
Abstract.
We study the numerical evaluation of several functions appearing in the small time expansion of the distribution of the time-integral of the geometric Brownian motion as well as its joint distribution with the terminal value of the underlying Brownian motion. A precise evaluation of these distributions is relevant for the simulation of stochastic volatility models with log-normally distributed volatility, and Asian option pricing in the Black-Scholes model. We derive series expansions for these distributions, which can be used for numerical evaluations. Using tools from complex analysis, we determine the convergence radius and large order asymptotics of the coefficients in these expansions. We construct an efficient numerical approximation of the joint distribution of the time-integral of the gBM and its terminal value, and illustrate its application to Asian option pricing in the Black-Scholes model.
Key words and phrases:
Complex analysis, asymptotic expansions, numerical approximation1. Introduction
The distributional properties of the time integral of the geometric Brownian motion (gBM) appear in many problems of applied probability, actuarial science and mathematical finance. The probability distribution function is not known in closed form, although several integral representations have been given in the literature, as we describe next.
A closed form result for the joint distribution of the time integral of a gBM and its terminal value was obtained by Yor [34]. Denoting , where is a standard Brownian motion, this result reads
| (1) |
where is the Hartman-Watson integral defined by
| (2) |
and is a positive parameter. This is related to the Hartman-Watson distribution [14] which is defined by its probability density function .
Integrating (1) over gives an expression for the distribution of the time-average of the gBM as a double integral. For certain values of this can be reduced to a single integral [4]. Chapter 4 in [21] gives a detailed overview of the cases for which such simplifications are available.
The numerical evaluation of the integral (2) is challenging for small values of [1], which motivated the search for alternative numerical and analytical approximations. We summarize below limit theorems in the literature for the joint distribution of the time integral of the gBM and its terminal value.
An asymptotic expansion for the Hartman-Watson integral as at fixed was derived in [28]. The leading order of this expansion is
| (3) |
and depends on two real functions . The exact definition of and is technical and so we postpone it to Section 4.2, see formulas (57) and (60).
Upon substitution into (1), the expansion (3) gives the leading asymptotics of the joint distribution of the time-integral of a gBM and its terminal value
| (4) |
with
| (5) |
The function appears also in the asymptotic expansion of the log-normal SABR stochastic volatility model discretized in time, as the number of time steps under appropriate rescaling of the model parameters, see Sec. 3.2 in [29].
The application of Laplace asymptotic methods gives an expansion for the distribution function of the time integral of the gBM, see Proposition 4 in [28]
| (6) |
where is given in Proposition 4 of [28] and .
1.1. Literature review on the small time asymptotics of the distribution of
In order to put these results into context, we summarize briefly the known short maturity asymptotics of the continuous time average of the geometric Brownian motion . Dufresne [5] proved convergence in law of this quantity to a normal distribution, see Theorem 2.1 in [5]
| (7) |
This can be formulated equivalently as a log-normal limiting distribution in the same limit, see Theorem 2.2 in [5]. The log-normal approximation for the time-integral of the gBM is widely used in financial practice, see [5] for a literature review. When applied to the pricing of Asian options, this is known as the Lévy approximation [17].
The log-normal approximation is also used for the conditional distribution of at given terminal value of the gBM, as discussed for example in [22, 23]. This conditional distribution appears in conditional Monte Carlo simulations of stochastic volatility models [33], see [2] for an overview and recent results.
The result (7) can be immediately extended to the joint distribution of with . We state it without proof which can be given along the lines of the proof of Theorem 2.1 in [5].
Proposition 1.1.
Denote with .
As we have:
| (8) |
where and
| (9) |
The covariance matrix is computed as (with and )
| (10) | |||
| (11) | |||
| (12) |
In other words, as , the joint distribution of approaches a bivariate normal distribution with correlation . In analogy with Theorem 2.2 in [5], this result can be formulated equivalently as a bivariate log-normal limiting distribution.
Another asymptotic result in the limit is the large deviations property of the time-average . Using large deviations theory methods it was showed in [26] that, for a wide class of diffusions which includes the geometric Brownian motion, the time average of the diffusion satisfies a large deviations property in the small time limit, see Theorem 2 in [26]. For the particular case of a gBM this result reads, in our notations
| (13) |
with a rate function given in closed form in Proposition 12 of [26]. For convenience the result is reproduced below in Eq. (22). In contrast to the fluctuations result of (7) which holds in a region of width around the central value , the large deviations result (13) holds for .
1.2. Complete leading small time asymptotics
The explicit asymptotic result (4) for the small time asymptotics of the joint distribution of satisfies all these limiting results and improves on them by including all contributions up to terms of . It is instructive to see explicitly the connection to the asymptotic results presented above.
The exponential factor in (6) reproduces the large deviations result (13) by identifying . The emergence of the log-normal limit implied by Proposition 1.1 can be also seen explicitly by expanding the exponent in (4) around using the results of Propositions 2 and 3 in [28]. Keeping the leading order terms in the expansion of in powers of gives the quadratic approximation
| (14) |
The joint distribution (4) is thus approximated in a neighborhood of as
where the in the exponent are the error terms in (14) and we defined
| (16) |
Up to the factor and the error terms in the exponent, the expression (1.2) coincides with a log-normal bivariate distribution in variables . Recall the bivariate normal distribution of two random variables with volatility and correlation parameters
| (17) |
The density (1.2) corresponds to parameters
| (18) |
These parameters correspond precisely to the covariance matrix appearing in the fluctuations result of Proposition 1.1.
Improving on the log-normal approximation (1.2) requires adding higher order terms in the coefficient and in the exponent. All these corrections are expressed in terms of which can be evaluated by expansion around . In this paper we present series expansions of in powers of that can be used for such evaluation, and we study in detail their properties. We determine their convergence radii and coefficient asymptotics in Proposition 4.2. We note that alternative series expansions which improve on the log-normal approximation have been considered in the literature (in the context of the expansion of the density of ), based on Gram-Charlier series [6].
Although closed form results are available for the functions , they are inefficient for practical use because of the need to solve one non-linear equation for each evaluation. The series expansions for allow much faster and reliable numerical evaluation, inside their convergence domain. In Section 5 we construct efficient numerical approximations for , based on the series expansions derived here within the convergence domain, which are easy to use in numerical applications. This gives a numerical approximation for the joint distribution of the time integral of the gBM and its terminal value, which appears in many problems of mathematical finance, such as the simulation of the SABR model [3] and option pricing in the Hull-White model [15]. As an application we discuss the numerical pricing of Asian options in the Black-Scholes model, and demonstrate good agreement with standard benchmark cases used in the literature.
2. Preliminaries
The mathematics of the series expansions for the functions involves the study of the analyticity domain and of the singularities of a function defined through the inverse of a complex entire function. Such functions appear in several problems of applied probability, for example in applications of large deviations theory to the short maturity asymptotics of option prices in stochastic volatility models [9] and Asian options in the local volatility model [26, 27]. A similar problem is encountered in the evaluation of functions defined by the Legendre transform of a function
| (19) |
where is the solution of the equation . If the optimizer can be found exactly at one particular point , then expansion of around gives a series expansion for in which can be used for numerical evaluation of the Legendre transform.
For definiteness, consider the evaluation of the rate function appearing in the short maturity asymptotics of the distribution of the time-average of the gBM. This determines also the leading short maturity asymptotics of Asian options in the Black-Scholes model111More precisely, in the short maturity limit the prices of out-of-the-money Asian options approach zero at an exponential rate , determined by the rate function .. The rate function can be computed explicitly [26] and is given by , defined by
| (22) |
where is the solution of the equation
| (23) |
and is the solution in of the equation
| (24) |
See Proposition 12 in [26]. The function vanishes at and can be expanded in a series of powers of and , see [26]222Similar expansions were given for the rate functions of forward start Asian options in [27].. In practical applications one is interested in the range and rate of convergence of these series expansions. We answer these questions in Proposition 4.1.
Section 3 studies the analyticity properties of the complex inverse of the function determining in (22). These properties are used in Section 4 to study the singularity structure of the rate function and of the functions appearing in Eq. (3). The nature of the singularity on the circle of convergence determines the large-order asymptotics of the coefficients of the series expansions of a complex function around a regular point. This is made precise by the transfer results (see Flajolet and Odlyzko [7, 8]) which relate the expansions around the singular point to the large-order asymptotics of the expansion coefficients. We apply these results in Section 4 to derive the leading large-order asymptotics of the expansion coefficients for the functions and around , see Proposition 4.2. Besides the rigorous proofs, numerical tests also confirm a general decreasing trend of the error terms of the leading order asymptotics for the expansion coefficients.
3. On the complex inverse of
An important role in the study of the expansions considered in this paper is played by the singularities of a function defined through the inverse of another function, as in the rate function , see Eq. (22). The main issues appear already in the study of the functions . For this reason, we discuss the analytic structure of these functions in details in this section.
Let
| (25) |
Clearly, is an entire function with Taylor series around zero given by
| (26) |
We want to make sense of the inverse of , restricted to some complex domains. First observe that the equation has a unique real solution and infinitely many complex solutions. This shows that is not invertible on the entire complex plane. In this section we discuss how to make sense of an inverse. Although the results will not surprise experts in complex analysis, this question has not been discussed in the present context before.
3.1. Local analysis
Let us now restrict to a small neighborhood of the origin. Then the range of is in a small neighborhood of . Clearly, is not locally invertible as is an even function, that is , and thus is not injective. A natural way to make the function at least locally invertible is to define
| (27) |
In light of (26), we have . Here, and in the sequel, unless stated otherwise, the notation will only be used in the argument of even functions so as both values of give the same result. Recall the following simple fact: if , then there is a small neighborhood of so that is biholomorphic (see for example Theorem 3.4.1 in [30]). Since , is locally invertible at zero. We also note that is an entire function as its Taylor series converges everywhere. We will show next that is surjective. One says that an entire function has finite order if constants can be found such that for all . See for example Chapter 5 in [31] and Section 1.3 in [16] for a detailed discussion of entire functions of finite order.
The order of the entire function can be expressed in terms of the coefficients of its Taylor expansion as, see Theorem 2 in Sec. 1.3 of [16]
Using the expansion (27) it follows that the function has order . Any entire function with order is surjective, see Section 5.1 of [16]. Since in our case , is surjective.
We study next the critical points of and which are given by the zeros of and , respectively. To identify the zeros of , let us write for the non-negative solutions of the equation (and note that all real solutions are given by with ). We also write
| (28) |
(see Table 1 for the numerical values for ). Now we have
Lemma 3.1.
The zero sets of and are given by
Proof.
If , then the equation reduces to , whose solutions are exactly the numbers , . In case , we see by (26) that . The first statement follows. For the second statement, observe that and . ∎
Lemma 3.2.
For every , .
Proof.
Since maps to , in this proof we will denote by for the square root function from to . By Lemma 3.1, , that is . Next, we compute
Assuming , we obtain which is a contradiction with as . ∎
We note that for all . Furthermore, , and for all .
Let be the open -neighborhood of the set and . Now we are ready to state the analyticity of the local inverse of on the region that is most important for our applications.
Theorem 3.1.
There is a function , analytic on so that and for all .
Proof.
Fix an arbitrary . It suffices to show that can be defined analytically on . First observe that the real interval is being mapped, under the function , to the real interval for suitable . Furthermore, the derivative of is non-zero on . Thus restricting the domain of to a small neighborhood of , the restricted function provides a bijection between a neighborhood of and a neighborhood of . More precisely, since the derivative of on is non-zero, for every there is some so that can be analytically inverted on . By compactness of , we can choose a finite cover of by the sets showing that the inverse function is well defined on a small neighborhood of .
Next we extend the function analytically to the ball . This can be done by a standard procedure. Recall that a point is an asymptotic value of if there is a curve tending to so that az along . Furthermore, if , then is a critical value. The singularity set is defined as the union of asymptotic values and critical values. It is known that for any open set that is disjoint to the singularity set, the map is a covering (see [25]).
In our case, we have already identified the set of critical values . An elementary computation shows that the only asymptotic value is . Now let (where is the closure of ). Then is open and so is a covering. This implies that along any simple polygonal arc starting from and staying inside , has an analytic extension. Indeed, by the covering map property, every has a neighborhood so that is a union of disjoint open sets, each of which is mapped homeomorphically onto U by . Let us now choose a finite cover of by neighborhoods so that and and by induction on we can extend analytically to . Observing that is simply connected, the result now follows from the monodromy theorem.
∎
3.2. Global analysis
Theorem 3.1 tells us that the inverse can be defined with . Furthermore, is analytic and the Taylor expansion
| (29) |
has a radius of convergence of at least . We note that the inverse can be defined in the sense of a sheaf (also known as global analytic function, or Riemann surface). In this general sense, has a second order algebraic branch point at by Lemma 3.2. Thus the function cannot be analytically extended to and so the power series (29) has radius of convergence exactly . We will be mostly interested in this expansion (see Section 3.4). However, for completeness we first discuss how to visualize the sheaf .
First, observe that can be analytically extended to , where is any curve starting at and tending to (for example ; however as we will see later, sometimes other choices are more convenient). Indeed, replacing by
in the last step of the proof of Theorem 3.1 and noting that this domain is simply connected, analyticity of follows (of course the expansion (29) is not valid on the larger domain). The function can be identified with a chart of the Riemann structure of the sheaf (in this identification, its domain is sometimes referred to as Riemann sheet).
Next, we can define another analytic function on , where . Since the function has a zero of order at , we can extend analytically from
to
Let the resulting function be denoted by . Clearly, takes values in a small neighborhood of and since there is a branch point at , for with , . Now observe that . Since the branch point is of order , we conclude that for as above has to be real, and slightly bigger than . Thus we can extend analytically to where and . Now restrict to
and denote this restriced function by . Then can be extended analytically to by the monodromy theorem as in the proof of Theorem 3.1.
Furthermore, we can ”glue together” the domains of and along since and the gluing is analytic (see the analyticity of and the fact that the branch point is algebraic of order ). Since preserves the real line and all branch points are of second order, this construction can be continued inductively, i.e. we can define the Riemann sheet by and glue together with the sheets along . This gives a complete elementary description of the sheaf .
3.3. Visualizing the sheaf
For better visualization of the sheaf constructed in the previous section, we include some figures. We start with listing the numerical values of the first few critical points , , and (the latter will be needed later) in Table 1.
| 1 | 4.4934 | -20.19 | -0.2172 | 3.4929 |
|---|---|---|---|---|
| 2 | 7.7252 | -59.68 | 0.1284 | 2.0528 |
| 3 | 10.9041 | -118.90 | -0.0913 | 3.9494 |
| 4 | 14.0662 | -197.86 | 0.0709 | 2.6463 |
| 5 | 17.2208 | -296.55 | -0.0580 | 4.2402 |

Given , there may be infinitely many ’s so that . A plot of some of these ’s for are shown in Fig. 3.1 (note that both and are real). The first branch corresponds to when . On this branch . We call this Riemann sheet the principal branch. The second branch corresponds to , where , and the -th branch corresponds to , where is in between and .
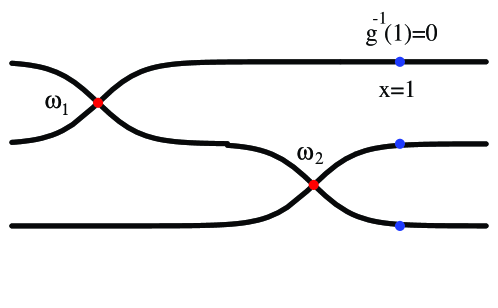
Figure 3.2 is a schematic representation of the first three Riemann sheets. This figure illustrates the apparently counterintuitive result that, although the branch point at is closer to than the branch point at , it is the latter which determines the radius of convergence of the series expansion around , rather than the former. The explanation for this fact is that the branch point at is not “visible” on the main Riemann sheet, and thus the branch point at is the dominant singularity around .
3.4. Properties of the Taylor series
Next, we study the coefficients of the Taylor expansion (29). The first few coefficients are easily computed by the Lagrange inversion theorem using (27) and Theorem 3.1. In particular, we obtain
| (30) |
Writing we can also expand as a series in (here, means the principal value of the logarithm). In applications to Asian options pricing [26], the parameter is related to the option strike. In practice, it is usual to expand implied volatilities in log-strike, which corresponds to expanding in . See for example [11].
Explicitly computing high order terms of these expansions is difficult (cf. [24], pages 411-413). However, we can study the asymptotic properties of the sequences and .
Proposition 3.1.
(ii) The Taylor expansion (3.4) has a radius of convergence . Furthermore, the coefficients satisfy
| (33) |
where .


Proof.
(i) We first prove (32). The asymptotics of the coefficients for depend on the nature of the singularity on the circle of convergence. The leading asymptotics of around this singularity can be translated into asymptotics for the coefficients of the series expansion using the ”transfer results” (see Flajolet and Odlyzko [7, 8]). Theorem VI.1 and VI.3 of [8] imply that if is analytic on where and furthermore
| (34) |
as , 333Here means an analytic function on whose square is then (32) holds with
| (35) |
We defined here . With this definition, is continuous at (of course there is no open neighborhood of where is defined).
Indeed, Theorem VI.1 of [8] says that the Taylor coefficients of the function have the large asymptotics . The term is a polynomial and so it has a finite Taylor expansion and by Theorem VI.3 of [8], the Taylor coefficients of are of . We obtain (35) by rescaling the singularity from to .
To finish the proof of (32), it remains to verify (34). We will prove that is an algebraic branch point of order 2, meaning that near , the function “behaves like a branch of the square root function near ” . This behavior results from the inversion of the function around the critical point . It is known, see for example Theorem 3.5.1 in [30], that the inversion of a non-constant analytic function around a point with gives a multi-valued function which can be expanded in a convergent series in fractional powers of with , called a Puiseux series.
To make these statements mathematically precise, first note that can be analytically defined on exactly as in Section 3.2 (replacing by . With a slight abuse of notation we also denote this function by .) Then by Theorem 3.5.1 in [30] there is some and an analytic function on so that (i.e. is one branch of the square root function) and another function , analytic on with , so that for all . Furthermore, the function has a Pusieux expansion on , that is
(ii) First we prove that the Taylor expansion (3.4) has a radius of convergence . First note that the right hand side of (3.4) converges to an analytic function if . Indeed, in this case, and so is well defined as is analytic on . Now we claim that can be analytically extended to . To prove this claim, let and . Let us denote by the upper half plane, that is . Now observe that the image of under the exponential function is disjoint to for small enough. Thus defining with the branch cut , is well defined and analytic for . Likewise, we can analytically extend to using the branch cut in the definition of . Clearly, there are singularities at as . Thus we have verified that the right hand side of (3.4) converges to an analytic function on .
Next, we prove (33). The new feature here is the presence of two singularities on the circle of convergence in the complex plane, with radius . This situation is discussed in Chapter VI.5 of [8]. One feature specific to this situation is the oscillatory pattern of the leading asymptotics for the coefficients of the series expansion (3.4).
From (34), we have for
Applying again the transfer result, we obtain
| (38) |
which reproduces (33) after substituting here .
∎
We present next some numerical tests of these asymptotic results. In Fig. 3.3 (left) we plot vs for the first 100 terms of the series (30) (left panel) and vs for the first 100 terms of the series (3.4) (right panel). The red lines in these plots are at (left) and (right). The general trend as is towards the limiting result shown by the red lines is consistent with Proposition 3.1.
4. Applications: Series expansions
We apply in this section the results of the previous section to two specific expansions appearing in mathematical finance which were discussed in the Introduction.
4.1. The rate function
The rate function appears in the small-time asymptotics for the density of the time average of a gBM, and determines the leading short maturity asymptotics for Asian options in the Black-Scholes model. The explicit form of this function for real positive argument was given above in equation (22). Complexifying the function and denoting the complex variable by , can be written as
| (39) |
where is the function introduced in Theorem 3.1, and we define
Note that is well defined as the function is even.
Proposition 4.1.
(i)The series expansion of the rate function has convergence radius . The first few terms are given by
| (40) |
and the asymptotics of the coefficients are given by
| (41) |
(ii) The series expansion around converges for . The first few terms are
| (42) |
The large asymptotics of the coefficients is
| (43) |
with and .
Proof.
(i) First, observe that the function has isolated singularities (simple poles) along the real negative axis at for , and is analytic everywhere else.
The residues of at the simple poles are . Recall that by Theorem 2.1, is analytic on . Thus for any with , the function is analytic at . Noting that the only solution of the equation is , we conclude that is analytic on and has a singularity at . Thus .
Next, we prove (41). In order to apply the transfer results (cf. Flajolet and Odlyzko) we need to study the behavior of around the singularity on the circle of convergence. This is a simple pole at , so it is sufficient to compute its residue.
Recall that . Thus, as we have
| (44) |
The Taylor expansion of around is
| (45) |
where and
| (46) |
To derive (41), we write the Laurent series of on a punctured ball around as . With the notation , we see that is analytic in a neighborhood of and
| (48) |
By uniqueness of analytic extension,
is analytic and (48) holds on the domain .
Transferring this result to the asymptotics of the coefficients
yields (41).
(ii) To prove the second part of the proposition, let us write . By the first part of the proposition, is analytic as long as is analytic at . Indeed, since for all complex numbers , the only singularities of are due to singularities of .
The equation has infinitely many solutions of the form . Let us write and for the singularities which are closest to the origin . Then, exactly as in the proof of Proposition 3.1, we see that is analytic on and there are branch points at . The picture is now similar to that of Proposition 2.1 (ii) and is different from point (i) discussed above as the singularities closest to the origin are branch points (and are not isolated).
It remains to verify (43). We again use the transfer results (cf. [7]). As in the proof of Proposition 3.1, we define . Next, we consider the Taylor expansion of around (recall that is analytic at ).
First, we claim that . Indeed, for any with , we have and so
Thus we have the Taylor expansion
| (49) |
as . Substituting here and using the Puiseux expansion (34) gives an expansion of the form
| (50) |
as . The coefficients in this expansion can be obtained in terms of the derivatives of and in (34) by expanding for close to .
The branch point singularity arises from the second term in (50) with coefficient
| (51) |
Finally, changing the expansion variable from to with is done in the same way as in the proof of Proposition 3.1(ii). The transfer result now says that the Taylor coefficients of the function satisfy
| (52) |
Thus
| (53) |
whence (43) follows by substituting .
∎
The left plot in Figure 4.1 shows vs for the first 100 coefficients of the expansion in , which illustrates convergence to , the inverse of the convergence radius in (42).
We study also the approximation error of the asymptotic expansion of the (signed) coefficients
| (54) |
where we denoted the leading asymptotic expression for the coefficients in Eq. (43). The error is formally of order , so we expect that vs approaches zero linearly.
The right plot in Figure 4.1 shows vs , which confirms the expected general trend towards zero of the error terms. This is seen in more detail in the left plot in Figure 4.2 which zooms into the region close to the horizontal axis.
We note also the presence of large error outliers. For example for the relative error is such that the subleading correction to the asymptotic result can be comparable with the leading order coefficient. The right plot in Fig. 4.2 shows the error vs which shows that large errors are mostly associated with small values of the cos factor, which leads to accidental suppression in the leading order contribution.


4.2. Asymptotics of the Hartman-Watson distribution
A closed form result for the joint distribution of the time integral of the gBM and its terminal value was obtained by Yor [34], see (1).
The numerical evaluation of the integral in (2) is challenging for small . Alternative ways of numerical evaluation of this distribution have been studied in terms of analytic approximations [1, 13].
An asymptotic expansion for the Hartman-Watson distribution as at fixed was derived in [28]. The leading order result is expressed by (3) and the real functions are defined as
| (57) |
and
| (60) |
Here is the positive solution of the equation
| (61) |
and is the solution of the equation
| (62) |
The constraints on and ensure that is positive for positive real .
We will study in this section the series expansions of and around , which are relevant for the computation of the distribution (4) around its maximum at .
We mention that the functions are related as . This relation follows from Proposition 6 in [28] and the relation . However it does not seem easy to use this relation to connect the expansions of these two functions, so we treat them separately.
The functions are related to the function studied in Section 3 as for and for , with the usual square root function from to .
Proposition 4.2.
(i) The function is expanded around as . The first few terms are
| (63) |
The large asymptotics of the coefficients is
| (64) |
with .
ii) The function has the expansion around as . The first few terms are
| (65) |
The large asymptotics of the coefficients is
| (66) |
with .
Both series expansions converge for .
Proof.
(i) The function can be written as with . Now the situation (and hence the proof) is similar to Proposition 4.1.
The function has poles at , and is analytic everywhere else. Solving the equation we find that the unique solution is . Thus the function is analytic on and can be extended analytically to as in Proposition 4.1.
In order to find the large asymptotics of we study again the asymptotics of around its branch points at . This requires the Taylor expansion of around which is a regular point for this function. The analysis closely parallels that in Prop. 4.1(ii). It turns out that , just as for and so the expansion of around reads
| (67) |
Substituting here the Puiseux expansion (34) gives that the leading singularity is a branch point at arising from the second term in the expansion
| (68) |
where
| (69) |
Changing variables to gives a similar Puiseux expansion in fractional powers of . The asymptotics of the coefficients follows again by the transfer result
| (70) |
and has the form (64) with
| (71) |
(ii) The function can be written as , where we defined
| (72) |
Writing the numerator in this form ensures that is positive for real and positive , which is the case required for the application to the asymptotics of the Hartman-Watson distribution (3). (This condition was ensured in the original expression by imposing the constraints and .) This condition replaces the even property of which was used to resolve the sign ambiguity before.
The function has branch points on the negative real axis at where the denominator in (72) vanishes. The branch point closest to the origin is at and will be relevant for our purpose as is mapped to , the branch point of .
In the neighborhood of the function diverges as
| (73) |
The asymptotics of around are obtained by substituting the Puiseux series (34) into (73). Denoting for simplicity, we have as
| (74) |
This asymptotics can be transferred to the large asymptotics of the coefficients as
| (75) |
We chose the branches of the functions such that they add up to a real function along the positive real axis. This introduces a minus sign between the two terms. This reproduces the stated result, with
| (76) |
∎
We present next some numerical tests of the asymptotic expansions for and . Figures 4.3 and 4.4 illustrate the performance of the asymptotic expansions for these two functions. They are similar, so we comment in detail only the plots for .
The left plot in Figure 4.3 shows vs , which shows good convergence to , which is the inverse of the convergence radius for the expansion (63). The right plot shows the approximation error of the asymptotic expansion of the coefficients vs , where is the first term on the right hand side of (64). The numerical results confirm a general decreasing trend of the approximation error with as expected.


5. Application: Asian options pricing in the Black-Scholes model
Here, we provide a simple application of the expansions studied in this paper, namely the pricing of an Asian option in the Black-Scholes model. Assume that the asset price follows a geometric Brownian motion
| (77) |
started at , or equivalently, by Itô’s formula, . Of course, in practice one has to consider the issue of mis-specification of the price process, which introduces model risk.
Asian option prices are given by expectations in the risk-neutral measure
| (78) | |||
| (79) |
and stand for call and put options and the subscript denotes Asian.
Using the self-similar property of the Brownian motion, the Asian option prices can be expressed in terms of expectations of the standardized integral of gBM as
| (80) |
where
| (81) |
and the expectations in (81) are expressed in terms of reduced parameters
| (82) |
see e.g. [12]. Denote the density of the standardized time-average of the gBM
| (83) |
The leading asymptotics (4) gives an approximation for this density
| (84) |
where is a normalization integral, defined such as to ensure the normalization condition for all .
Recalling (5), the expectations (81) can be approximated as integrals over the density as
| (85) | |||
and analogously for .
The normalization factor can be expressed as a one-dimensional integral
| (86) |
5.1. Details of implementation
For the purpose of evaluation of the integrals in (85) we represent the functions as follows:
i) within the convergence domain of their expansions (63) and (65) we use the series expansions derived in Proposition 4.2, truncated to an appropriate order .
ii) outside the convergence domain we use the asymptotic expansions derived in points (i),(ii) Propositions 4 and 5 of [28] for as and , respectively.
This gives the following approximation for the functions , defined by
| (87) |
and
| (88) |
where with the convergence radius of the series expansions. denote the asymptotic expansions given in equations (49) and (58) of [28] and denote the asymptotic expansions given in equations (50), (59) of [28]. The first few coefficients are tabulated in Table 2. The approximation can be made arbitrarily precise by increasing the truncation orders and by including higher order terms in the tail asymptotics.
| 1 | 1 | 6 | |||
|---|---|---|---|---|---|
| 2 | 1 | 7 | |||
| 3 | 8 | ||||
| 4 | 9 | ||||
| 5 | 10 |
5.2. Numerical examples
We illustrate the application of the method on the seven test cases introduced in [10] and commonly used in the literature as benchmark tests for Asian options pricing. Table 3 shows the option prices following from the method proposed here for each of these scenarios, comparing with the precise evaluation in Linetsky [20] obtained using the spectral expansion method.
| Scenario | spectral [20] | |||||||||
|---|---|---|---|---|---|---|---|---|---|---|
| 1 | 2.0 | 0.02 | 0.10 | 1 | 3 | 0.0025 | 0.055986 | 0.028543 | 1.00004 | 0.055954 |
| 2 | 2.0 | 0.18 | 0.30 | 1 | 3 | 0.0225 | 0.218387 | 0.130771 | 1.00032 | 0.218388 |
| 3 | 2.0 | 0.0125 | 0.25 | 2 | -0.6 | 0.03125 | 0.172269 | 0.088354 | 1.00045 | 0.172269 |
| 4 | 1.9 | 0.05 | 0.50 | 1 | -0.6 | 0.0625 | 0.193174 | 0.106978 | 1.00089 | 0.193174 |
| 5 | 2.0 | 0.05 | 0.50 | 1 | -0.6 | 0.0625 | 0.246416 | 0.12964 | 1.00089 | 0.246415 |
| 6 | 2.1 | 0.05 | 0.50 | 1 | -0.6 | 0.0625 | 0.306220 | 0.153432 | 1.00089 | 0.306220 |
| 7 | 2.0 | 0.05 | 0.50 | 2 | -0.6 | 0.125 | 0.350095 | 0.193799 | 1.00177 | 0.350093 |
We used an approximation for keeping terms in the series expansion. Adding more terms has no impact on the numerical values shown. The series expansion was used in the range which is included in the convergence domain of the series expansions. The impact of the tails region on the results in Table 3 is negligible.
For the numerical evaluation we changed the integration variable to in both integrals in (85) and (86). The 2-dimensional integration was performed in Mathematica using NIntegrate with Method -> NewtonCotesRule and MaxIterations -> 100.
The results in Table 3 show good agreement with the precise benchmark values of [20], the difference being less than 1% in all cases. For most scenarios, the impact of including terms beyond quadratic order in the joint distribution (4) is larger than the impact of varying the volatility parameter by , which makes them relevant in practical applications where is known with precision of this order of magnitude.
Acknowledgments. We thank two anonymous referees for helpful comments and suggestions. The research of PN was partially sponsored by NSF DMS 1952876 and the Charles Simonyi Endowment at the Institute for Advanced Study, Princeton, NJ.
References
- [1] P. Barrieu, A. Rouault and M. Yor, A study of the Hartman-Watson distribution motivated by numerical problems related to the pricing of Asian options, J. Appl. Probab. 41, 1049-1058 (2004).
- [2] R. Brignone, Moment based approximations for arithmetic averages with applications in derivatives pricing, credit risk and Monte Carlo simulation, PhD thesis, University of Milano-Bicocca, 2019.
- [3] N. Cai, Y. Song and N. Chen, Exact simulation of the SABR model, Operations Research 65(4), 931-951 (2017).
- [4] D. Dufresne, The integral of geometric Brownian motion, Adv. Appl. Probab. 33, 223-241 (2001)
- [5] D. Dufresne, The log-normal approximation in financial and other computations, Adv. Appl. Probab. 36, 747-773 (2004)
- [6] D. Dufresne and H.-B. Li, Pricing Asian options: Convergence of Gram-Charlier series, Actuarial Research Clearing House 2016.2
- [7] P. Flajolet and A. Odlyzko, Singularity analysis of generating functions, SIAM J. Disc. Math. 3(2), 216-240 (1990)
- [8] P. Flajolet and R. Sedgewick, Analytic combinatorics, Cambridge University Press, Cambridge, 2008
- [9] M. Forde and A. Jacquier, Small-time asymptotics for the implied volatility under the Heston model, IJTAF 12(6), 861-876 (2009)
- [10] M. Fu, D. Madan and T. Wang, Pricing continuous time Asian options: a comparison of Monte Carlo and Laplace transform inversion methods, J. Comput. Finance 2 49-74 (1998)
- [11] J. Gatheral, The volatility surface Wiley, 2006.
- [12] H. Geman and M. Yor, Bessel processes, Asian options and perpetuities, Mathematical Finance 3, 349-375 (1993)
- [13] S. Gerhold, The Hartman-Watson distribution revisited: Asymptotics for pricing Asian options, J. Appl. Probab. 48, 892-899 (2011).
- [14] P. Hartman and G.S. Watson, ”Normal” distribution functions on spheres and the modified Bessel functions, Ann. Probab. 2, 593-607 (1974)
- [15] J. Hull and A. White, The pricing of options on assets with stochastic volatilities, Journal of Finance 42(2), 281-300 (1987)
- [16] B.Y. Levin, Lectures on Entire Functions Translations of Mathematical Monographs 150, AMS (1996).
- [17] E. Levy, Pricing European average rate currency options, J. Internat. Money Finance 11, 474-491 (1992)
- [18] A. Lewis, Option valuation under stochastic volatility, Finance Press, 2000.
- [19] A. Lewis, Option valuation under stochastic volatility, vol. 2. Finance Press, 2016.
- [20] V. Linestky, Spectral expansions for Asian (Average price) options, Operations Research 52 856-867 (2004)
- [21] H. Matsumoto and M. Yor, Exponential functionals of Brownian motion: I. Probability laws at fixed time, Prob. Surveys 2, 312-347 (2005)
- [22] W.A. McGhee, “An Efficient Implementation of Stochastic Volatility by the Method of Conditional Integration with Application to the exponential Ornstein-Uhlenbeck stochastic volatility and SABR models”, RBS Internal Paper, December 2010.
- [23] W. A. McGhee. “An Efficient Implementation of Stochastic Volatility by the Method of Conditional Integration”. ICBI Global Derivatives and Risk Management, April 2011.
- [24] P.M. Morse and H. Feshbach, Methods of Theoretical Physics, Part I. New York: McGraw-Hill, 1953.
- [25] R. Nevanlinna, Analytic functions, Springer, Berlin-Heidelberg - New York, 1970.
- [26] D. Pirjol and L. Zhu, Short maturity Asian options in the local volatility model, SIAM J. Financial Math. 7(1), 947-992 (2016); arXiv:1609.07559[q-fin.PR]
- [27] D. Pirjol, J. Wang and L. Zhu, Short maturity forward start Asian options in the local volatility model, Applied Mathematical Finance 26(3), 187-221 (2019); arxiv:1710.03160[q-fin.PR]
- [28] D. Pirjol, Asymptotic expansion for the Hartman-Watson distribution, Methodology and Computing in Applied Probability (2020), https://doi.org/10.1007/s11009-020-09827-5; arXiv:2001.09579[math.PR]
- [29] D. Pirjol and L. Zhu, Asymptotics of the time-discretized log-normal SABR model: The implied volatility surface, Probability in Engineering and Computational Sciences (2020); arXiv:2001.09850[q-fin.MF]
- [30] B. Simon, A Comprehensive Course in Analysis, II.A Basic Complex Analysis, American Mathematical Society 2017.
- [31] E.M. Stein and R. Shakarchi, Complex Analysis, Princeton Lectures in Analysis II, Princeton University Press, 2003
- [32] E.T. Whittaker and G.N. Watson, A course of modern analysis, Cambridge University Press, Fourth Edition 1964
- [33] G.A. Willard, Calculating prices and sensitivities for path-independent derivative securities in multifactor models, Journal of Derivatives 5(1), 54-61 (1997)
- [34] M. Yor, On some exponential functionals of the Brownian motion, J. Appl. Prob. 24(3), 509-531 (1992)