Observation of heat scaling across a first-order quantum phase transition in a spinor condensate
Abstract
Heat generated as a result of the breakdown of an adiabatic process is one of the central concepts of thermodynamics. In isolated systems, the heat can be defined as an energy increase due to transitions between distinct energy levels. Across a second-order quantum phase transition (QPT), the heat is predicted theoretically to exhibit a power-law scaling, but it is a significant challenge for an experimental observation. In addition, it remains elusive whether a power-law scaling of heat can exist for a first-order QPT. Here we experimentally observe a power-law scaling of heat in a spinor condensate when a system is linearly driven from a polar phase to an antiferromagnetic phase across a first-order QPT. We experimentally evaluate the heat generated during two non-equilibrium processes by probing the atom number on a hyperfine energy level. The experimentally measured scaling exponents agree well with our numerical simulation results. Our work therefore opens a new avenue to experimentally and theoretically exploring the properties of heat in non-equilibrium dynamics.
In quantum mechanics, at zero temperature, when we drive an isolated system by tuning a system parameter, if the driving rate is so slow such that the process is adiabatic, the transition between energy levels cannot occur, and heat cannot be created. Yet, when the system undergoes a second-order QPT during the process, the relaxation time diverges and thus adiabaticity cannot be maintained. As a result, transition between energy levels does occur, producing the heat Polkovnikov2008PRL ; Polkovnikov2008NP . In fact, across the transition point, the physics can be described by the quantum Kibble-Zurek mechanism (KZM) and universal scaling laws for various quantities, such as the temporal onset of excitations, the density of defects and the heat, are predicted polkovnikov2011colloquium ; de2010adiabatic . While important aspects of the quantum KZM have been experimentally observed chen2011quantum ; Chapman2016PRL ; clark2016universal ; zhang2017defect ; Nature2019Lukin ; Qiueaba7292 , the experimental measurement of the heat still remains a significant challenge.
Such non-equilibrium dynamics is of crucial importance ranging from cosmology to condensed matter kibble1980some ; zurek1985cosmological ; PhysRevLett.95.035701 ; zurek2005dynamics ; PhysRevB.72.161201 . Yet the existence of scaling laws is not limited to non-equilibrium dynamics across a second-order QPT. It has been predicted that the scaling of some quantities can also occur across a first-order QPT where multiple phases coexist panagopoulos2015off ; Zhong2017PRE ; coulamy2017dynamics ; pelissetto2017dynamic ; Shimizu_2018 . In particular, very recently, the KZM has been generalized to account for a power-law scaling of the temporal onset of spin excitations present in a spinor condensate across the first-order QPT Qiueaba7292 . The generalized KZM (GKZM) has also been experimentally observed in a spinor condensate Qiueaba7292 . Similar to a second-order QPT, it is natural to ask whether the heat can still exhibit a power-law scaling across the first-order QPT.
A spinor Bose-Einstein condensate (BEC), described by a vector order parameter, provides a controllable platform to explore non-equilibrium dynamics, and various interesting relevant phenomena have been experimentally observed sadler2006spontaneous ; PhysRevLett.103.250401 ; PhysRevLett.108.035301 ; PhysRevLett.105.090402 ; PhysRevA.84.063625 ; parker2013direct ; Yang2019PRA ; Tian2020PRL . In some parameter regime for the condensate, the spin and spatial degrees of freedom are decoupled because all spin states have the same spatial wave function under the single-mode approximation Ueda2012 . As a consequence, the physics is significantly simplified so that the spin degrees of freedom can be separately studied. For an antiferromagnetic (AFM) sodium condensate, there is a first-order QPT between a polar phase with atoms all occupying the level and an AFM phase with atoms equally occupying the levels, where is the magnetic quantum number. The system thus provides an ideal platform to study the non-equilibrium physics across a first-order QPT.
Here we theoretically and experimentally demonstrate the existence of a power-law scaling of the heat in a sodium spinor condensate for two dynamical processes: a one-way process where a system is driven from a polar phase to an AFM phase and a cyclic process where a system ends up at the initial polar phase. For the one-way process, the power-law scaling is well characterized by the GKZM. In experiments, we prepare an initial condensate in the polar phase and then slowly vary the quadratic Zeeman energy by controlling magnetic and microwave fields to realize the two non-equilibrium processes. Since the energy gap vanishes at the transition point, adiabaticity cannot be maintained no matter how the system is driven, leading to the appearance of excitations as well as heat, which can be used as a measure of how strongly adiabaticity is broken. Based on Refs. Polkovnikov2008PRL ; Polkovnikov2008NP , the heat density can be defined as an energy increase per atom relative to the ground state at the final quadratic Zeeman energy over the entire process. In experiments, it can be evaluated by measuring the atom number occupying the level owing to a simple approximate relation between the heat density and the particle number when is large.
We start by considering the following Hamiltonian describing a spin-1 BEC under single-mode approximation
| (1) |
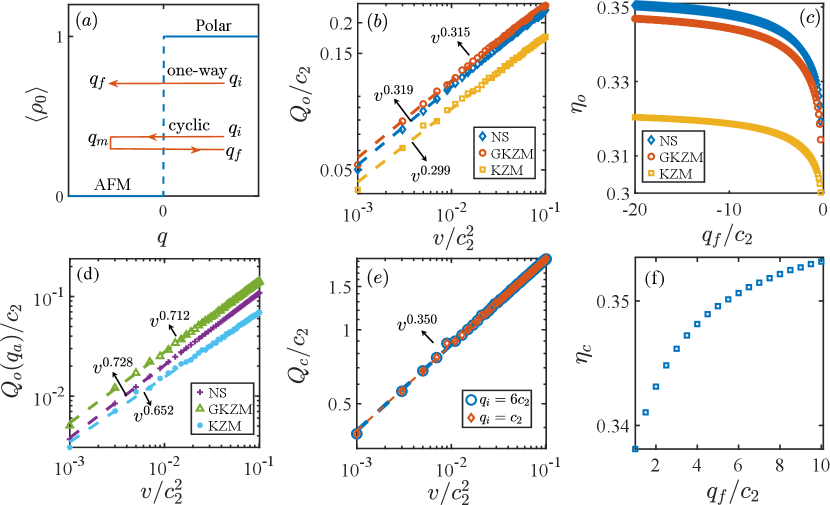
where () is the Boson creation (annihilation) operator for an atom in the hyperfine level , is the total spin operator with () and being the spin-1 angular momentum matrix, is the spin-dependent interaction ( for sodium atoms) and is the total number of atoms. Here and describe linear and quadratic Zeeman energies, respectively. In our experiments, we initialize our condensates in the polar phase so that the dynamics is restricted to the eigenspace of , since the magnetization along is conserved, i.e., . The linear Zeeman term thus becomes irrelevant in the dynamics even though its value is not equal to zero in the experiment. So the ground states of the spinor condensate correspond to the polar and AFM phases when and , respectively. The phase diagram is shown in Fig. 1(a) where the mean value with taken as an order parameter drops to zero from one at , indicating the occurrence of the first-order QPT.
We investigate the heat production in two types of quench processes: a one-way process for linearly ramping from () to () and a cyclic process for linearly ramping from to () and then back to , forming a cyclic process when [see Fig. 1(a)]. In both scenarios, we calculate the energy increase at the end of the quench for different ramp rates . To numerically determine the energy of a spinor condensate, we diagonalize the Hamiltonian under the Fock state basis in the subspace of zero magnetization, , yielding instantaneous eigenstates of satisfying . We also solve the Schrödinger equation (we take as a natural unit) to determine the evolving state of the spinor condensate. The energy per atom at the end of the quench is given by with characterizing the interactions. Since the corresponding ground state energy per atom in the AFM phase is , the produced heat per atom over the one-way process is given by . For the cyclic process, the produced heat per atom is since the ground state energy of the polar phase is zero.
In Fig. 1(b), we plot our numerical simulation results of the heat density for a one-way process, remarkably showing the existence of a power-law scaling, i.e., with . This power-law scaling persists even when is far away from the transition point, but the exponents change as a function of and increase very slowly when is large [see Fig. 1(c)]. The exponents are independent of given that two distinct are connected by an adiabatic process. For a cyclic process, we also observe the power-law scaling of the heat density as shown in Fig. 1(e). While the scaling does not depend on for the same reason, Fig. 1(f) shows that the scaling exponents increase slightly with increasing (but they are irrelevant of ).
It is a well-known fact that the universal scaling laws across a second-order QPT are accounted for by the quantum KZM PhysRevLett.95.035701 ; zurek2005dynamics ; PhysRevB.72.161201 . Its essential basis is the existence of impulse and adiabatic regions. Specifically, suppose at , and the system is in the polar phase. When we linearly drive the system into the AFM phase, the system cannot respond (impulse region) until the response time , where is the relevant energy gap. When , adiabaticity is restored (adiabatic region). For a second-order QPT, the relevant energy gap refers to the gap between the ground state and the first excited state. Based on the KZM, the heat induced by a slow quench across the critical point is shown to exhibit a power-law dependence on the ramp rate with the scaling exponent determined by the equilibrium critical exponents polkovnikov2011colloquium ; de2010adiabatic ; You2018PRA .
For a first-order QPT, we have demonstrated the existence of impulse and adiabatic regions when a spinor condensate is linearly driven across the transition point Qiueaba7292 . Yet, in stark contrast to the KZM, the relevant energy gap is the gap between the maximally occupied state (the metastable state) and its corresponding first excited state in the first-order case. For example, when , the metastable state refers to the many-body metastable polar phase Qiueaba7292 . We now apply the GKZM to determine the heat scaling. To be more precise, we use the equation to calculate the critical time and the corresponding . Since the evolving state is frozen to the initial state when , the heat density can be evaluated by , where is the probability that the initial state occupies the eigenstate of corresponding to the eigenenergy .
In Fig. 1(b), we show the power-law scaling of the heat density with respect to calculated by the GKZM, which agrees very well with the numerical simulation results. Figure 1(c) also displays their comparison of scaling exponents versus , showing very good agreement with less than discrepancy. In comparison, we further compute the heat scaling based on the KZM, which exhibits conspicuous discrepancy especially for large as shown in Fig. 1(c). For example, when , the scaling exponent obtained by the KZM has about difference from the numerical simulation results, while the GKZM only exhibits about difference. This indicates that the GKZM gives a better account of the heat scaling law at a first-order QPT.
In fact, based on the GKZM, the heat per atom produced during a quench process ending at is given by , implying that the heat scaling is determined by the scaling of . In Fig. 1(d), we display the scaling obtained by the numerical simulation, the GKZM and the KZM, demonstrating that the GKZM gives a closer prediction of the power-law exponent to the numerical simulation result than the KZM.
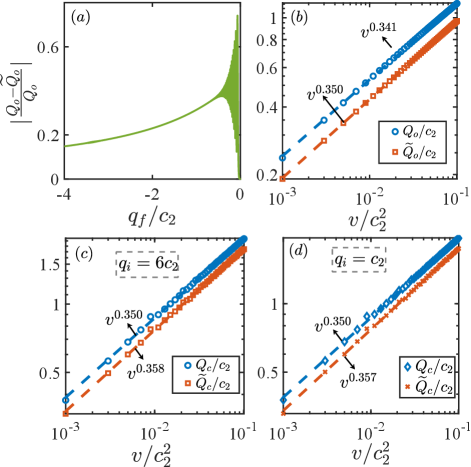
To experimentally probe the heat density is a formidable task due to the complexity of the spin interactions, which is hard to measure. Fortunately, for the one-way process, when is large, the heat density is dominated by the second part, , which can be experimentally evaluated by measuring and . We call the quasi-heat density to distinguish it from the heat density . Similarly, for the cyclic process, we define the corresponding quasi-heat density as . For both processes, the heat density and the quasi-heat density are related by the following equation
| (2) |
with referring to the one-way and cyclic processes, respectively.
Figure 2(a) shows the decline of the relative difference between the heat density and the quasi-heat density when is increased; the relative difference decreases to less than when when . In fact, the scalings determined by these two energy increases agree much better than their energy differences even for not very large , which is experimentally achievable. For instance, when , while there exists difference of compared to , their scaling exponents are in excellent agreement with only less than discrepancy for the one-way process [see Fig. 2(b)]. For the cyclic process when , the scaling exponent difference is also smaller than [see Fig. 2(c) and (d)]. This allows us to obtain the scaling of the heat density by experimentally measuring for relatively large .
In experiments, we produce a sodium BEC in an all-optical trap by evaporation of atoms Yang2019PRA . At the evaporation cooling stage, we apply a strong magnetic field gradient to remove the atoms on the hyperfine levels out of the trap, leaving all atoms on the level. After that, a weak and nearly resonant microwave pulse is applied to excite the atoms from to (the corresponding detuning is ). Since the atoms on the latter level suffer a significant loss due to three body decay, this process kicks many atoms out of the BEC cloud, resulting in less than atoms remaining in the trap. The reduction of the atom number allows us to avoid the unwanted relaxation to the AFM ground state when is tuned to negative values. The atoms are then immersed in a uniform magnetic field with for to equilibrate to the polar phase. Afterwards, we slowly decrease the magnetic field strength so as to linearly vary according to the relation . When is changed to around , we immediately switch on a microwave field with a frequency of (the detuning is relative to the transition from to ) and then gradually raise its amplitude so that is linearly driven to the negative regime YouLi2017Science (Appendix A). During the process, the amplitude of the microwave field is precisely controlled by a proportional-integral-derivative (PID) feedback system according to a careful calibration of ’s values. For each quench rate , is measured by a standard Stern-Gerlach fluorescence imaging at the end of the linear quench in each experiment and is evaluated by averaging over 40 repeated measurements (Appendix C).
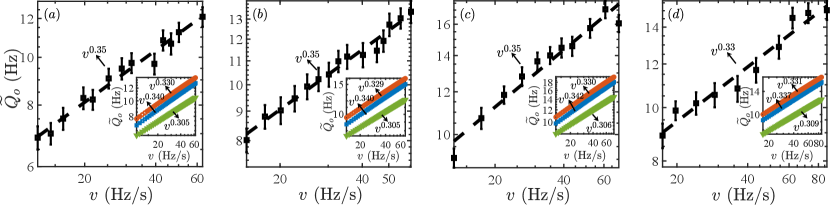
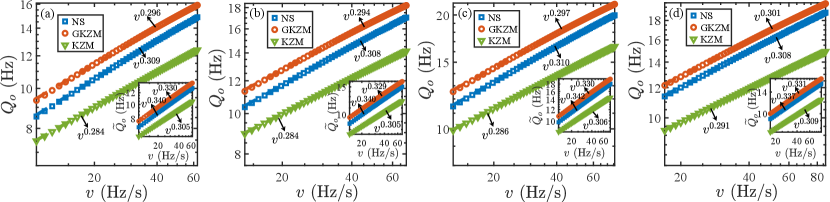
In Fig. 3, we show the experimental results of the quasi-heat density with respect to the ramp rate for the one-way quench with four different sets of quench parameters. In (a-c), we drive a BEC with about atoms and to three distinct . The experimental data clearly demonstrate the existence of a power-law scaling for these different conditions. We fit the data by a power-law function, i.e., , giving the fitting exponents of , and , respectively. The results agree well with the numerical simulation results with the power-law fitting exponents of , and , respectively [see the insets of Fig. 3]. Here the numerically calculated exponents for exhibit about difference from the exponents of , which is larger than the result shown in Fig. 2(b) due to larger ramp rates considered here to reduce the relaxation to the ground states in experiments (Appendix D). In Fig. 3(d), we further plot the experimental results for a BEC with roughly atoms and , showing the existence of a power-law scaling with the fitting exponent of , which is in good agreement with the numerically obtained exponent of .
For a cyclic quench, similar to the one-way one, we initially prepare the condensate in the polar phase with the quadratic Zeeman energy (e.g., ) provided by a uniform magnetic field and then linearly decrease to roughly by decreasing the magnetic field strength. After that, we shine a microwave field to the BEC to linearly vary from about to (, e.g., ) and then back to by controlling the field amplitude. We then turn off the microwave field and raise the magnetic field strength until slowly rises to (e.g., ). Since the results do not depend on the value of when it is sufficiently large so that the dynamics is adiabatic under the quench rate at [see Fig. 1(e)], in experiments, we use and with for experimental convenience. The entire ramping process is precisely controlled to be linear according to the calibration of . Similarly, at the end of each quench, the quasi-heat density is measured by probing through the Stern-Gerlach fluorescence imaging.
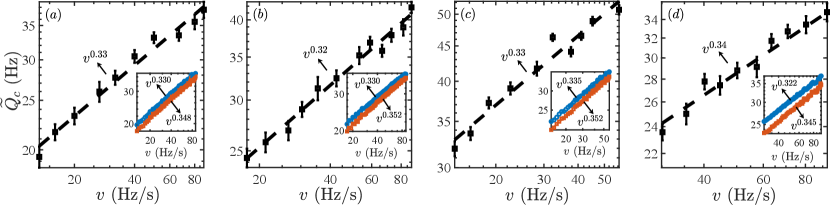
For a cyclic quench, in Fig. 4, we show the experimental measurement of the quasi-heat density as a function of the quench rate under different quench parameters. For a BEC cloud with about atoms and , the results shown in Fig. 4(a-c) evidently illustrate a power-law scaling of the quasi-heat density with fitting exponents of , and , respectively. The exponents agree well with the exponents of , and numerically obtained for , which are larger than , and (numerically calculated scaling exponents for ) by about , and , respectively. This also shows that our experimental measurements cannot differentiate the slight difference between and . Additionally, we raise the atom number to around corresponding to and perform the experiments under the quench parameters of , and . Figure 4(d) reveals the existence of a power-law scaling with a fitting exponent of , in good agreement with the numerical result of .
Our work demonstrates the first experimental observation of a power-law scaling of heat with respect to a ramp rate for non-equilibrium dynamics. Two types of quench processes including one-way and cyclic processes are studied across a first-order QPT in a spinor condensate. The experimentally measured scaling exponents for both non-equilibrium processes agree well with our numerical simulation results.
Acknowledgements.
We thank Yingmei Liu, Ceren Dag, and Anjun Chu for helpful discussions. This work was supported by the Beijing Academy of Quantum Information Sciences, the National key Research and Development Program of China (2016YFA0301902), Frontier Science Center for Quantum Information of the Ministry of Education of China, and Tsinghua University Initiative Scientific Research Program. Y. Xu also acknowledges the support from the start-up fund from Tsinghua University, the National Natural Science Foundation of China (11974201) and the National Thousand-Young-Talents Program.Appendix A: Calibration of the quadratic Zeeman energy
In the experiment, the quadratic Zeeman energy is contributed by both the magnetic and microwave fields so that
| (A1) |
where and are generated by the magnetic and microwave field, respectively. Specifically, is determined by the magnetic field strength through . Based on the relation with being the linear Zeeman energy, can be measured by probing through a Rabi oscillation between the Zeeman energy level and . A microwave field at large frequency detuning shifts the energy of the Zeeman levels due to the AC Stark effect and contributes to the quadratic Zeeman energy as
| (A2) |
with
| (A3) |
where is the Rabi frequency for the resonant transition from to and is the microwave detuning relative to the transition between these energy levels.
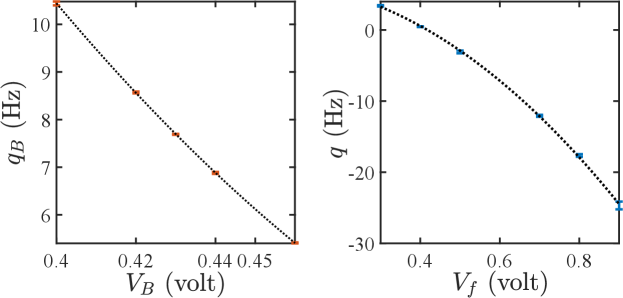
In the experiment, the magnetic field strength is controlled by a voltage that determines the magnitude of the current flowing through the Helmholtz coils. In Fig. A1(a), we show the measured as a function of the voltage , which is well fitted by a parabola function, thus allowing us to linearly change by controlling .
To determine the microwave quadratic Zeeman energy , we experimentally evaluate the Rabi frequencies , and by probing the Rabi oscillations for a resonant transition between the two corresponding energy levels. Other Rabi frequencies can be calculated according to the following relations
| (A4) | |||
| (A5) | |||
| (A6) |
We now fix the microwave’s frequency at with a detuning for the transition from to . is then calculated based on Eq. (A2). Since the magnetic field still exists with when the microwave pulse is applied, the total quadratic Zeeman energy . Because the Rabi frequencies depend on the microwave field amplitude, we can control the amplitude to vary and . In our experiment, we stabilize the amplitude of the microwave pulse by a PID system and calibrate the values of at several different microwave amplitudes controlled by the feedback voltage . The measured with respect to is displayed in Fig. A1(b) with a parabola fitting to the data allowing for a linear ramp of by tuning .
To estimate the error between the calibrated and the true value of , we apply a sudden quench method to measure the transition point . Specifically, we initialize the condensate in the polar phase with and then suddenly change to . After ’ evolution, we probe the atom populations on the state. If , then all atoms should remain on the state; otherwise, if , atoms will show up on the level. In the experiment, the sudden quench of is realized by switching on the microwave field with the frequency of and a certain amplitude controlled by . Since decreases as increases [see Fig. A1(b)], we can find a maximum so that all the atoms stay on the state and a minimum so that atoms begin to show up on the states. The calibrated value of the transition point is thus , resulting in a calibration error of for each set of data. We summarize the calibration error for 21 days’ measurements in Table A1.
| (Hz) | (Hz) | (Hz) | (Hz) |
|---|---|---|---|
| -1.03 | -1.11 | -1.07 | |
| 0.43 | 0.35 | 0.39 | |
| 0.15 | 0.07 | 0.11 | |
| -0.62 | -0.85 | -0.74 | |
| -0.83 | -1.06 | -0.95 | |
| 0.35 | 0.28 | 0.32 | |
| -1.16 | -1.37 | -1.27 | |
| 0.13 | 0.06 | 0.10 | |
| -0.12 | -0.17 | -0.15 | |
| 0.20 | 0.13 | 0.17 | |
| -1.43 | -1.63 | -1.53 | |
| -1.23 | -1.44 | -1.34 | |
| 0.40 | 0.33 | 0.37 | |
| 0.29 | 0.22 | 0.26 | |
| -1.04 | -1.25 | -1.15 | |
| 0.31 | 0.20 | 0.26 | |
| -1.13 | -1.34 | -1.24 | |
| 0.32 | 0.25 | 0.29 | |
| 0.01 | -0.27 | -0.13 | |
| -1.32 | -1.53 | -1.43 | |
| -0.64 | -0.84 | -0.74 |
Appendix B: Measurement of
The spin-dependent interaction coefficient can be measured by observing the spin oscillation, i.e., time evolution of when the condensate is initially prepared to the state with and . According to the mean-field theory, where the quantum fluctuations are neglected and the operators are replaced by their expectation values, the spin-mixing dynamical equations for the spin-1 condensate are given by You2005PRA
| (B1) |
| (B2) |
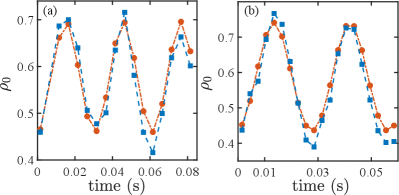
where is the magnetization and is the relative phase. By fixing the quadratic Zeeman energy and , we simulate the time evolution of to find the value of that best fits the experimental results. is then obtained by averaging over 5 measurements for 5 distinct . In Fig. B1(a) and (b), we show the experimental and theoretical results of the time evolution of with the initial state being for and for , respectively. In Table B1, we summarize the five measured results for different atom numbers, giving the mean value of of for and for .
| N | ||||
|---|---|---|---|---|
| 14.31 | 0.99 | 8.0 | ||
| 17.15 | 0.97 | 7.4 | ||
| 24.09 | 1.01 | 9.8 | 1100 | |
| 27.69 | 1.01 | 8.2 | ||
| 31.91 | 1.15 | 7.3 | ||
| 9.44 | 0.95 | 12.6 | ||
| 11.62 | 0.91 | 11.4 | ||
| 14.22 | 0.95 | 11.4 | 3000 | |
| 17.17 | 0.97 | 10.8 | ||
| 20.45 | 1.05 | 12.9 |
Appendix C: Experimental measurement of
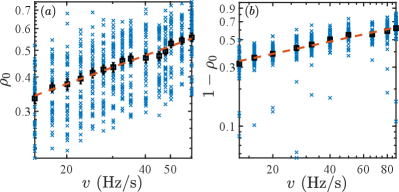
In experiments, we measure by the standard Stern-Gerlach fluorescence imaging for different ramp rates. Fig. B2(a) shows the measured data (labelled by blue diagonal crosses) of for a one-way process where is linearly varied from to . In this case, the atom number is restricted to about corresponding to a fluorescence count in the range of and . at each ramp rate is calculated by averaging over measurements repeated 40 times, which is plotted as black squares in the figure. The error bars of (the error in the mean) originate from the quantum fluctuations and the measurement fluctuations and is evaluated as StatisticBook , where is the standard deviation of the 40 samples. For the one-way quench process, and thus the error bar of can be evaluated by
| (C1) |
where the superscript var denotes the variance of a quantity. Since there is an error of for , we make a correction of to with the variance according to the calibration of in Table. A1. In Fig. B2(b), we also display the original data of for a cyclic process, where is changed from to and then back to at different ramp rates for a system with roughly atoms.
Appendix D: Finite quench rate effects on scaling exponents
In Fig. D1, we provide the numerical simulation results of , showing about difference for compared with . This discrepancy is larger than the result shown in Fig. 2(b) in the main text. We attribute this discrepancy to the finite ramp rates. As shown in Table D1, the relative difference is larger for a range of quench rates with larger values due to larger contribution of interactions to total energy for a fixed . In our experiments, both and quench rate that can be taken are limited by the applied microwave field which can induce the relaxation of the condensate to the AFM ground state when its amplitude is strong or it is applied for a long time. To reduce the relaxation effect, we take the minimum as and the slowest ramp rate as corresponding to about for an quench process during which the microwave field is shined to vary the quadratic Zeeman energy.
| 0.370 | 0.373 | 0.81 | |
| 0.351 | 0.356 | 1.42 | |
| 0.315 | 0.343 | 8.89 |
References
- (1) Polkovnikov, A. Microscopic Expression for Heat in the Adiabatic Basis. Phys. Rev. Lett. 101, 220402 (2008).
- (2) Polkovnikov, A. & Gritsev, V. Breakdown of the adiabatic limit in low-dimensional gapless systems. Nat. Phys. 4, 477-481 (2008).
- (3) Polkovnikov, A., Sengupta, K., Silva, A. & Vengalattore, M. Colloquium: Nonequilibrium dynamics of closed interacting quantum systems. Rev. Mod. Phys. 83, 863 (2011).
- (4) De Grandi, C. & Polkovnikov, A. Adiabatic Perturbation Theory: From Landau-Zener Problem to Quenching Through a Quantum Critical Point. In Quantum Quenching, Annealing and Computation pp. 75-114 (Springer, Berlin, Heidelberg, 2010).
- (5) Chen, D., White, M., Borries, C. & DeMarco, B. Quantum Quench of an Atomic Mott Insulator. Phys. Rev. Lett. 106, 235304 (2011).
- (6) Anquez, M. et al. Quantum Kibble-Zurek Mechanism in a Spin-1 Bose-Einstein Condensate. Phys. Rev. Lett. 116, 155301 (2016).
- (7) Clark, L. W., Feng, L. & Chin, C. Universal space-time scaling symmetry in the dynamics of bosons across a quantum phase transition. Science 354, 606-610 (2016).
- (8) Zhang, J., Cucchietti, F. M., Laflamme, R. & Suter, D. Defect production in non-equilibrium phase transitions: experimental investigation of the Kibble–Zurek mechanism in a two-qubit quantum simulator. New J. Phys. 19, 043001 (2017).
- (9) Keesling, A. et al. Quantum Kibble–Zurek mechanism and critical dynamics on a programmable Rydberg simulator. Nature 568, 207-211 (2019).
- (10) Qiu, L.-Y. et al. Observation of generalized Kibble-Zurek mechanism across a first-order quantum phase transition in a spinor condensate. Sci. Adv. 6, eaba7292 (2020).
- (11) Kibble, T. W. Some implications of a cosmological phase transition. Phys. Rep. 67, 183-199 (1980).
- (12) Zurek, W. H. Cosmological experiments in superfluid helium? Nature 317, 505-508 (1985).
- (13) Damski, B. The Simplest Quantum Model Supporting the Kibble-Zurek Mechanism of Topological Defect Production: Landau-Zener Transitions from a New Perspective. Phys. Rev. Lett. 95, 035701 (2005).
- (14) Zurek, W. H., Dorner, U. & Zoller, P. Dynamics of a quantum phase transition. Phys. Rev. Lett. 95, 105701 (2005).
- (15) Polkovnikov, A. Universal adiabatic dynamics in the vicinity of a quantum critical point. Phys. Rev. B 72, 161201 (2005).
- (16) Panagopoulos, H. & Vicari, E. Off-equilibrium scaling behaviors across first-order transitions. Phys. Rev. E 92, 062107 (2015).
- (17) Liang, N. & Zhong, F. Renormalization-group theory for cooling first-order phase transitions in Potts models. Phys. Rev. E 95, 032124 (2017).
- (18) Coulamy, I. B., Saguia, A. & Sarandy, M. S. Dynamics of the quantum search and quench-induced first-order phase transitions. Phys. Rev. E 95, 022127 (2017).
- (19) Pelissetto, A. & Vicari, E. Dynamic off-equilibrium transition in systems slowly driven across thermal first-order phase transitions. Phys. Rev. Lett. 118, 030602 (2017).
- (20) Shimizu, K., Hirano, T., Park, J., Kuno, Y. & Ichinose, I. Dynamics of first-order quantum phase transitions in extended Bose–Hubbard model: from density wave to superfluid and vice versa. New J. Phys. 20, 083006 (2018).
- (21) Sadler, L. E., Higbie, J. M., Leslie, S. R., Vengalattore, M. & Stamper-Kurn, D. M. Spontaneous symmetry breaking in a quenched ferromagnetic spinor Bose–Einstein condensate. Nature 443, 312-315 (2006).
- (22) Leslie, L. S., Hansen, A., Wright, K. C., Deutsch, B. M. & Bigelow, N. P. Creation and Detection of Skyrmions in a Bose-Einstein Condensate. Phys. Rev. Lett. 103, 250401 (2009).
- (23) Choi, J., Kwon, W. J. & Shin, Y. Observation of Topologically Stable 2D Skyrmions in an Antiferromagnetic Spinor Bose-Einstein Condensate. Phys. Rev. Lett. 108, 035301 (2012).
- (24) Kronjäger, J., Becker, C., Soltan-Panahi, P., Bongs, K. & Sengstock, K. Spontaneous Pattern Formation in an Antiferromagnetic Quantum Gas. Phys. Rev. Lett. 105, 090402 (2010).
- (25) Guzman, J. et al. Long-time-scale dynamics of spin textures in a degenerate 87Rb spinor Bose gas. Phys. Rev. A 84, 063625 (2011).
- (26) Parker, C. V., Ha, L.-C. & Chin, C. Direct observation of effective ferromagnetic domains of cold atoms in a shaken optical lattice. Nat. Phys. 9, 769-774 (2013).
- (27) Yang, H.-X. et al. Observation of dynamical quantum phase transitions in a spinor condensate. Phys. Rev. A 100, 013622 (2019).
- (28) Tian, T. et al. Observation of dynamical quantum phase transitions with correspondence in an excited state phase diagram. Phys. Rev. Lett. 124, 043001 (2020).
- (29) Kawaguchi, Y. & Ueda, M. Spinor Bose-Einstein condensates. Phys. Rep. 520, 253-381 (2012).
- (30) Xue, M., Yin, S. & You, L. Universal driven critical dynamics across a quantum phase transition in ferromagnetic spinor atomic Bose-Einstein condensates. Phys. Rev. A 98, 013619 (2018).
- (31) Luo, X.-Y. et al., Deterministic entanglement generation from driving through quantum phase transitions. Science 355, 620 (2017).
- (32) Zhang, W., Zhou, D. L., Chang, M.-S., Chapman, M. S., and You, L., Coherent spin mixing dynamics in a spin-1 atomic condensate, Phys. Rev. A 72, 013602 (2005).
- (33) Ross, S. M., Introductory Statistics, Academic Press, Fourth Edition (2017).