Nonparametric Variable Screening with Optimal Decision Stumps
Abstract
Decision trees and their ensembles are endowed with a rich set of diagnostic tools for ranking and screening variables in a predictive model. Despite the widespread use of tree based variable importance measures, pinning down their theoretical properties has been challenging and therefore largely unexplored. To address this gap between theory and practice, we derive finite sample performance guarantees for variable selection in nonparametric models using a single-level CART decision tree (a decision stump). Under standard operating assumptions in variable screening literature, we find that the marginal signal strength of each variable and ambient dimensionality can be considerably weaker and higher, respectively, than state-of-the-art nonparametric variable selection methods. Furthermore, unlike previous marginal screening methods that attempt to directly estimate each marginal projection via a truncated basis expansion, the fitted model used here is a simple, parsimonious decision stump, thereby eliminating the need for tuning the number of basis terms. Thus, surprisingly, even though decision stumps are highly inaccurate for estimation purposes, they can still be used to perform consistent model selection.
1 Introduction
A common task in many applied disciplines involves determining which variables, among many, are most important in a predictive model. In high-dimensional sparse models, many of these predictor variables may be irrelevant in how they affect the response variable. As a result, variable selection techniques are crucial for filtering out irrelevant variables in order to prevent overfitting, improve accuracy, and enhance the interpretability of the model. Indeed, algorithms that screen for relevant variables have been instrumental in the modern development of fields such as genomics, biomedical imaging, signal processing, image analysis, and finance, where high-dimensional, sparse data is frequently encountered [12].
Over the years, numerous parametric and nonparametric methods for variable selection in high-dimensional models have been proposed and studied. For linear models, the LARS algorithm [10] (for Lasso [39]) and Sure Independence Screening (SIS) [12] serve as prototypical examples that have achieved immense success, both practically and theoretically. Other strategies for nonparametric additive models such as Nonparametric Independence Screening (NIS) [11] and Sparse Additive Models (SPAM) [35] have also enjoyed a similar history of success.
1.1 Tree based variable selection procedures
Alternatively, because they are built from highly interpretable and simple objects, decision tree models are another important tool in the data analyst’s repertoire. Indeed, after only a brief explanation, one is able to understand the tree construction and its output in terms of meaningful domain specific attributes of the variables. In addition to being interpretable, tree based model have good computational scalability as the number of data points grows, making them faster than many other methods when dealing with large datasets. In terms of flexibility, they can naturally handle a mixture of numeric variables, categorical variables, and missing values. Lastly, they require less preprocessing (because they are invariant to monotone transformations of the inputs), are quite robust to outliers, and are relatively unaffected by the inclusion of many irrelevant variables [17, 26], the last point being of relevance to the variable selection problem.
Conventional tree structured models such as CART [6], random forests [4], ExtraTrees [15], and gradient tree boosting [14] are also equipped with heuristic variable importance measures that can be used to rank and identify relevant predictor variables for further investigation (such as plotting their partial dependence functions). In fact, tree based variable importance measures have been used to discover genes in bioinformatics [5, 33, 8, 9, 20], identify loyal customers and clients [7, 40, 27], detect network intrusion [46, 47], and understand income redistribution preferences [25], to name a few applications.
1.2 Mean decrease in impurity
An attractive feature specific to CART methodology is that one can compute, essentially for free, measures of variable importance (or influence) using the optimal splitting variables and their corresponding impurities. The canonical CART-based variable importance measure is the Mean Decrease in Impurity (MDI) [14, Section 8.1], [6, Section 5.3.4], [17, Sections 10.13.1 & 15.3.2], which calculates an importance score for a variable by summing the largest impurity reductions (weighted by the fraction of samples in the node) over all non-terminal nodes split with that variable, averaged over all trees in the ensemble. Another commonly used and sometimes more accurate measure is the Mean Decrease in Accuracy (MDA) or permutation importance measure, defined as the average difference in out-of-bag errors before and after randomly permuting the data values of a variable in out-of-bag samples over all trees in the ensemble [4]. However, from a computational perspective, MDI is preferable to MDA since it can be computed as each tree is grown with no additional cost. While we view the analysis of MDA as an important endeavor, it is outside the scope of the present paper and therefore not our current focus. In contrast to the aforementioned variable selection procedures like SIS, NIS, Lasso, and SPAM, except for a few papers, little is known about the finite sample performance of MDI. Theoretical results are mainly limited to the asymptotic, fixed dimensional data setting and to showing what would be expected from a reasonable measure of variable importance. For example, it is shown in [31] that the MDI importance of a categorical variable (in an asymptotic data and ensemble size setting) is zero precisely when the variable is irrelevant, and that the MDI importance for relevant variables remains unchanged if irrelevant variables are removed or added.
Recent complementary work by [36] established the large sample properties of MDI for additive models by showing that it converges to sensible quantities like the variance of the component functions, provided the decision tree is sufficiently deep. However, these results are not fine-grained enough to handle the case where either the dimensionality grows or the marginal signals decay with the sample size. Furthermore, [36] crucially relies on the assumption that the CART decision tree is a consistent predictor, which is currently only known for additive models [37]. It is therefore unclear whether the techniques can be generalized to models beyond those considered therein. On the other hand, our results suggest that tree based variable importance measures can still have good variable selection properties even though the underlying tree model may be a poor predictor of the data generating process—which can occur with CART and random forests.
Lastly, we mention that important steps have also been taken to characterize the finite sample properties of MDI; [29] show that MDI is less biased for irrelevant variables when each tree is shallow. This work therefore covers one facet of the variable selection problem, i.e., controlling the number of false positives, and will be employed in our proofs.
1.3 New contributions
The lack of theoretical development for tree based variable selection is likely because the training mechanism involves complex steps —which present new theoretical challenges— such as bagging, boosting, pruning, random selections of the predictor variables for candidate splits, recursive splitting, and line search to find the best split points [24]. The last consideration, importantly, means that the underlying tree construction (e.g., split points) depends on both the input and output data, which enables it to adapt to structural properties of the underlying statistical model (such as sparsity). This data adaptivity is a double-edged sword from a theoretical standpoint, though, since unravelling the data dependence is a formidable task.
Despite the aforementioned challenges, we advance the study of tree based variable selection by focusing on the following two fundamental questions:
-
•
Does MDI enjoy finite sample guarantees for its variable ranking?
-
•
What are the benefits of MDI over other variable screening methods?
Specifically, we derive rigorous finite sample guarantees for what we call the SDI importance measure, a sobriquet for Single-level Decrease in Impurity, which is a special case of MDI for a single-level CART decision tree or “decision stump” [21]. This is similar in spirit to the approach of DSTUMP [24] but, importantly, SDI incorporates the line search step by finding the optimal split point, instead of the empirical median, of every predictor variable. As we shall see, ranking variables according to their SDI is equivalent to ranking the variables according to the marginal sample correlations between the response data and the optimal decision stump with respect to those variables. This equivalence also yields connections with other variable selection methods: for linear models with Gaussian variates, we show that SDI is asymptotically equivalent to SIS (up to logarithmic factors in the sample size), and so SDI inherits the so-called sure screening property [12] under suitable assumptions.
Unlike SIS, however, SDI is accompanied by provable guarantees for nonparametric models. We show that under certain conditions, SDI achieves model selection consistency; that is, it correctly selects the relevant variables of the model with probability approaching one as the sample size increases. In fact, the minimum signal strength of each relevant variable and maximum dimensionality of the model are shown to be less restrictive for SDI than NIS or SPAM. In the linear model case with Gaussian variates, SDI is shown to nearly match the optimal sample size threshold (achieved by Lasso) for exact support recovery. These favorable properties are particularly striking when one is reminded that the underlying model fit to the data is a simple, parsimonious decision stump—in particular, there is no need to specify a flexible function class (such as a polynomial spline family) and be concerned with calibrating the number of basis terms or bandwidth parameters.
Finally, we empirically compare SDI to other contemporaneous variable selection algorithms, namely, SIS, NIS, Lasso, and SPAM. We find that SDI is competitive and performs favorably in cases where the model is less smooth. Furthermore, we empirically verify the similarity between SDI and SIS for the linear model case, and confirm the model selection consistency properties of SDI for various types of nonparametric models.
Let us close this section by saying a few words about the primary goals of this paper. In practice, tree based variable importance measures such as MDI and MDA are most commonly used to rank variables, in order to determine which ones are worthy of further examination. This is a less ambitious endeavor than that sought by the aforementioned variable selection methods, which aim for consistent model selection, namely, determining exactly which variables are relevant and irrelevant. Though we do study the model selection problem, our priority is to demonstrate the power of tree based variable importance measures as interpretable, accurate, and efficient variable ranking tools.
1.4 Organization
The paper is organized according to the following schema. First, in Section 2, we formally describe our learning setting and problem, discuss prior art, and introduce the SDI algorithm. We outline some key lemmas and ideas used in the proofs in Section 3. In the next two sections, we establish our main results: in Section 4, we establish that for linear models, SDI is asymptotically equivalent to SIS (up to logarithmic factors in the sample size) and in Section 5, we establish the variable ranking and model selection consistency properties of SDI for more general nonparametric models. Lastly, we compare the performance of SDI to other well-known variable selection techniques from a theoretical perspective in Section 6 and from an empirical perspective in Section 7. We conclude with a few remarks in Section 8. Due to space constraints, we include the full proofs of our main results in Sections 4 and 5 in the appendix.
2 Setup and algorithm
In this section we introduce notation, formalize the learning setting, and give an explicit layout of our SDI algorithm. At the end of the section, we discuss its complexity and provide several interpretations.
2.1 Notation
For labeled data drawn from a population distribution , we let , , , and denote the sample covariance, variance, mean, and Pearson product-moment correlation coefficient respectively. The population level covariance, variance, and correlation are denoted by , , and , respectively.
2.2 Learning setting
Throughout this paper, we operate under a standard regression framework where the statistical model is , the vector of predictor variables is , and is statistical noise. While our results are valid for general nonparametric models, for conceptual simplicity, the canonical model class we have in mind is additive models, i.e.,
| (1) |
for some univariate component functions . As is standard with additive modeling [17, Section 9.1.1], for identifiability of the components, we assume that the have population mean zero for all . This model class strikes a balance between flexibility and learnability—it is more flexible than linear models, but, by giving up on modeling interaction terms, it does not suffer from the curse of dimensionality.
We observe data with the sample point drawn independently from the model above. Note that with this notation, are i.i.d. instances of the random variable . We assume that the regression function depends only on a small subset of the variables , which we call relevant variables with support and sparsity level . Equivalently, is identically zero for the irrelevant variables . In this paper, we consider the variable ranking problem, defined here as ranking the variables so that the top coincide with with high probability. As a corollary, this will enable us to solve the variable selection problem, namely, determining the subset . We pay special attention to the high-dimensional regime where . In fact, in Section 5.3 we will provide conditions under which consistent variable selection occurs even when .
2.3 Prior art
The conventional approach to marginal screening for nonparametric additive models is to directly estimate either the nonparametric components or the marginal projections
with the ultimate goal of studying their variances or their correlations with the response variable.111Note that need not be the same as unless, for instance, the predictor variables are independent and the noise is independent and mean zero. To accomplish this, SIS, NIS, and [16] rank the variables according to the correlations between the response values and least squares fits over a univariate model class , i.e.,
| (2) |
The model class is chosen to make the above optimization tractable, while at the same time, be sufficiently rich in order to approximate . For example, if is the space of polynomial splines of a fixed degree, then in (2) can be computed efficiently via a truncated B-spline basis expansion
| (3) |
as is done with NIS. Similarly, SIS takes to be the family of linear functions in a single variable. Complementary methods that aim to directly estimate each include SPAM, which uses a smooth back-fitting algorithm with soft-thresholding, and [19], which combines adaptive group Lasso with truncated B-spline basis expansions.
As we shall see, SDI is equivalent to ranking the variables according to (2) when consists of the collection of all decision stumps in of the form
| (4) |
Unlike the previous expressive models such a polynomial splines (3), a one-level decision tree, realized by the model (4) above, severely underfits the data and would therefore be ill-advised for estimating , if that were the goal. Remarkably, we show that this rigidity does not hinder SDI for variable selection. What redeems SDI is that, unlike the aforementioned methods that are based on linear estimators, decision stumps (4) are nonlinear since the splits points can depend on the response data. These model nonlinearities equip SDI with the ability to discover nonlinear patterns in the data, despite its poor approximation capabilities.
Finally, we mention that one benefit of such a simple model as (4) is that it is completely free of tuning parameters. In contrast, other methods such as the ones listed here require careful calibration of, for example, variable bandwidth smoothers or the number of terms in the basis expansions (e.g., SPAM and NIS).
2.4 The SDI algorithm
In this section, we provide the details for the SDI algorithm. We first provide some high-level intuition.
In order to determine whether, say, is relevant for predicting from , it is natural to first divide the data into two groups according to whether is above or below some predetermined cutoff value and then assess how much the variance in changes before and after this division. A small change in the variability indicates a weak or nonexistent dependence of on ; whereas, a moderate to large change indicates heterogeneity in across different values of . As we now explain, this is precisely what SDI does when the predetermined cutoff value is sought by a least squares fit over all possible ways of dividing the data.
Let be a candidate split for a variable that divides the response data into left and right daughter nodes based on the variable. Define the mean of the left daughter node to be and the mean of the right daughter node to be and let the size of the left and right daughter nodes be and , respectively. For CART regression trees, the impurity reduction (or variance reduction) in the response variable from choosing the split point for the variable is defined to be
| (5) |
For each variable , we choose a split point that maximizes the impurity reduction
and for convenience, we denote the largest impurity reduction by
We then rank the variables commensurate with the sizes of their impurity reductions, i.e., we obtain a ranking where . If desired, these rankings can be repurposed to perform model selection (e.g., an estimate of ), as we now explain. If we are given the sparsity level in advance, we can choose to be the top of these ranked variables; otherwise, we must find a data-driven choice of how many variables to include. Equivalently, the latter case is realized by choosing to be the indices for which , where is a threshold to be described in Section 2.5. This is of course a delicate task as including too many variables may lead to more false positives.
By [6, Section 9.3], using a sum of squares decomposition, we can rewrite the impurity reduction (5) as
| (6) |
which allows us to compute the largest impurity reductions for all possible split points with a single pass over the data by first ordering the data along and then updating and in an online fashion. This alternative expression for the objective function facilitates its rapid evaluation and exact optimization. Pseudocode for SDI is given in Algorithm 1.
2.5 Data-driven choices of
As briefly mentioned in Section 2.4, if we do not know the sparsity level in advance, we can instead use a data-driven threshold to modulate the number of selected variables. Here we propose two data-driven methods to determine the threshold .
Permutation method
The first thresholding method is similar to the Iterative Nonparametric Independence Screening (INIS) method based on NIS [11, Section 4]. The first step is to choose a random permutation of the data to decouple from so that the new dataset follows a null model. Then we choose the threshold to be the maximum of the impurity reductions over all based on the dataset . We can also generate different permutations and take the maximum of over all such permuted datasets to get a more significant threshold, i.e., . With selected in this way, SDI will then output the variable indices consisting of the indices for which the original impurity reductions are at least . Interestingly, this method has parallels to MDA in that we permute the data values of a given variable and calculate the resulting change in the quality of the fit.
Elbow method
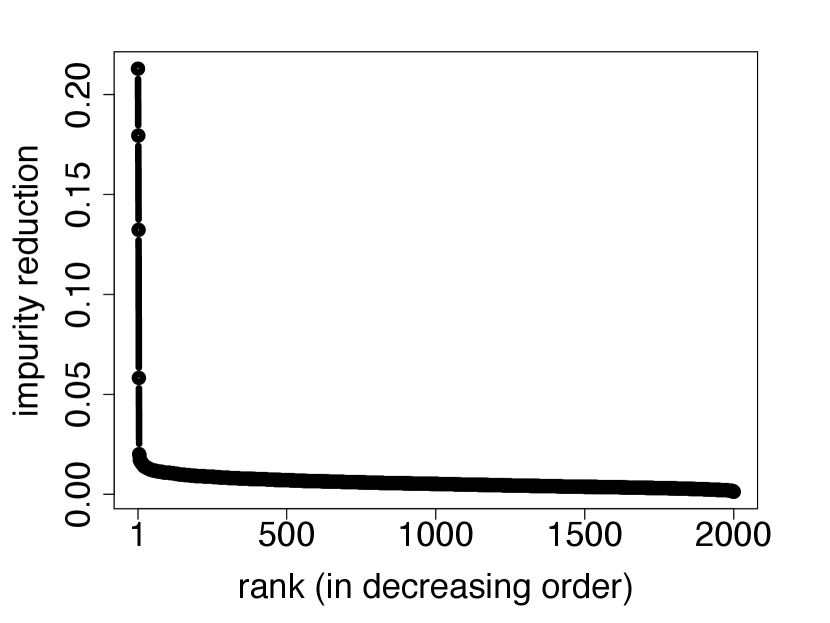
One problem with the permutation method is that it performs poorly when there is correlation between relevant and irrelevant variables. This is because, in the decoupled dataset , there is essentially no correlation between and any variable; whereas in the original dataset, may be correlated with some of the irrelevant variables. In this case, the threshold will be too small and the selected set of variables will include many irrelevant variables (false positives). An alternative is to employ visual inspection via the elbow method, which is typically used to determine the number of clusters in cluster analysis. Here we plot the largest impurity reductions in decreasing order and search for an “elbow” in the curve. We then let consist of the variable indices that come before the elbow. Instead of choosing the cutoff point visually, we can also automate the process by clustering the impurity reductions with, for example, a two-component Gaussian mixture model. Both of these implementations are generally more robust to correlation between relevant and irrelevant variables than the permutation method.
We illustrate the empirical performance of both the permutation method and the elbow method in Section 7.
2.6 Computational issues
We now briefly discuss the computational complexity of Algorithm 1—or equivalently—the computational complexity of growing a single-level CART decision tree. For each variable , we first sort the input data along with operations. We then evaluate the decrease in impurity along data points (as done in the nested for-loop of Algorithm 1), and finally find the maximum among these values (as done in the nested if-statement of Algorithm 1), all with operations. Thus, the total number of calculations for all of the variables is . This is only slightly worse than the complexity of SIS for linear models , comparable to NIS based on the complexity of fitting B-splines, and favorable to that of Lasso or stepwise regression , especially when is large [10, 17]. While approximate methods like coordinate descent for Lasso can reduce the complexity to at each iteration, their convergence properties are unclear. Thus, as SPAM is a generalization of Lasso for nonparametric additive models, its implementation (via a functional version of coordinate descent for Lasso) may be similarly expensive.
2.7 Interpretations of SDI
In this section we outline two interpretations of SDI.
Interpretation 1
Our first interpretation of SDI is in terms of the sample correlation between the response and a decision stump. To see this, denote the decision stump that splits at by
and one at an optimal split value by
Note that equivalently minimizes the marginal sum of squares (2) over the collection of all decision stumps (4). Next, by Lemma A.1 in [26], we have:
| (7) | ||||
where
is the Pearson product-moment sample correlation coefficient between the data and decision stump . In other words, we see from (7) that an optimal split point is chosen to maximize the Pearson sample correlation between the data and decision stump . This reveals that SDI is, at its heart, a correlation ranking method, in the same spirit as SIS, NIS, and [16] via (2). In fact, as we shall see in Section 3, SDI is for all intents and purposes also similar to ranking the variables according to the correlation between the response data and the marginal projections .
Like for linear models, (7) reveals that the squared sample correlation equals the coefficient of determination , i.e., the fraction of variance in explained by a decision stump in .333However, unlike linear models, for this relationship to be true, the decision stump need not necessarily be a least squares fit, i.e., . Thus, SDI is also equivalent to ranking the variables according to the goodness-of-fit for decision stumps of each variable. In fact, the equivalence between ranking with correlations and ranking with squared error goodness-of-fit is a ubiquitous trait among most models [16, Theorem 1].
Interpretation 2
The other interpretation is in terms of the aforementioned MDI importance measure. Recall the definition of MDI in Section 8, i.e., for an individual decision tree , the MDI for is the total reduction in impurity attributed to the splitting variable . More succinctly, the MDI of for equals
| (8) |
where the sum extends over all non-terminal nodes in which was split, is the number of sample points in , and is the largest reduction in impurity for samples in . Note that if is a decision stump with split along , then (8) equals , the largest reduction in impurity at the root node. Because a split at the root node captures the main effects of the model, can be seen as a first order approximation of (8) in which higher order interaction effects are ignored.
3 Preliminaries
Our first lemma, developed by the first author in recent work, reveals the crucial role that optimization (of a nonlinear model) plays in assessing whether a particular variable is relevant or irrelevant—by relating the impurity reduction for a particular variable to the sample correlation between the response variable and any function of . This lemma also highlights a key departure from other approaches in past decision tree literature that do not consider splits that depend on both input and output data (see, for example, DSTUMP [24]).
In order to state the lemma, we will need to introduce the concept of stationary intervals. We define a stationary interval of a univariate function to be a maximal interval such that , where is a local extremum of ( is maximal in the sense that there does not exist an interval such that and ). In particular, note that a monotone function does not have any stationary intervals.
Lemma 1 (Lemma A.4, Supplementary Material in [26]).
Almost surely, uniformly over all functions of that have at most stationary intervals, we have
| (9) |
where is the smallest number of data points in a stationary interval of that contains at least one data point.444More precisely, if are the stationary intervals of and , then .
Remark 1.
Note that can also be thought of as the number of times changes from strictly increasing to decreasing (or vice versa).
Remark 2.
The bound (9) is tight (up to universal constant factors) when , since and when , , and
Proof sketch of Lemma 1.
For self-containment, we sketch the proof when is differentiable. The essential idea is to construct an empirical prior on the split points and lower bound by
Recall from Section 2.4 that and are the number of samples in the left and right daughter nodes, respectively, if the variable is split at . The special prior we choose has density
with support between the minimum and maximum values of the data . This then yields . The factor can be minimized (by solving a simple quadratic program) over all functions under the constraint that they have at most stationary intervals containing at least data points, yielding the desired result (9). We direct the reader to [26, Lemma A.4, Supplementary Material] for the full proof. ∎
Ignoring the factor in (9) and focusing only on the squared sample covariance term, note that choosing to be the marginal projection , we have
where the last equality can be deduced from the fact that the marginal projection is orthogonal to the residual . Thus, in an ideal setting, Lemma 1 enables us to asymptotically lower bound by a multiple of the variance of the marginal projections—which can then be used to screen for important variables and control the number of false negatives.
To summarize, the previous lemma shows that is large for variables such that is strongly correlated with —or equivalently—variables that have large signals in terms of the variance of the marginal projection. Conversely, our next lemma shows that is with high probability not greater than the variance of the marginal projection. A special instance of this lemma, namely, when is independent of , was stated in [29, Lemma 1] and serves as the inspiration for our proof. Due to space constraints, we include the proof in Appendix A.
Lemma 2.
Suppose that is conditionally sub-Gaussian given , with variance parameter , i.e., for all . With probability at least ,
4 SDI for linear models
To connect SDI to other variable screening methods that are perhaps more familiar to the reader, we first consider a linear model with Gaussian distributed variables. We allow for any correlation structure between covariates. Recall from (7) that is equal to times , so that SDI is equivalent to ranking by . Our first theorem shows that , the sample correlation between and an optimal decision stump in , behaves roughly like the correlation between a linear model and a coordinate .
Theorem 1 (SDI is asymptotically equivalent to SIS).
Let and assume that for some positive semi-definite matrix and for some . Let . There exists a universal positive constant such that, with probability at least ,
| (10) |
Furthermore, with probability at least ,
| (11) |
Proof sketch of Theorem 1.
We only sketch the proof due to space constraints, but a more complete version is provided in Appendix B.
The first step in proving the lower bound (10) is to apply Lemma 1 with (a monotone function) to see that
| (12) |
since . Next, we can apply asymptotic tail bounds for Pearson’s sample correlation coefficient between two correlated Gaussian distributions [18] to show that with high probability, . Finally, we divide (12) by , use (7), and take square roots to complete the proof of the high probability lower bound (10).
To prove the upper bound (11), notice that since and are jointly Gaussian with mean zero, we have , where . Thus, by Lemma 2 with and , with probability at least ,
| (13) | ||||
We further upper bound (13) by obtaining high probability upper and lower bounds, respectively, for and in terms of and , with a standard chi-squared concentration bound, per the Gaussian assumption. This yields that with high probability,
| (14) |
Finally, dividing both sides of (14) by , using (7), and taking square roots proves (11). ∎
Theorem 1 shows that with high-probability, SDI is asymptotically equivalent (up to logarithmic factors in the sample size) to SIS for linear models in that it ranks the magnitudes of the marginal sample correlations between a variable and the model, i.e., . As a further parallel with decision stumps (see Section 2.7), the square of the sample correlation, , is also equal to the coefficient of determination for the least squares linear fit of on . We confirm the similarity between SDI and SIS empirically in Section 7.
One corollary of Theorem 1 is that, like SIS, SDI also enjoys the sure screening property, under the same assumptions as [12, Conditions 1-4], which include mild conditions on the eigenvalues of the design covariance matrices and minimum signals of the parameters . Similarly, like SIS, SDI can also be paired with lower dimensional variable selection methods such as Lasso or SCAD [2] for a complete variable selection algorithm in the correlated linear model case.
On the other hand, SDI, a nonlinear method, applies to broader contexts far beyond the rigidity of linear models. In the next section, we will investigate how SDI performs for general nonparametric models with additional assumptions on the distribution of the variables.
5 SDI for nonparametric models
In this section, we establish the variable ranking and selection consistency properties of SDI for general nonparametric models; that is, we show that for Algorithm 1, we have as . We describe the assumptions needed in Section 5.1 and outline the main consistency results and their proofs in Section 5.3. Finally, we describe how to modify the main results for binary classification in Section 5.5.
Although our approach differs substantively, to facilitate easy comparisons with other marginal screening methods, our framework and assumptions will be similar. As mentioned earlier, SDI is based on a more parsimonious but significantly more biased model fit than those than underpin conventional methods. As we shall see, despite the decision stump severely underfitting the data, SDI nevertheless achieves model selection guarantees that are similar to, and in some cases stronger than, its competitors. This highlights a key difference between quantifying sensitivity and screening—in the latter case, we are not concerned with obtaining consistent estimates of the marginal projections and their variances. Doing so demands more from the data and is therefore less efficient, when otherwise crude estimates would work equally well.
5.1 Assumptions
In this section, we describe the key assumptions and ideas which will be needed to achieve model selection consistency. The assumptions will be similar to those in the independence screening literature [11, 12], but are weaker than most past work on tree based variable selection [29, 24].
-
Assumption 1 (Bounded regression function).
The regression function is bounded with .
-
Assumption 2 (Smoothness of marginal projections).
Let be a positive integer, let be such that is at least , and let . The order derivative of exists and is -Lipschitz of order , i.e.,
-
Assumption 3 (Monotonicity of marginal projections).
The marginal projection is monotone on .
-
Assumption 4 (Partial orthogonality of predictor variables).
The collections and are independent of each other.
-
Assumption 5 (Uniform relevant variables).
The marginal distribution of each , for , is uniform on the unit interval.
-
Assumption 6 (Sub-Gaussian error distribution).
The error distribution is conditionally sub-Gaussian given , i.e., and for all with .
5.2 Discussion of the assumptions
Assumption 2 is a standard smoothness assumption for variable selection in nonparametric additive models [11, Assumption A] and [19, Section 3] except that, for technical reasons, we have the condition instead of . Because SDI does not involve tuning parameters that govern its approximation properties of the nonparametric constituents (such as with NIS and SPAM), Assumption 2 can be relaxed to allow for different levels of smoothness in different dimensions and, by straightforward modifications of our proofs, one can show that SDI adapts automatically. Alternatively, instead of Assumption 2, as we shall see, stronger conclusions can be provided if we impose a monotonicity constraint, namely, Assumption 3. Note that this monotonicity assumption encompasses many important “shape constrained” statistical models such as linear or isotonic regression.
Assumption 4 is essentially the so-called “partial orthogonality” condition in marginal screening methods [13]. Importantly, it allows for correlation between the relevant variables , unlike previous works on tree based variable selection [24, 29]. Notably, NIS and SPAM do allow for dependence between relevant and irrelevant variables, under suitable assumptions on the data matrix of basis functions. However, these assumptions are difficult to translate in terms of the joint distribution of the predictor variables and difficult to verify given the data.
Assumption 5 is stated as is for clarity of exposition and is not strictly necessary for our main results to hold. For instance, we may assume instead that the marginal densities of the relevant variables are compactly supported and uniformly bounded above and below by a strictly positive constant, as in [11, 19]. In fact, even these assumptions are not required. If the marginal projection is monotone (i.e., Assumption 3), no marginal distributional assumptions are required, that is, each for could be continuous, discrete, have unbounded support, or have a density that vanishes or is unbounded. More generally, similar distributional relaxations are made possible by the fact that CART decision trees are invariant to monotone transformations, enabling us to reduce the general setting to the case where each predictor variable is uniformly distributed on . See Remark 3 for details.
Remark 3.
Let and be the quantile function and the cumulative distribution function of , respectively. Recall the Galois inequalities state that if and only if and furthermore that almost surely. Then, choosing we see that, almost surely, if and only if . Therefore, almost surely,
This means that for continuous data, the problem can be reduced to the uniform case by pre-applying the marginal cumulative distribution function to each variable, since . Note that the marginal projections now equal the composition of the original with , i.e., . By the chain rule from calculus, if satisfies Assumption 2, then so does .
5.3 Theory for variable ranking and model selection
Here our goal will be to provide variable ranking and model selection guarantees of SDI using the assumptions in Section 5.1. Again, in this section, we sketch the proofs, but the full versions can be found in Appendices D and E.
5.3.1 Preliminary results
The high level idea will be to show that the impurity reductions for relevant variables dominate those for irrelevant variables with high probability, meaning that relevant and irrelevant variables are correctly ranked.
The following two propositions provide high probability lower bounds on the impurity reduction for relevant variables, the size of which depend on whether we assume Assumption 2 or Assumption 3.
Our first result deals with general, smooth marginal projections. Remarkably, it shows that with high probability, captures a portion of the variance in the marginal projection.
Proposition 1.
Next, we state an analogous bound, but under a slightly different assumption on the marginal projection. It turns out that if the marginal projection is monotone, we can obtain a stronger result, which is surprisingly independent of the smoothness level.
Proof sketch of Propositions 1 and 2.
We sketch the proof of Proposition 1; the proof of Proposition 2 is based on similar arguments. The main idea is to apply Lemma 1 with equal to a modified polynomial approximation to . This is done to temper the effect of the factor from Lemma 1, by controlling and individually.
To construct such a function, we first employ a Jackson-type estimate [23] in conjunction with Assumption 2 and Bernstein’s theorem for polynomials [22] to show the existence of a good polynomial approximation (of degree ) to . We then construct by redefining to be constant in a small neighborhood around each of its local extrema, which ensures that each resulting stationary interval of has a sufficiently large length. Since is a polynomial of degree , it has at most local extrema, and thus the number of stationary intervals of will also be at most .
Next, we use concentration of measure to ensure that each stationary interval of is saturated with enough data, effectively providing a lower bound on . Executing this argument reveals that valid choices of and (which come from optimizing a bound on the supremum norm between and ) are:
Plugging these values into the lower bound (9) in Lemma 1, we find that with high probability,
| (15) | ||||
Thus, the lower bound in Proposition 1 will follow if we can show that the squared sample covariance factor in (15) exceeds with high probability. To this end, note that
| (16) | ||||
With high probability, (I) can be lower bounded by , where is some constant, using the approximation properties of for , per the choice of and from above, and a concentration inequality for the sample variance of . Furthermore, since has conditional mean zero, a Hoeffding type concentration inequality shows that, with high probability, (II) is larger than any (strictly) negative constant, including . Combining this analysis from (15) and (16), we obtain the high probability lower bound on given in Proposition 1. ∎
Next, we need to ensure that there is a sufficient separation in the impurity reductions between relevant and irrelevant variables. To do so, we use Lemma 2 along with the partial orthogonality assumption in Section 5.1 to show that the impurity reductions for irrelevant variables will be small with high probability.
Lemma 3.
5.3.2 Main results
Assuming we know the size of the support , we can use the SDI ranking from Algorithm 1 to choose the top most important variables. Alternatively, if is unknown, we instead choose an asymptotic threshold of the impurity reductions to select variables; that is, . We state our variable ranking guarantees in terms of the minimum signal strength of the relevant variables:
which is the same as the minimum variance parameter in independence screening papers (e.g., [11, Assumption C]). Note that measures the minimum contribution of each relevant variable alone to the variance in , ignoring the effects of the other variables.
Theorem 2.
Remark 4.
As mentioned earlier, stronger results can be obtained if we assume that the marginal projections are monotone. In our next theorem, notice that we do not have to make any additional smoothness assumptions, nor do we require any distributional assumptions on the relevant variables, other than that they are independent of the irrelevant ones.
Theorem 3.
Remark 5.
When is unknown, Propositions 1 and 2 and Lemma 3 imply that the oracle threshold choices
| (21) |
ensure that
and hence will yield the same high probability bounds (19) and (20), respectively. Thus, while the permutation and elbow methods from Section 2.5 are somewhat ad-hoc, if they, at the very least, produce thresholds that are close to (21), then high probability performance guarantees are still possible to obtain.
5.4 Minimum signal strengths
Like all marginal screening methods, the theoretical basis for SDI is that each marginal projection for a relevant variable should be nonconstant, or equivalently, that . Note that when the relevant variables are independent and the underlying model is additive, per (1), the marginal projections equal the component functions of the additive model. Hence, , which will always be strictly greater than zero. As Theorems 2 and 3 show, controls the probability of a successful ranking of the variables. In practice, many of the relevant variables may have very small signals—therefore we are particularly interested in cases where is allowed to become small when the sample size grows large, as we now discuss.
We see from Theorem 2 that in order to have model selection consistency with probability at least , it suffices to have
| (22) |
up to constants that depend on , , , and . That is, (22) is a sufficient condition on the signal of all relevant variables so that as . Similarly, we see from Theorem 3 that
| (23) |
is sufficient to guarantee model selection consistency for monotone marginal projections. A particularly striking aspect of (23) is that the rate is independent of the smoothness of the marginal projection. This means that the “difficulty” of detecting a signal from a general monotone marginal projection is essentially no more than if the marginal projection was linear.
5.5 SDI for binary classification
Our theory for SDI can also naturally be extended to the context of classification, as we now describe. For simplicity, we focus on the problem of binary classification where . To begin, we first observe that Gini impurity and variance impurity are equivalent up to a factor of two [30, Section 3]. Thus, we can use the same criterion to rank the variables. Next, we identify the marginal projection as the marginal class probability
Because of these connections to the regression setting, the results in Section 5.3 hold verbatim for classification under the same assumptions therein with , , and . An interesting special case arises when for some monotone link function and for some positive semi-definite matrix . Using the fact that Gaussian random vectors are conditionally Gaussian distributed, it can be shown that the marginal projection is monotone and therefore satisfies Assumption 3. Consequently, for example, logistic regression with Gaussian data inherits the same stronger conclusions as Theorem 3.
6 Comparing SDI with other model selection methods
In this section, we compare the finite sample guarantees of SDI given in Section 5.3 and Section 4 to those of NIS, Lasso, and SPAM. To summarize, we find that SDI enjoys model selection consistency even when the marginal signal strengths of the relevant variables are smaller than those for NIS and SPAM. We also find that the minimum sample size of SDI for high probability support recovery is nearly what is required for Lasso, which is minimax optimal. Finally, we show that SDI can handle a larger number of predictor variables than NIS and SPAM.
Minimum signal strength for NIS
We analyze the details of [11] to uncover the corresponding threshold for NIS. In order to have model selection consistency, the probability bound in [11, Theorem 2] must approach one as , which necessitates
| (24) |
where is the number of spline basis functions and is a free parameter (in the notation of [11]). However notice that by [11, Assumption F], we must also have that , and combining this with (24) shows that we must have
| (25) |
Now substituting (24) and (25) into ([11, Assumption C]), it follows that we have
for NIS, which is a larger minimum signal than our (22).
Minimum signal strength for SPAM
Minimum sample size for consistency
Consider the linear model with Gaussian variates from Theorem 1, where for simplicity we additionally assume that is the identity matrix, yielding .
Following the same steps used to prove Theorem 2 but using Theorem 1 and Lemma 2 instead, we can derive a result similar to Theorem 2 for the probability of exact support recovery, but for a linear model with Gaussian variates. The full details are in Appendix C. With the specifications and , we find that a sufficient sample size for high probability support recovery is
which happens when
| (26) |
Now, it is shown in [41, Corollary 1] that the minimax optimal threshold for support recovery under these parameter specifications is , which is achieved by Lasso [42]. Amazingly, (26) coincides with this optimal threshold up to and factors, despite SDI not being tailored to linear models.
Maximum dimensionality
Suppose the signal strength is bounded above and below by a positive constant when the sample size increases. Then Theorems 2 and 3 show model selection consistency for SDI up to dimensionality . This is larger than the maximum dimensionality for NIS [11, Section 3.2], thus applying to an even broader spectrum of ultra high-dimensional problems. Furthermore, when , SPAM is able to handle dimensionality up to [35, Equation (45)], which is again lower than the dimensionality for SDI.
7 Experiments
In this section, we conduct computer experiments of SDI with synthetic data. As there are many existing empirical studies of the related MDI measure [24, 29, 30, 31, 32, 38, 43, 44], we do not aim for comprehensiveness.
Our first set of experiments compare the performance of SDI with SIS, NIS, Lasso, and SPAM, MDI for a single CART decision tree, and MDI for a random forest. In Section 7.1, we assess performance based on the probability of exact support recovery. To ensure a fair comparison between SDI and the other algorithms, we assume a priori knowledge of the true sparsity level , which is incorporated into Lasso and SPAM by specifying the model degrees of freedom in advance. These simulations were conducted in R using the packages rpart for SDI, SAM for SPAM, SIS for SIS, and glmnet for Lasso with default settings. We also compute two versions of MDI: MDI RF using the package randomForest with ntrees = 100 and MDI CART (based on a pruned CART decision tree) using the package rpart with default settings. The source code from [11] was used to conduct experiments with NIS.
The second set of experiments, in Section 7.2, deals with the case when the sparsity level is unknown, whereby we demonstrate the empirical performance of the permutation and elbow methods from Section 2.5.
In all our experiments, we generate samples from an -sparse additive model for various types of components . The error distribution is , the sparsity level is fixed at , and the ambient dimension is fixed at . We consider the following model types.
Model 1
Consider linear additive components and variables , where the covariance matrix has diagonal entries equal to and off-diagonal entries equal to some constant . We set the noise level and consider correlation level .
Model 2
Consider linear additive components with noise level . The variables are i.i.d standard normal random variables and where . Notice that even though the model is linear, the marginal projections and are nonlinear. This is similar to Example 2 of [11].
Model 3
We consider additive components , where (i.e., all predictor variables are independent) and .
Model 4
Consider the nonlinear additive components
Let and set the noise level . This is the same model as Example 3 of [11] with (and correlation ).
Model 5
We consider monotone additive components
The variables are and we have noise level . This is similar to Model A in [3, Section 3].
In our simulations, Models 1 tests the correlated Gaussian linear model setting of Theorem 1. Model 2 modifies the setting of Theorem 1 by including a relevant variable that is a nonlinear function of another relevant variable so that some marginal projections are nonlinear. Models 3 and 4 are examples of the setting of Theorem 2 for general nonparametric models. Model 5 considers the shape-constrained setting of Theorem 3. Though our main results apply to general nonparametric models, we have chosen to focus our experiments on additive models to facilitate comparison with other methods designed for the same setting.
7.1 Exact support recovery
For our experiments on exact recovery, we fix the sparisty level and estimate the probability of exact support recovery by running independent replications and computing the fraction of replications which exactly recover the support of the model. In Figure 1, we plot this estimated probability against various sample sizes , namely, . In agreement with Theorem 1, in Figure 1(a), we observe that SDI and SIS exhibit similar behavior for correlated Gaussian linear models, a case in which all methods appear to achieve model selection consistency. However, in Figure 1(b), we see that SDI is significantly more robust than SIS to a linear model when the marginal projections are nonlinear. As expected, Figure 1(c) and 1(d) show that SDI, NIS, SPAM, and MDI significantly outperform SIS and Lasso when the model has nonlinear and non-monotone additive components. For more irregular component functions such as sinusoids, SDI appears to outperform SPAM, as seen in Figure 1(c). In agreement with Theorem 3, Figure 1(e) shows that SDI appears to perform better for nonlinear monotone components, though all methods (even linear methods such as Lasso and SIS) appear to perform better as well. In general, for additive models, SDI appears to outperform MDI CART though it appears to sacrifice a small amount of accuracy for simplicity compared to its progenitor MDI RF. In summary, in agreement with Theorems 2 and 3, Figure 1 demonstrates the robustness of SDI across various additive models.


7.2 Data driven choices of
We now consider the case when is unknown. As we have already demonstrated the performance of SDI in Section 7.1, here we examine how well the data-driven thresholding methods discussed in Section 2.5 can estimate the true sparsity level .
We first consider Model 5 and fix the sparsity level and the sample size . In Figure 2(a), we plot the probability of exact support recovery (averaged over independent replications) using the permutation method against the number of permutations. After a very small number of permutations, the significance level and performance of the algorithm appear to stabilize. For comparison, in Figure 2(b), we show the graph of the ranked impurity reductions (SDI importance measures) used for the elbow method. When there is no correlation between irrelevant and relevant variables, as is the case with Model 5, the permutation method may be more precise than the elbow method.
However, as discussed in Section 2.5, the permutation method may be inaccurate if the irrelevant and relevant variables are correlated. To illustrate this, we now consider Model 1 with sparsity level . As we can see from Figure 2(c), the permutation method fails completely. Using permutations, it chooses a threshold , which will lead to all variables being selected, as can be seen from the ranked impurity reductions shown in Figure 2(d). In other words, when there is strong correlation between the variables, the permutation method significantly underestimates the threshold , which in turn, creates too many false positives. In contrast, as can be seen from Figure 2(d), the ranked impurity reductions still exhibit a distinct “elbow”, from which the relevant and irrelevant variables can be discerned.


8 Discussion and conclusion
In this paper, we developed a theoretically rigorous approach for variable selection based on decision trees. The underlying approach is simple, intuitive, and interpretable—we test whether a variable is relevant/irrelevant by fitting a decision stump to that variable and then determining how much it explains the variance of the response variable. Despite its simplicity, SDI performs favorably relative to its less interpretable competitors. Furthermore, due to the parsimony of the model, there is also no need to perform variable bandwidth selection or calibrate the number terms in basis expansions.
On the other hand, we have sacrificed generality for analytical tractability. That is, decision stumps are poor at capturing interaction effects and, therefore, an importance measure built from a multi-level decision tree (such as MDI) may be more appropriate for models with more than just main effects. However, the presence of multi-level splits adds an additional layer of complexity to the analysis that, at the moment, we do not know how to overcome. It is also unclear how to leverage these additional splits to strengthen the theory. While out of the scope of the present paper, we view this as an important problem for future investigation. It is our hope that the tools in this paper can be used by other scholars to address this important issue.
To conclude, we hope that our analysis of single-level decision trees for variable selection will shed further light on the unique benefits of tree structured learning.
9 Appendix
A Appendix
In this appendix, we first prove Lemma 2 in detail in Appendix A. We then prove Theorem 1 on linear models with Gaussian variates in Appendix B and then use Theorem 1 to determine a sufficient sample size for model selection consistency (mentioned in Section 6) in Appendix C. Finally, we prove Propositions 1 and 2 in Appendix D and then prove Theorems 2 and 3 in Appendix E.
A Proof of Lemma 2
Let be a permutation of the data such that . Recall from the representation (6) that we have
Now, since
we can rewrite (III) as
Therefore, we have that
| (A.1) | ||||
where we use, in succession, the inequality for any real numbers , , and , and the fact that the maximum of a sum is at most the sum of the maxima. To finish the proof, we will bound the terms involving , , and separately.
For the last term in (A.1), notice that by the Cauchy-Schwartz inequality we have
which is exactly equal to
Therefore we have shown that
| (A.2) |
To bound the first term in (A.1), by a union bound we have that
| (A.3) |
Next, notice that, conditional on , is a sum of independent, sub-Gaussian, mean zero random variables. Thus, by the law of total probability, we have that (A.3) is equal to
and, by Hoeffding’s inequality for sub-Gaussian random variables, is bounded by
Note that here we have implicitly used the fact that . It thus follows that with probability at least that
| (A.4) |
A similar argument shows that with probability at least , the second terms in (A.1) obeys
| (A.5) |
Therefore, substituting (A.2), (A.4), and (A.5) into (A.1) and using a union bound, it follows that with probability at least ,
B Proof of Theorem 1
The goal of this section is to prove Theorem 1. In the first section, we prove the lower bound (10) and in the second section, we prove the upper bound (11).
Throughout this section, for brevity, we let .
B.1 Proof of the lower bound (10)
Choosing (which is monotone) in Lemma 1 to get that
Now observe that is the empirical Pearson sample correlation between two correlated normal distributions. If , by [18, Equation (44)], we have that
| (B.6) | ||||
If we can show the same bound on . Again by [18, Equation (44)], we have the similar bound
| (B.7) | ||||
Therefore because of (B.6) and (B.7), regardless of the sign of , it follows that there exists a universal constant for which
| (B.8) | |||
where we used and Wendel’s inequality [45] in the second inequality (B.8).
Thus, we have that with probability at least that
This completes the first half of the proof of Theorem 1.
B.2 Proof of the upper bound (11)
We first state the following sample variance concentration inequality, which will be helpful.
Lemma B.1.
Let be i.i.d. . For any , we have
| (B.9) |
and
| (B.10) |
Proof of Lemma B.1.
Now we are ready to prove the upper bound (11). We begin with the inequality (13), as shown in the proof sketch of Theorem 1. We aim to upper bound the right hand side of (13) using Lemma B.1. Since the samples are i.i.d., using (B.10) and choosing , we find that with probability at least , we have that . Similarly, choosing in (B.9), we also have that with probability at least that . Substituting these concentration inequalities into the right hand side of (13), it follows by a union bound that with probability at least ,
Finally, noticing that completes the proof.
C Proof of Model Selection Consistency for Linear Models
Recall the setting mentioned under the heading “Minimum sample size for consistency” in Section 6, which considers the same linear model with Gaussian variates from Theorem 1. To reiterate, we assume that is the identity matrix, , and , all of which are special cases of the more general setting considered in [41, Corollary 1]. Under these assumptions, we then have for any and for . Our goal is to show that samples suffice for high probability model selection consistency.
Choosing in (10) applied to and using (7), there exists a universal positive constant such that with probability at least , we have
Therefore by a union bound over all relevant variables, we have that with probability at least ,
| (C.11) |
Furthermore, by applying (11) for (and noting that ) and using (7), with probability at least , we have
Therefore by a union bound over all irrelevant variables we have that with probability at least ,
Now, choosing for some appropriate constant which only depends on to match (C.11), we see by a union bound that
| (C.12) | ||||
Since for all , (C.12) implies that if , then . Hence, a sufficient sample size for consistent support recovery is
as desired.
D Proof of Propositions 1 and 2
This section will mainly be devoted to proving Proposition 1. First we will present the machinery which will be used to prove Proposition 1. At the end of the section we will complete the proof of Proposition 1 and prove Proposition 2 by recycling and simplifying the proof of Proposition 1.
First, we state and prove a lemma that will be used in later proofs. Though stated in terms of general probability measures, we will be specifically interested in the case where is the empirical probability measure and is the empirical expectation , both with respect to a sample of size .
Lemma D.2.
For any random variables and with finite second moments with respect to a probability measure ,
Proof of Lemma D.2.
The following sample variance concentration inequality will also come in handy.
Lemma D.3 (Equation 5, [34]).
Let be a random variable bounded by . Then for all ,
As explained in the main text, the key step in the proof of Proposition 1 is to apply Lemma 1 with a good approximation to the marginal projection that also has a sufficiently large number of data points in every one of its stationary intervals. The following lemma provides the precise properties of such an approximation.
Lemma D.4.
Suppose satisfies Assumption 2. Let be a positive constant and let be a positive integer such that . There exists a function with at most stationary intervals such that, with probability at least , both of the following statements are simultaneously true:
-
1.
The number of data points in any stationary interval of is between and .
-
2.
, where and are some constants depending on , , , and , and denotes the empirical expectation.
Proof of Lemma D.4.
Recall that is defined over , so even though we restrict our attention , we can assume it is bounded over the larger interval for all . By [23, Theorem VIII], there exists a polynomial of degree such that
where , is the Lipschitz constant from Assumption 2, and is a universal constant given in [23, Theorem I]. Since whenever , we also have that
| (D.17) |
where is a constant.
Let be the collection of (at most) stationary points of in . We assume that ; otherwise we remove points from until this holds. Let .
We will now show that Properties 1 and 2 of Lemma D.4 are satisfied by the function
| (D.18) |
First, it is clear that has at most stationary intervals. Next, notice that by the multiplicative version of Chernoff’s inequality [1, Proposition 2.4], since each stationary interval has length , we have
and
Thus, by a union bound, the probability that
is at least . Since all stationary intervals are disjoint and are contained in , we have or , which implies that . Therefore, we know that
| (D.19) |
Notice that if , then
and if , then
Thus, for all , we have
which when combined with (D.19) proves Property 1 of Lemma D.4.
To prove Property 2 of Lemma D.4 we use the triangle inequality and part of Property 1:
| (D.20) |
In view of (D.17), to bound we aim to bound
Notice that by Bernstein’s theorem for polynomials [22, Theorem B2a], we also have
| (D.21) |
where and we used the fact that for . Additionally, because each is a stationary point, , and hence by a second order Taylor approximation, we have
| (D.22) |
for .
Returning to the proof of Proposition 1, by Lemma 1 along with Lemma D.4, we have that with probability at least that
| (D.23) |
Now we choose
| (D.24) |
where is a constant to be specified in (D.26), so that Property 2 of Lemma D.4 becomes
| (D.25) | ||||
with probability at least .
Recall the condition as part of [23, Theorem VIII], which states that the degree of the polynomial must be greater than the order of Lipschitz derivative in order to approximate the function well. Since, , this condition will be satisfied if we make the following choice:
| (D.26) |
In the next Lemma, we use (D.27) along with Lemma D.3 to obtain a lower bound on the right hand side of (D.23).
Lemma D.5.
With probability at least , we have that
Proof of Lemma D.5.
Recalling (16), we will prove Lemma D.5 by first getting a concentration bound on (I) and then getting a concentration bound on (II).
To get a concentration bound on (I), we need Lemma D.3 to lower bound the sample variance on the right hand side of inequality (D.27). Choosing and (which is greater than zero by the choice of in (D.26)), notice that Lemma D.3 gives us
so that by (D.27),
with probability at least .
Now we need to get a concentration bound for (II). Let . We need to bound
For notational simplicity, we let be the data matrix with as rows. First notice that
Now, by the sample independence of the errors , we can write the above as
where we used Assumption 6 and the fact that . Recalling that depends on , we have
| (D.28) | ||||
where we used sample independence in the second equality. Finally, applying Hoeffding’s Lemma along with the fact that , we have that (D.28) is bounded above by
Having bounded the moment generating function, we can now apply Markov’s inequality to see that
where the last inequality follows by maximizing over . Choosing , we have by a union bound that,
with probability at least . ∎
Proof of Proposition 1.
Recalling our concentration bound (D.23) along with Lemma D.5, it follows that with probability at least that
| (D.29) |
where we used our choice of and in (D.24) and in (D.26) and is some constant which only depends on , , , and . Notice in the last inequality (D.29) we bound in the denominator with .
To conclude the proof, we simplify our probability bound. To this end, notice that
where the last inequality holds by assumption that and the fact that . Therefore we have for some constant which depends only on , , , , and . ∎
Proof of Proposition 2.
The main difference with Proposition 1 is that when is monotone we now have . We no longer need the approximations or in Lemma D.4, in (D.24) and in (D.26), or Lemma D.2. We will only need Lemma 1 and a version of Lemma D.5. Instead of applying Lemma 1 with an approximation to the marginal projection, we can choose to equal directly to see that
| (D.30) |
Next, we have
| (D.31) | ||||
Now, we follow the same steps as the proof of Lemma D.5 to lower bound (D.31). For (IV), again use Lemma D.3 with but choose instead to get
| (D.32) | ||||
For (V), we can follow the same steps as the second half of the proof of Lemma D.5 to see that
However, for (V), we instead choose to get
| (D.33) |
Now using a union bound and substituting the events in (D.33) and (D.32) into (D.31), we see that with probability at least , we have that
| (D.34) |
E Proof of Theorems 2 and 3
In this section we use Proposition 1 and Proposition 2 along with Lemma 3 to complete the proofs of Theorem 2 and Theorem 3.
Proof of Theorem 2.
The high-level idea is to show that the upper and lower bounds on the impurity reductions for irrelevant and relevant variables from Lemma 3 and Proposition 1, respectively, are well-separated.
By Proposition 1 for all variables and a union bound, we see that with probability at least , we have
| (E.35) |
By Lemma 3 and applying a union bound over all variables in , we have that with probability at least that
| (E.36) |
Recall that if we know the size of the support , then consists of the top impurity reductions. Note that choosing in (E.36) will give us a high probability upper bound on for irrelevant variables which is dominated by the lower bound on for relevant variables in (E.35). Thus, by a union bound, it follows that with probability at least , we have . ∎
Proof of Theorem 3.
The proof is similar to that of Theorem 2 except that we use Proposition 2 in place of Proposition 1.
By Proposition 2 for all variables and a union bound, we see that with probability at least ,
Again, we have by Lemma 3 and a union bound over all variables in that with probability at least that
| (E.37) |
Choosing in (E.37) and using a union bound, it follows that with probability at least , we have . ∎
References
- [1] D. Angluin and L.G. Valiant. Fast probabilistic algorithms for Hamiltonian circuits and matchings. Journal of Computer and System Sciences, 18:155–193, 1979.
- [2] Anestis Antoniadis and Jianqing Fan. Regularization of wavelet approximations. Journal of the American Statistical Association, 96(455):939–955, 2001.
- [3] Tharmaratnam K. Bergersen, L. C. and I. K. Glad. Monotone splines lasso. Computational Statistics and Data Analysis, 77:336–351, 2014.
- [4] Leo Breiman. Random forests. Machine Learning, 45(1):5–32, 2001.
- [5] Leo Breiman. Statistical modeling: The two cultures. Statistical Science, 16(3):199–231, 2001.
- [6] Leo Breiman, Jerome Friedman, RA Olshen, and Charles J Stone. Classification and regression trees. Chapman and Hall/CRC, 1984.
- [7] W. Buckinx, G. Verstraeten, and D. Van den Poel. Predicting customer loyalty using the internal transactional database. Expert Systems with Applications, 32:125–134, 2007.
- [8] Alexandre Bureau, Josée Dupuis, Kathleen Falls, Kathryn L Lunetta, Brooke Hayward, Tim P Keith, and Paul Van Eerdewegh. Identifying SNPs predictive of phenotype using random forests. Genetic Epidemiology, 28:171–82, 2005.
- [9] Ramón Díaz-Uriarte and Sara Alvarez de Andrés. Gene selection and classification of microarray data using random forest. BMC Bioinformatics volume, 7(3):171–82, 2006.
- [10] Bradley Efron, Trevor Hastie, Iain Johnstone, and Robert Tibshirani. Least angle regression. The Annals of Statistics, 32:407–499, 2004.
- [11] Jianqing Fan, Yang Feng, and Rui Song. Nonparametric independence screening in sparse ultra-high-dimensional additive models. Journal of the American Statistical Association, 106(494), 2011.
- [12] Jianqing Fan and Jinchi Lv. Sure independence screening for ultra-high dimensional feature space. Journal of the Royal Statistical Society, Series B, 70:849–911, 2008.
- [13] Jianqing Fan and Rui Song. Sure independence screening in generalized linear models with NP-dimensionality. The Annals of Statistics, 38(6):3567–3604, 2010.
- [14] Jerome H Friedman. Greedy function approximation: a gradient boosting machine. Annals of Statistics, pages 1189–1232, 2001.
- [15] Pierre Geurts, Damien Ernst, and Louis Wehenkel. Extremely randomized trees. Machine Learning, 63(1):3–42, 2006.
- [16] Peter Hall and Hugh Miller. Using generalized correlation to effect variable selection in very high dimensional problems. Journal of Computational and Graphical Statistics, 18(3):533–550, 2009.
- [17] T. Hastie, R. Tibshirani, and J. Friedman. The Elements of Statistical Learning: Data Mining, Inference, and Prediction, Second Edition. Springer Series in Statistics. Springer New York, 2009.
- [18] Harold Hotelling. New light on the correlation coefficient and its transforms. Journal of the Royal Statistical Society. Series B, 15(2):193–232, 1953.
- [19] Jian Huang, Joel L Horowitz, and Fengrong Wei. Variable selection in nonparametric additive models. The Annals of Statistics, 38(4):2282–2313, 2010.
- [20] Vân Anh Huynh-Thu, Alexandre Irrthum, Louis Wehenkel, and Pierre Geurts. Inferring regulatory networks from expression data using tree-based methods. PLOS ONE, 2010.
- [21] Wayne Iba and Pat Langley. Induction of one-level decision trees. Machine Learning Proceedings, pages 233–240, 1992.
- [22] Dunham Jackson. Bernstein’s theorem and trigonometric approximation. Transactions of the American Mathematical Society, 40(2):225–251, 1936.
- [23] Dunham Jackson. The Theory of Approximation, volume 11. American Mathematical Society, 1991.
- [24] Jalil Kazemitabar, Arash Amini, Adam Bloniarz, and Ameet S Talwalkar. Variable importance using decision trees. In Advances in Neural Information Processing Systems, pages 426–435, 2017.
- [25] L.C. Keely and C.M. Tan. Understanding preferences for income redistribution. Journal of Public Economics, 92:944–961, 2008.
- [26] Jason M. Klusowski. Sparse learning with CART. In Advances in Neural Information Processing Systems, 2020.
- [27] B. Lariviere and D. Van den Poel. Predicting customer retention and profitability by using random forests and regression forests techniques. Expert Systems with Applications, 29:472–484, 2005.
- [28] B. Laurent and P. Massart. Adaptive estimation of a quadratic functional by model selection. The Annals of Statistics, 28(5):1302–1338, 2000.
- [29] Xiao Li, Yu Wang, Sumanta Basu, Karl Kumbier, and Bin Yu. A debiased MDI feature importance measure for random forests. In Advances in Neural Information Processing Systems 32, pages 8049–8059. Curran Associates, Inc., 2019.
- [30] Gilles Louppe. Understanding random forests: From theory to practice. arXiv preprint: arXiv:1407.7502, 2014.
- [31] Gilles Louppe, Louis Wehenkel, Antonio Sutera, and Pierre Geurts. Understanding variable importances in forests of randomized trees. In Advances in Neural Information Processing Systems, pages 431–439, 2013.
- [32] Scott M. Lundberg, Gabriel G. Erion, and Su-In Lee. Consistent individualized feature attribution for tree ensembles. arXiv preprint: arXiv:1802.03888, 2018.
- [33] Kathryn L. Lunetta, L. Brooke Hayward, Jonathan Segal, and Paul Van Eerdewegh. Screening large-scale association study data: exploiting interactions using random forests. BMC Genetics, 5(32):199–231, 2004.
- [34] Andreas Maurer and Massimiliano Pontil. Empirical Bernstein bounds and sample-variance penalization. In COLT, 2009.
- [35] Pradeep Ravikumar, Han Liu, John Lafferty, and Larry Wasserman. Spam: Sparse additive models. Journal of the Royal Statistical Society. Series B, 71(5):1009–1030, 2009.
- [36] Erwan Scornet. Trees, forests, and impurity-based variable importance. arXiv preprint arXiv:2001.04295, 2020.
- [37] Erwan Scornet, Gérard Biau, and Jean-Philippe Vert. Consistency of random forests. Annals of Statistics, 43(4):1716–1741, 2015.
- [38] Carolin Strobl, Anne-Laure Boulesteix, Achim Zeileis, and Torsten Hothorn. Bias in random forest variable importance measures: Illustrations, sources and a solution. BMC Bioinformatics, 8:563–564, 2007.
- [39] Robert Tibshirani. Regression shrinkage and selection via the lasso. Journal of the Royal Statistical Society: Series B, 58:267–288, 1996.
- [40] D. Van den Poel W. Buckinx. Customer base analysis: partial defection of behaviourally loyal clients in a non-contractual fmcg retail setting. European Journal of Operational Research, 164:252–268, 2005.
- [41] Martin J Wainwright. Information-theretic limits on sparsity recovery in the high-dimensional and noisy setting. IEEE Transactions on Information Theory, 55(12):5728–5741, 2009.
- [42] Martin J Wainwright. Sharp thresholds for high-dimensional and noisy sparsity recovery using -constrained quadratic programming (Lasso). IEEE Transactions on Information Theory, 55(5):2183–2202, 2009.
- [43] Huazhen Wang, Fan Yang, and Zhiyuan Luo. An experimental study of the intrinsic stability of random forest variable importance measures. BMC Bioinformatics, 17(60), 2016.
- [44] Pengfei Wei, Zhenzhou Lu, and Jingwen Song. Variable importance analysis: A comprehensive review. Reliability Engineering and System Safety, 142:399–432, 2015.
- [45] JG Wendel. Note on the gamma function. The American Mathematical Monthly, 55(9):563–564, 1948.
- [46] J. Zhang and M. Zulkernine. A hybrid network intrusion detection technique using random forests. Proceedings of the First International Conference on Availability, Reliability and Security, pages 262–269, 2006.
- [47] J. Zhang, M. Zulkernine, and A. Haque. A hybrid network intrusion detection technique using random forests. IEEE Transactions on Systems, Man, and Cybernetics—Part C: Applications and Reviews, 38(5):649–659, 2008.