Non-invasive quantitative imaging of selective microstructure-sizes with magnetic resonance
Abstract
Extracting reliable and quantitative microstructure information of living tissue by non-invasive imaging is an outstanding challenge for understanding disease mechanisms and allowing early stage diagnosis of pathologies. Magnetic Resonance Imaging is the favorite technique to pursue this goal, but still provides resolution of sizes much larger than the relevant microstructure details on in-vivo studies. Monitoring molecular diffusion within tissues, is a promising mechanism to overcome the resolution limits. However, obtaining detailed microstructure information requires the acquisition of tens of images imposing long measurement times and results to be impractical for in-vivo studies. As a step towards solving this outstanding problem, we here report on a method that only requires two measurements and its proof-of-principle experiments to produce images of selective microstructure sizes by suitable dynamical control of nuclear spins with magnetic field gradients. We design microstructure-size filters with spin-echo sequences that exploit magnetization “decay-shifts” rather than the commonly used decay-rates. The outcomes of this approach are quantitative images that can be performed with current technologies, and advance towards unravelling a wealth of diagnostic information based on microstructure parameters that define the composition of biological tissues.
The development of nanosized sensors with novel quantum technologies is aiming at nanoscale imaging of biological tissues for unveiling the biophysics of pathologies at such relevant scales (Staudacher et al., 2015; Wang et al., 2019; Barry et al., 2016; Glenn et al., 2015). Such imaging proposals are still based on invasive techniques. By contrast, Magnetic Resonance Imaging (MRI) has proven to be an excellent tool for acquiring non-invasive images, being applied on a daily basis for clinical diagnosis. However, the weak sensitivity for detecting the nuclear spins inherent to the biological tissues, typically limits the spatial resolution of in-vivo MRI to hundred of micrometers in pre-clinical scanners and to millimeters in clinical systems. This limitation imposes a challenge for existing methods to early detect diseases that produce changes at the cellular level (Padhani et al., 2009; Drago et al., 2011; White et al., 2013, 2014; Enzinger et al., 2015). Detecting these kind of pathologies in a development stage based on quantitative imaging of tissue microstructure parameters, will allow MRI to advance towards a new early diagnostic paradigm (Le Bihan, 2003; White et al., 2013, 2014; Xu et al., 2014; Enzinger et al., 2015; Grussu et al., 2017; Alexander et al., 2019).
Diffusion Weighted MRI (DWI) is a promising tool to probe microstructure information based on monitoring the dephasing of the nuclear spin precession due to Brownian molecular motion (Le Bihan, 2003; Grebenkov, 2007; Callaghan, 2011). The diffusion dynamics of molecules depends on tissue properties such as cell sizes, density, and other morphological features. A strong magnetic field gradient is applied to sense the microscopic motion of spins so that the the precession frequency depends on their instantaneous position. In addition, modulating the gradient strength as a function of time allows to probe the time dependent diffusion process of the molecules within tissues (Stepisnik, 1993; Callaghan, 2011; Álvarez et al., 2013; Shemesh et al., 2013). These dynamical control techniques are based on the Hahn spin-echo concept (Hahn, 1950) and its generalization to multiple echoes (Carr and Purcell, 1954). Within DWI they are called modulated gradient spin-echo (MGSE) sequences, where the phase accumulated by the spin’s precession is refocused at given times allowing to infer microscopic parameters in tissues and porous media (Stepisnik, 1993; Shemesh et al., 2013; Drobnjak et al., 2016; Nilsson et al., 2017; Novikov et al., 2019). However, obtaining detailed microstructure information is still challenging on in-vivo studies, as it requires tens of images demanding about an hour of acquisition time (Assaf et al., 2008; Alexander et al., 2010; Xu et al., 2014; Shemesh et al., 2015; Alexander et al., 2019; Novikov et al., 2019).
The decay of the nuclear spin signal under MGSE sequences is typically characterized by a decay-rate (Grebenkov, 2007; Callaghan, 2011). Here, we report that these decaying signals manifest a “decay-shift” that can be exploited to selectively probe microstructure-sizes. We develop size-filters based on the Non-uniform Oscillating Gradient Spin-Echo (NOGSE) concept that contrast the signal generated by two spin-echo sequences (Álvarez et al., 2013; Shemesh et al., 2013). The method probes different diffusion time scales while factoring out other relaxation mechanisms induced by gradient-modulation imperfections and effects. We exploit the NOGSE modulations to selectively probe the spin-echo decay-shift for producing quantitative images based on contrast intensities that reflect the probability of finding a specific microstructure-size. The present approach requires only two measurements, therefore significantly reducing the acquisition time compared to state-of-the-art methods that typically require tens of measurements to obtain quantitative information on microstructure-sizes based on fitting parameters (Assaf et al., 2008; Alexander et al., 2010; Ong and Wehrli, 2010; Xu et al., 2014; Shemesh et al., 2015; Alexander et al., 2019; Novikov et al., 2019). We analytically and experimentally demonstrate that these microstructure-size filters can be implemented with current technologies presenting a novel mechanism for quantitative and precision imaging diagnostic tools.
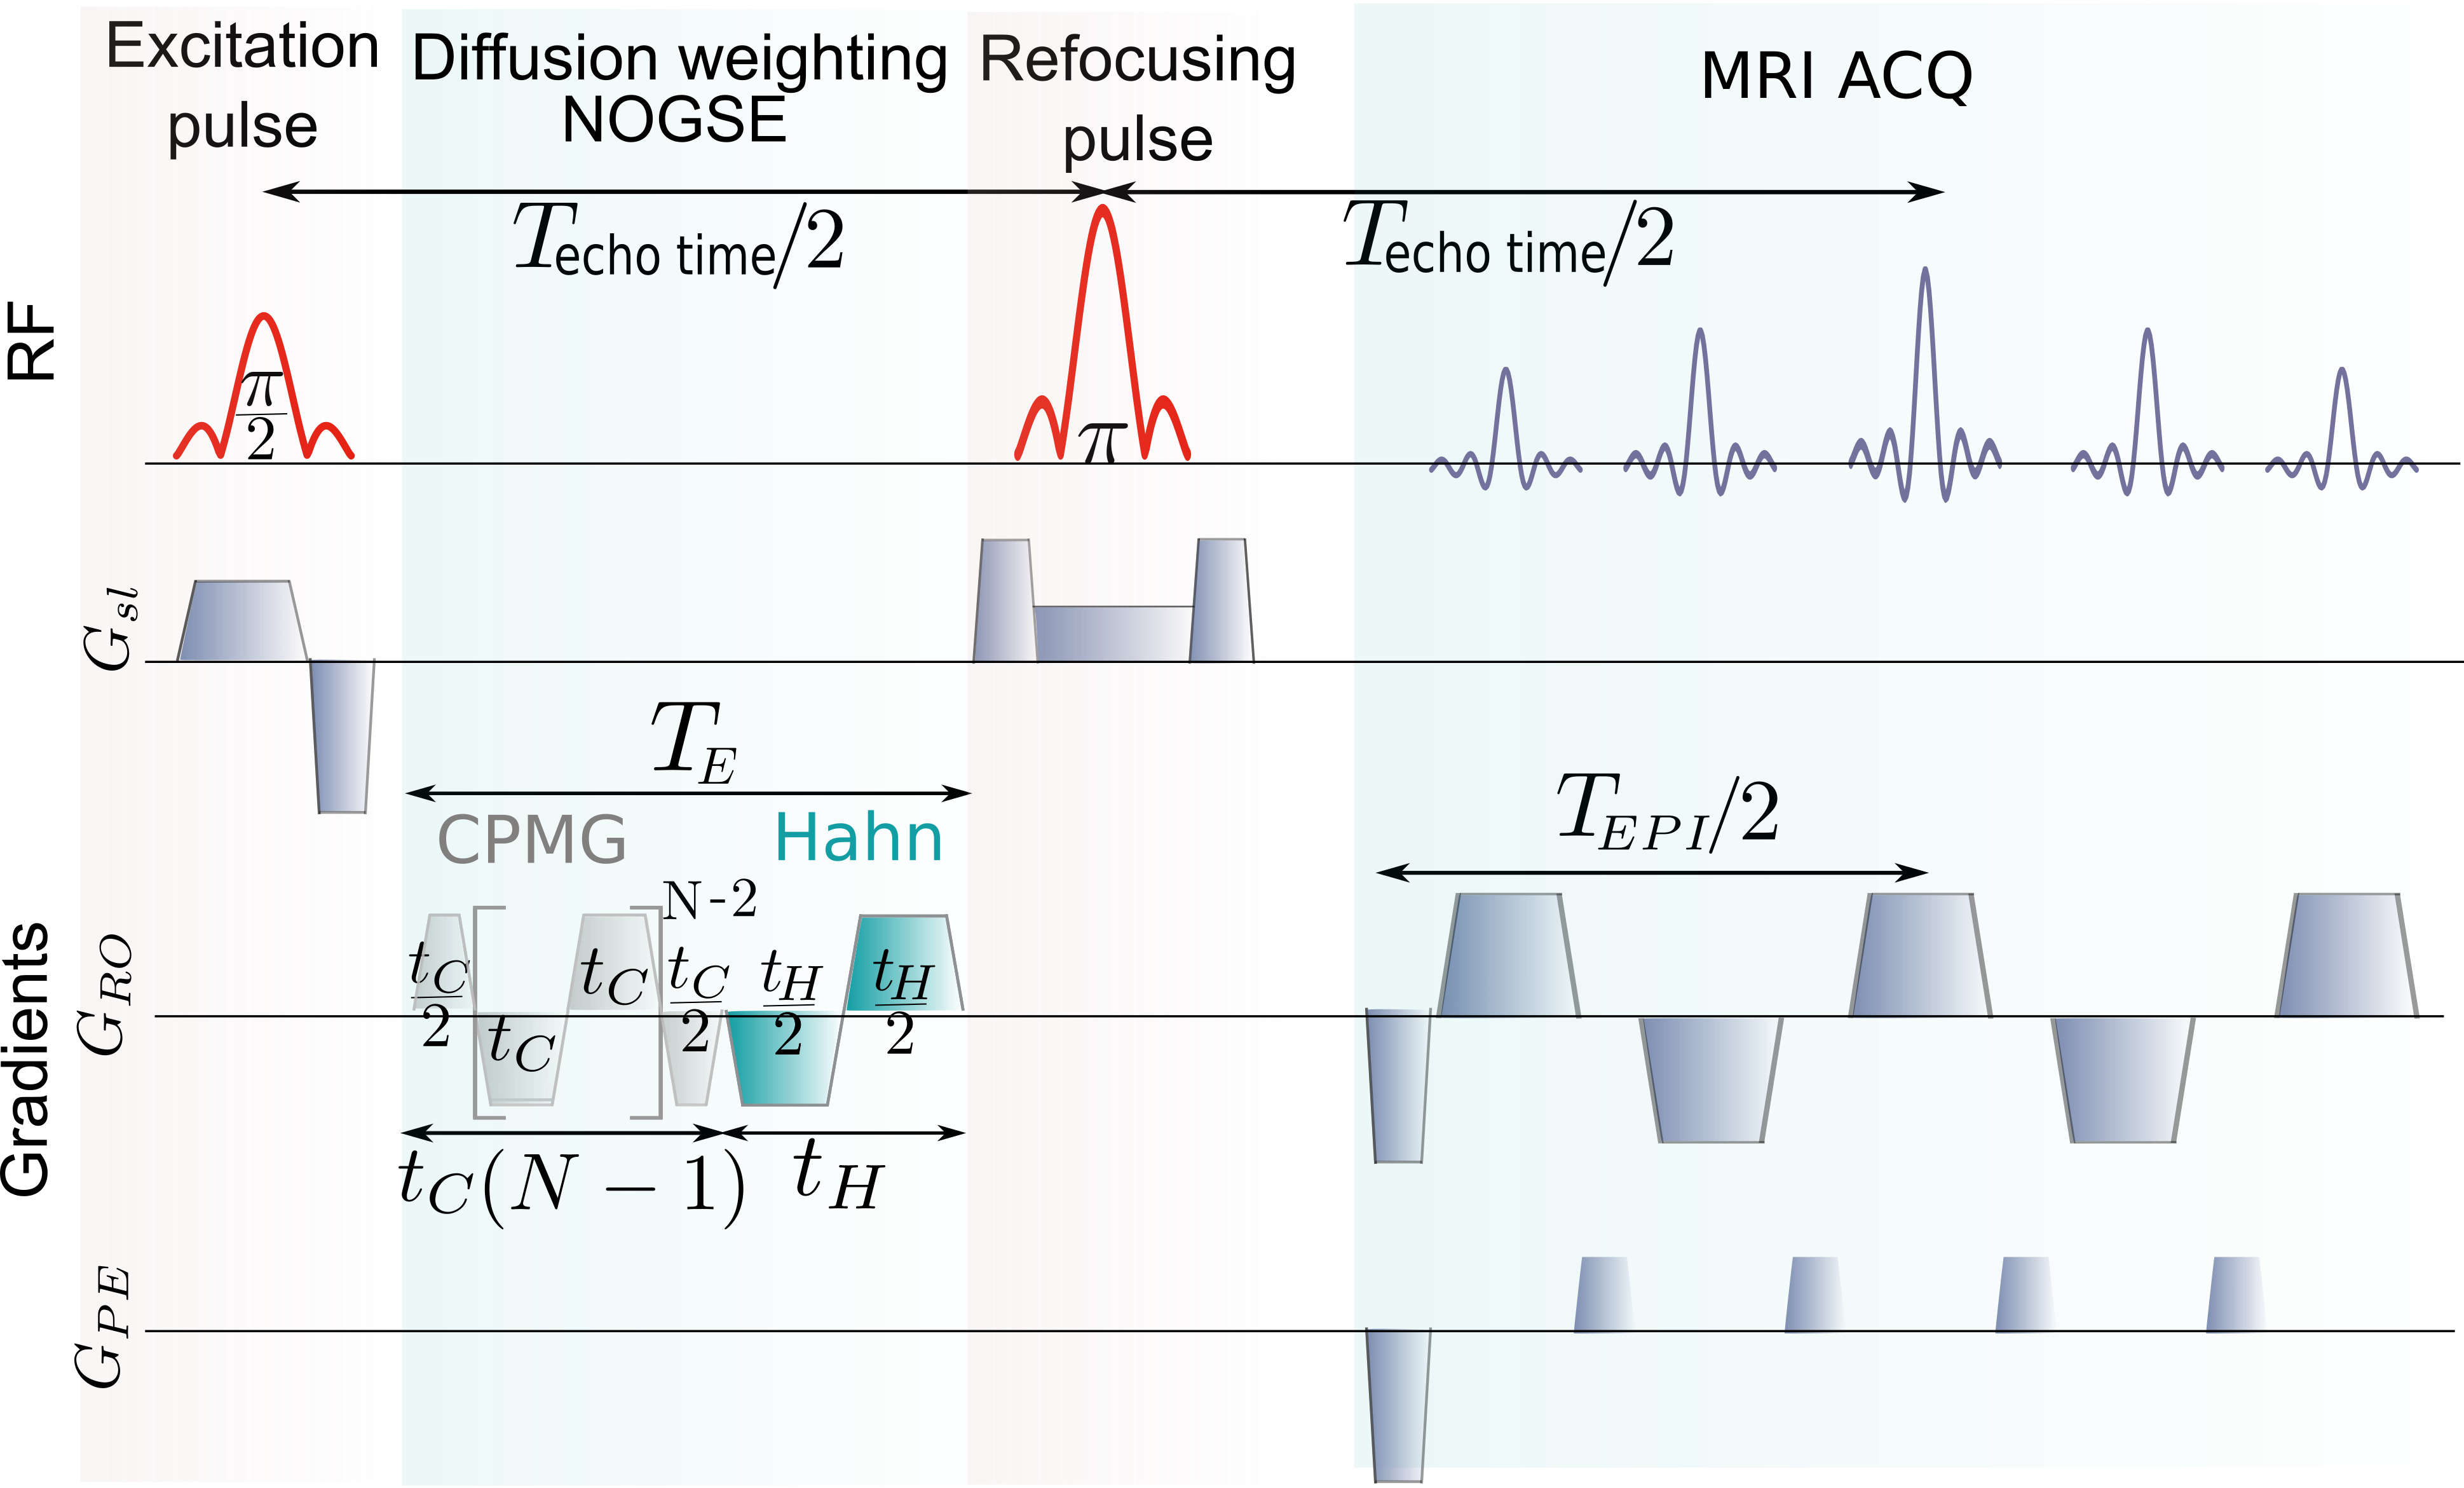
MRI of molecular-diffusion. The nuclear spins in molecules intrinsic to biological tissues, mainly from water’s protons, are typically observed on in-vivo MRI. They interact with an external uniform magnetic-field and a magnetic field gradient applied along the direction for spatial encoding. In a frame rotating at the resonance frequency , the precession frequency fluctuates reflecting the random motion of the molecular diffusion process (Grebenkov, 2007; Callaghan, 2011). Here, is the instantaneous position of the nuclear spin along the gradient direction and is the gyromagnetic ratio of the nucleus. The effective gradient strength may vary along time as , either by applying -pulses if the gradient is constant or directly by modulating the gradient’s sign and amplitude. The spins dephasing induced by the diffusion process is refocused by these control modulations forming the so-called spin-echoes (Hahn, 1950; Carr and Purcell, 1954) (Fig. 1a,b). At the evolution time of the control sequence, the spin-echo magnetization decays depending on how nuclear spins were scrambled by the diffusion process. The resulting magnetization at is then spatially encoded with an MRI acquisition sequence.
The spins acquire a random phase that typically follows a Gaussian distribution (Stepisnik, 1999). The magnetization in a voxel of the image becomes
| (1) |
The quadratic phase is averaged over the spin ensemble as (Stepisnik, 1993; Grebenkov, 2007; Callaghan, 2011)
| (2) |
which is expressed in terms of the control applied to the system by and the molecular displacement autocorrelation function (Stepisnik, 1993; Álvarez et al., 2013; Shemesh et al., 2013). Here is the instantaneous displacement of the spin position from its mean value, is the free diffusion coefficient, and is the correlation time of the diffusion process. The restriction length of the microstructure compartment in which molecular diffusion is taking place is then determined by the Einstein-Diffusion equation (Callaghan, 2011). Then, by monitoring the spin-echo decay by applying suitable control sequences, one can infer microstructure-sizes (Ong and Wehrli, 2010; Álvarez et al., 2013; Shemesh et al., 2013; Drobnjak et al., 2016; Nilsson et al., 2017; Novikov et al., 2019).
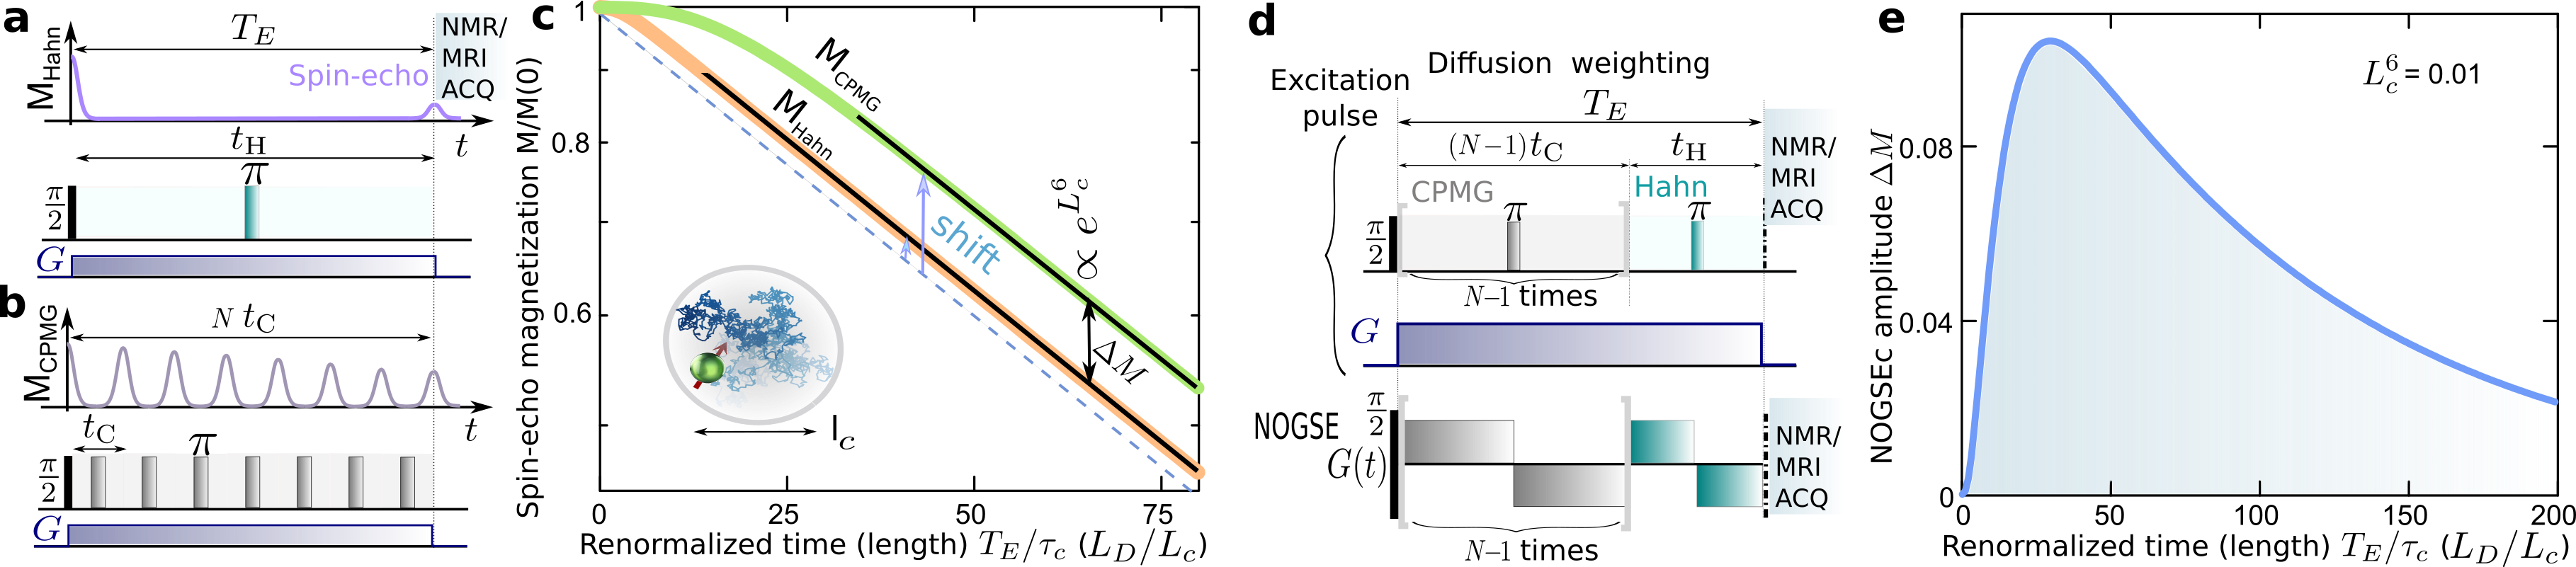
Spin-echo decay-shift as a probing-microstructure paradigm. The spin-echo magnetization decay is usually characterized by its decay-rate (Grebenkov, 2007; Callaghan, 2011). Under the control sequences discussed in Fig. 1a,b, the decay-rate is typically reduced as the number of refocusing periods increases (Carr and Purcell, 1954). This effect is shown in Fig. 1a-c, where the Hahn spin-echo decay is compared with the signal after a CPMG sequence () with multiple echoes (Carr and Purcell, 1954). However, in the restricted diffusion regime when the refocusing periods are longer than the correlation time , the spin-echo decays as (see Methods). There, the spins have been fully scrambled within the compartment, and the dephasing cannot be refocused leading to a decay-rate independent of . Yet, the spin-echo retains information of the transition from the free to the restricted diffusion regime. This information is manifested as a “decay-shift” independent of the evolution time on the spin-echo decay signal, as shown in Fig. 1c. We here demonstrate that this shift can be exploited to selectively probe microstructure sizes as it is .
As this decay-shift depends on , it can be selectively probed by concatenating a Hahn with a CPMG gradient modulation and changing the ratio between the relative refocusing periods of each component of the sequence as shown in Fig. 1d. This control sequence produces an effective modulated gradient , that conforms the Non-uniform Oscillating-Gradient Spin-Echo (NOGSE) (Álvarez et al., 2013; Shemesh et al., 2013). This sequence also factorizes out other relaxation mechanisms allowing to probe selectively the diffusion induced decay.
We define the NOGSE contrast (NOGSEc) as the amplitude given by the difference between the CPMG and the Hahn signal (Fig. 1c). It is obtained by evaluating NOGSE at the refocusing periods and then at using the definitions shown in Fig. 1d. Then both measurements are subtracted (see Methods). Within the restricted diffusion regime, this contrast amplitude is
| (3) |
which is very sensitive to the restricted diffusion length as it has a parametric dependence provided by the spin-echo decay-shift (Álvarez et al., 2013; Shemesh et al., 2013).
NOGSE as a selective microstructure-size filter. NOGSEc has a maximum as a function of the normalized echo-time as shown in Fig. 1e. We exploit this maximum contrast to enhance the relative contribution to the signal from specific restriction lengths from a size-distribution.
In order to perform a general analysis, Eq. (3) can be expressed in terms of dimensionless lengths (see Methods). Here, are the restriction length, the diffusion length that the spin can diffuse freely during and the dephasing diffusion length that provides a phase shift of , respectively (Callaghan, 2011) (Fig. 1c). Then, as a function of can be approximated by a Gaussian function when , and (see Methods),
| (4) |
NOGSEc therefore acts as a microstructure-size “bandpass-filter” with as the filter-center size (see Fig. 2a)
| (5) |
The filter-band selectivity is defined by the ratio between the full-width-at-half-maximum (FWHM) and , .
The maximum of at the size can be tuned to highlight a given restriction length based on choosing properly the sequence control parameters, i.e. the gradient strength and the evolution time (see Fig. 2a).
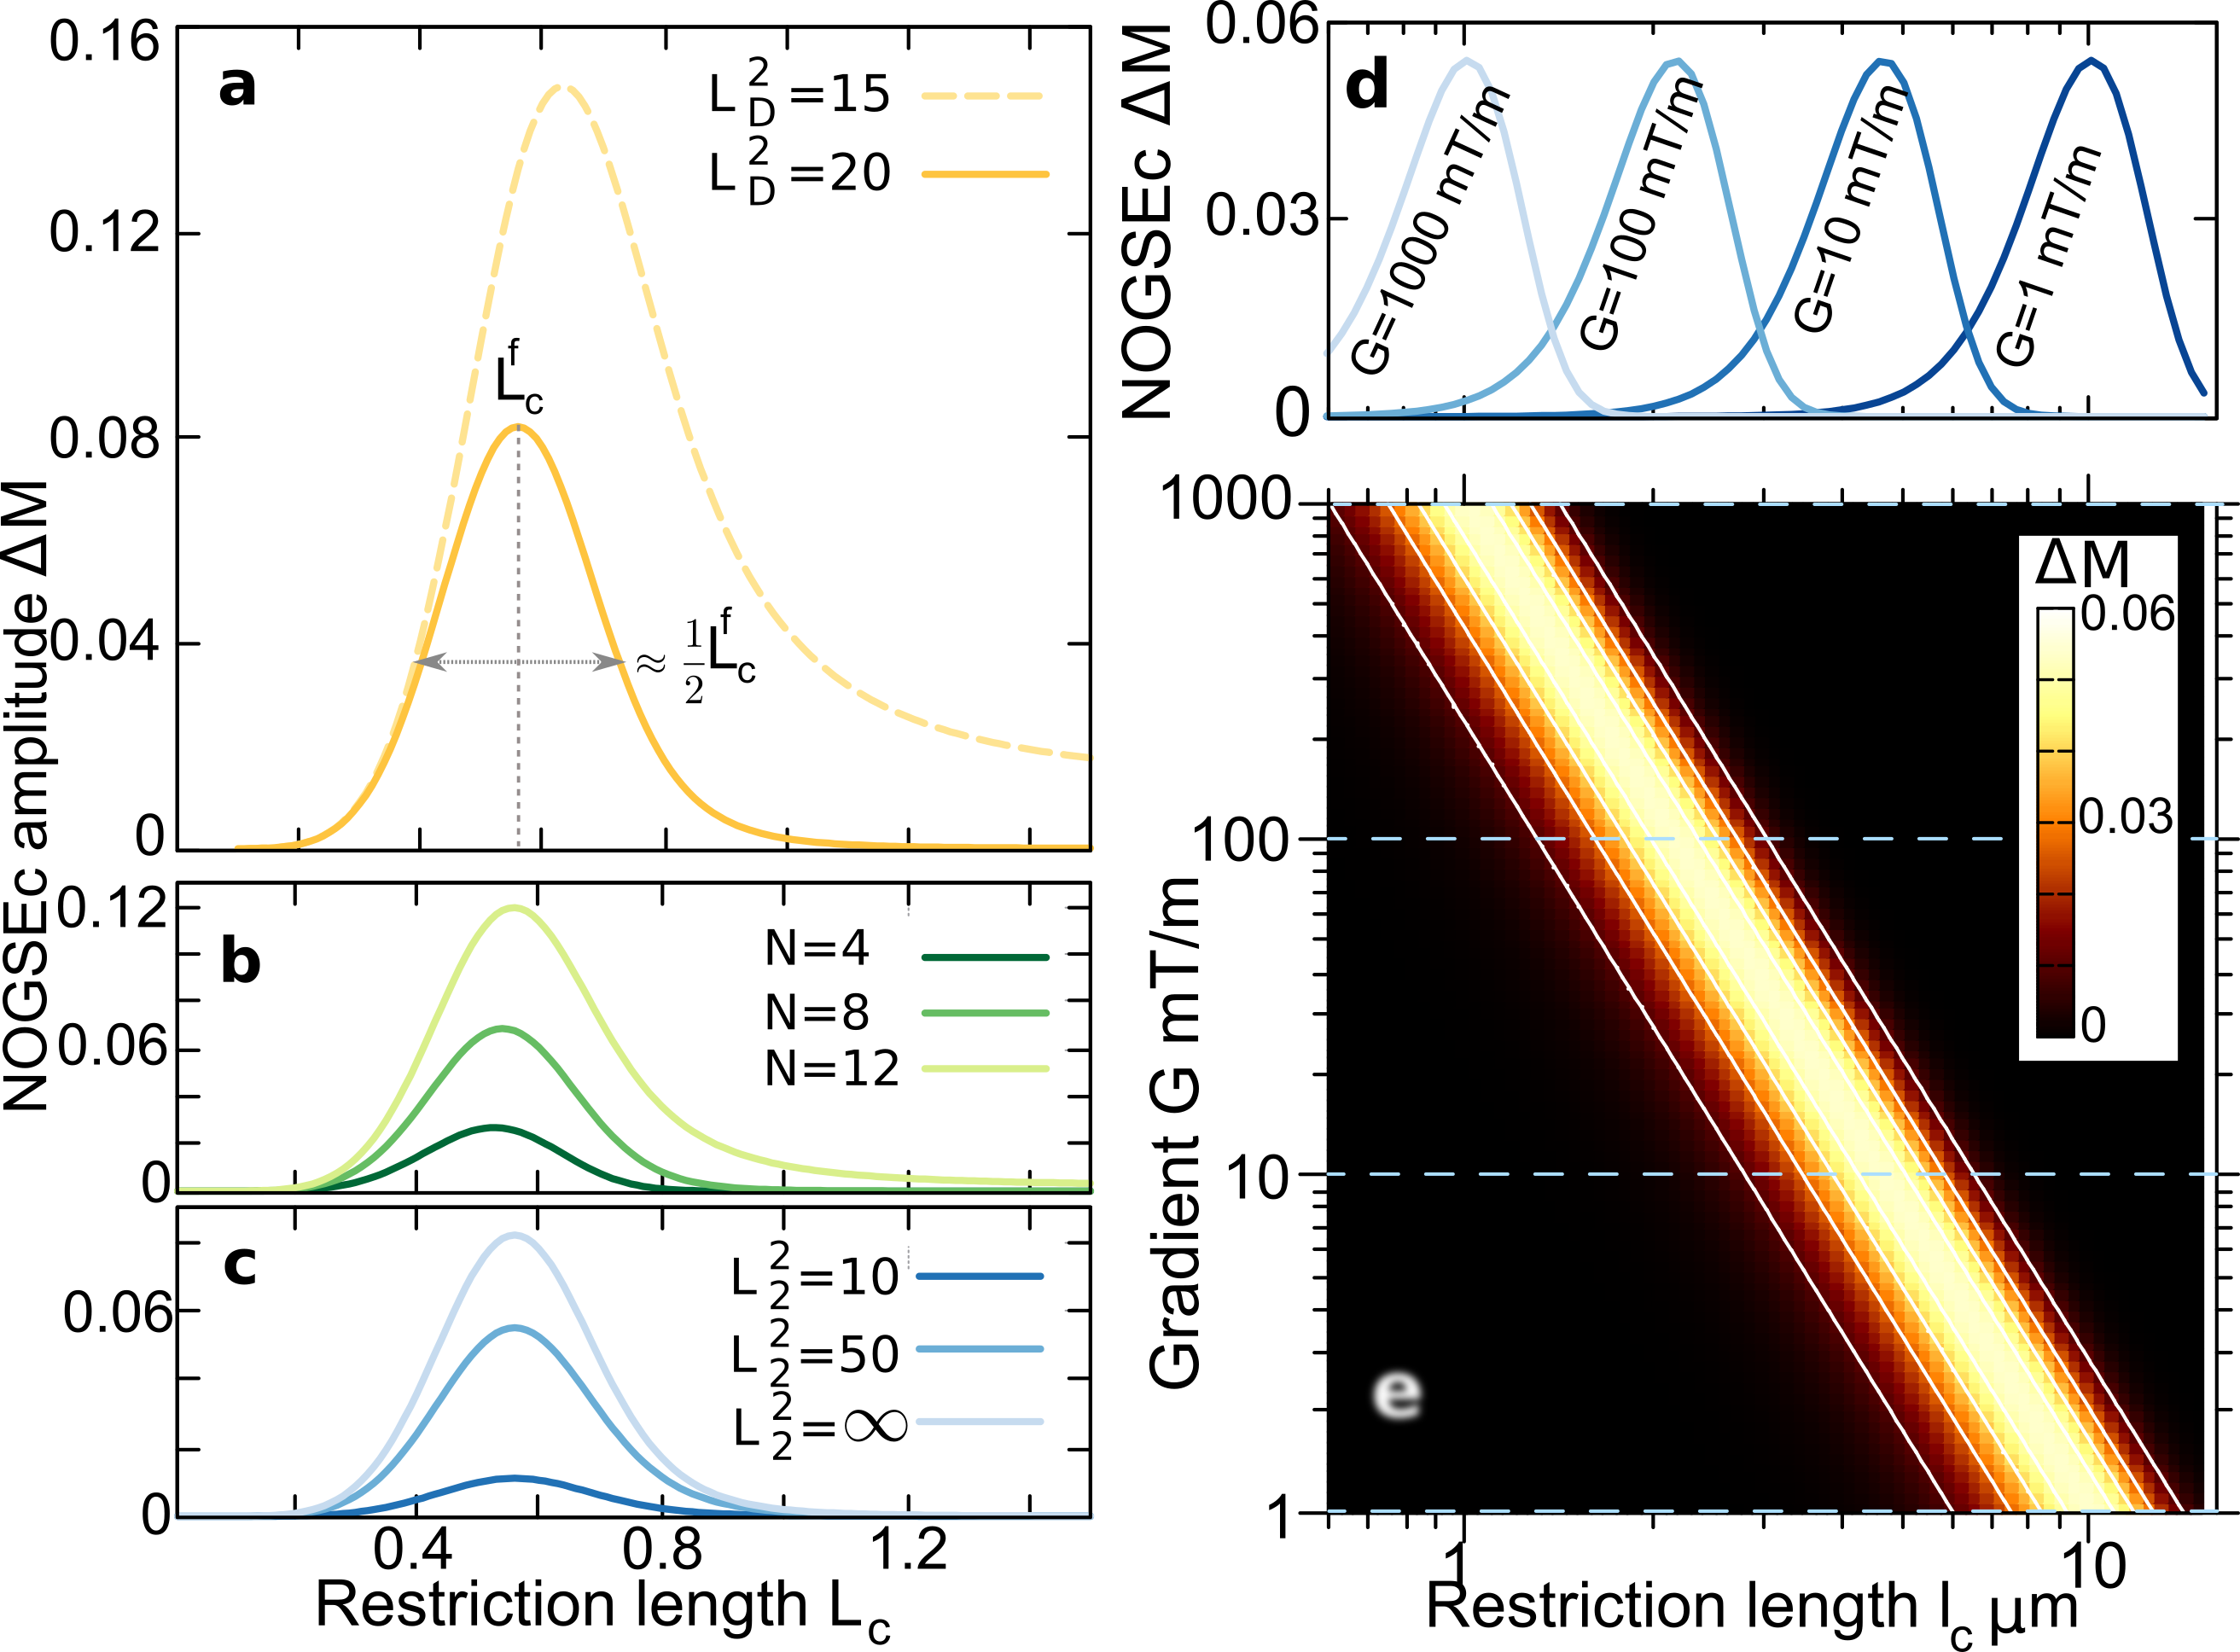
The filtered size decreases with increasing the control parameter according to Eq. (5). At the same time, increasing decreases the contrast amplitude which is . Therefore, the minimum size that can be filtered in practice is limited by the Signal-to-Noise Ratio (SNR) and the maximum achievable gradient strength as . This decrease of can be compensated linearly with increasing the number of refocusing periods , as long as to reach the restricted regime (see Eq. (4) and Fig. 2b).
A practical limitation is also the unavoidable transversal -relaxation due to the intrinsic dephasing of the nuclear spins. NOGSEc decays then as
| (6) |
where we have defined as the diffusion dimensionless length with . The -relaxation effect is showed in Fig. 2c for different values of . Remarkably, the filter shape and center remains the same as the case of .
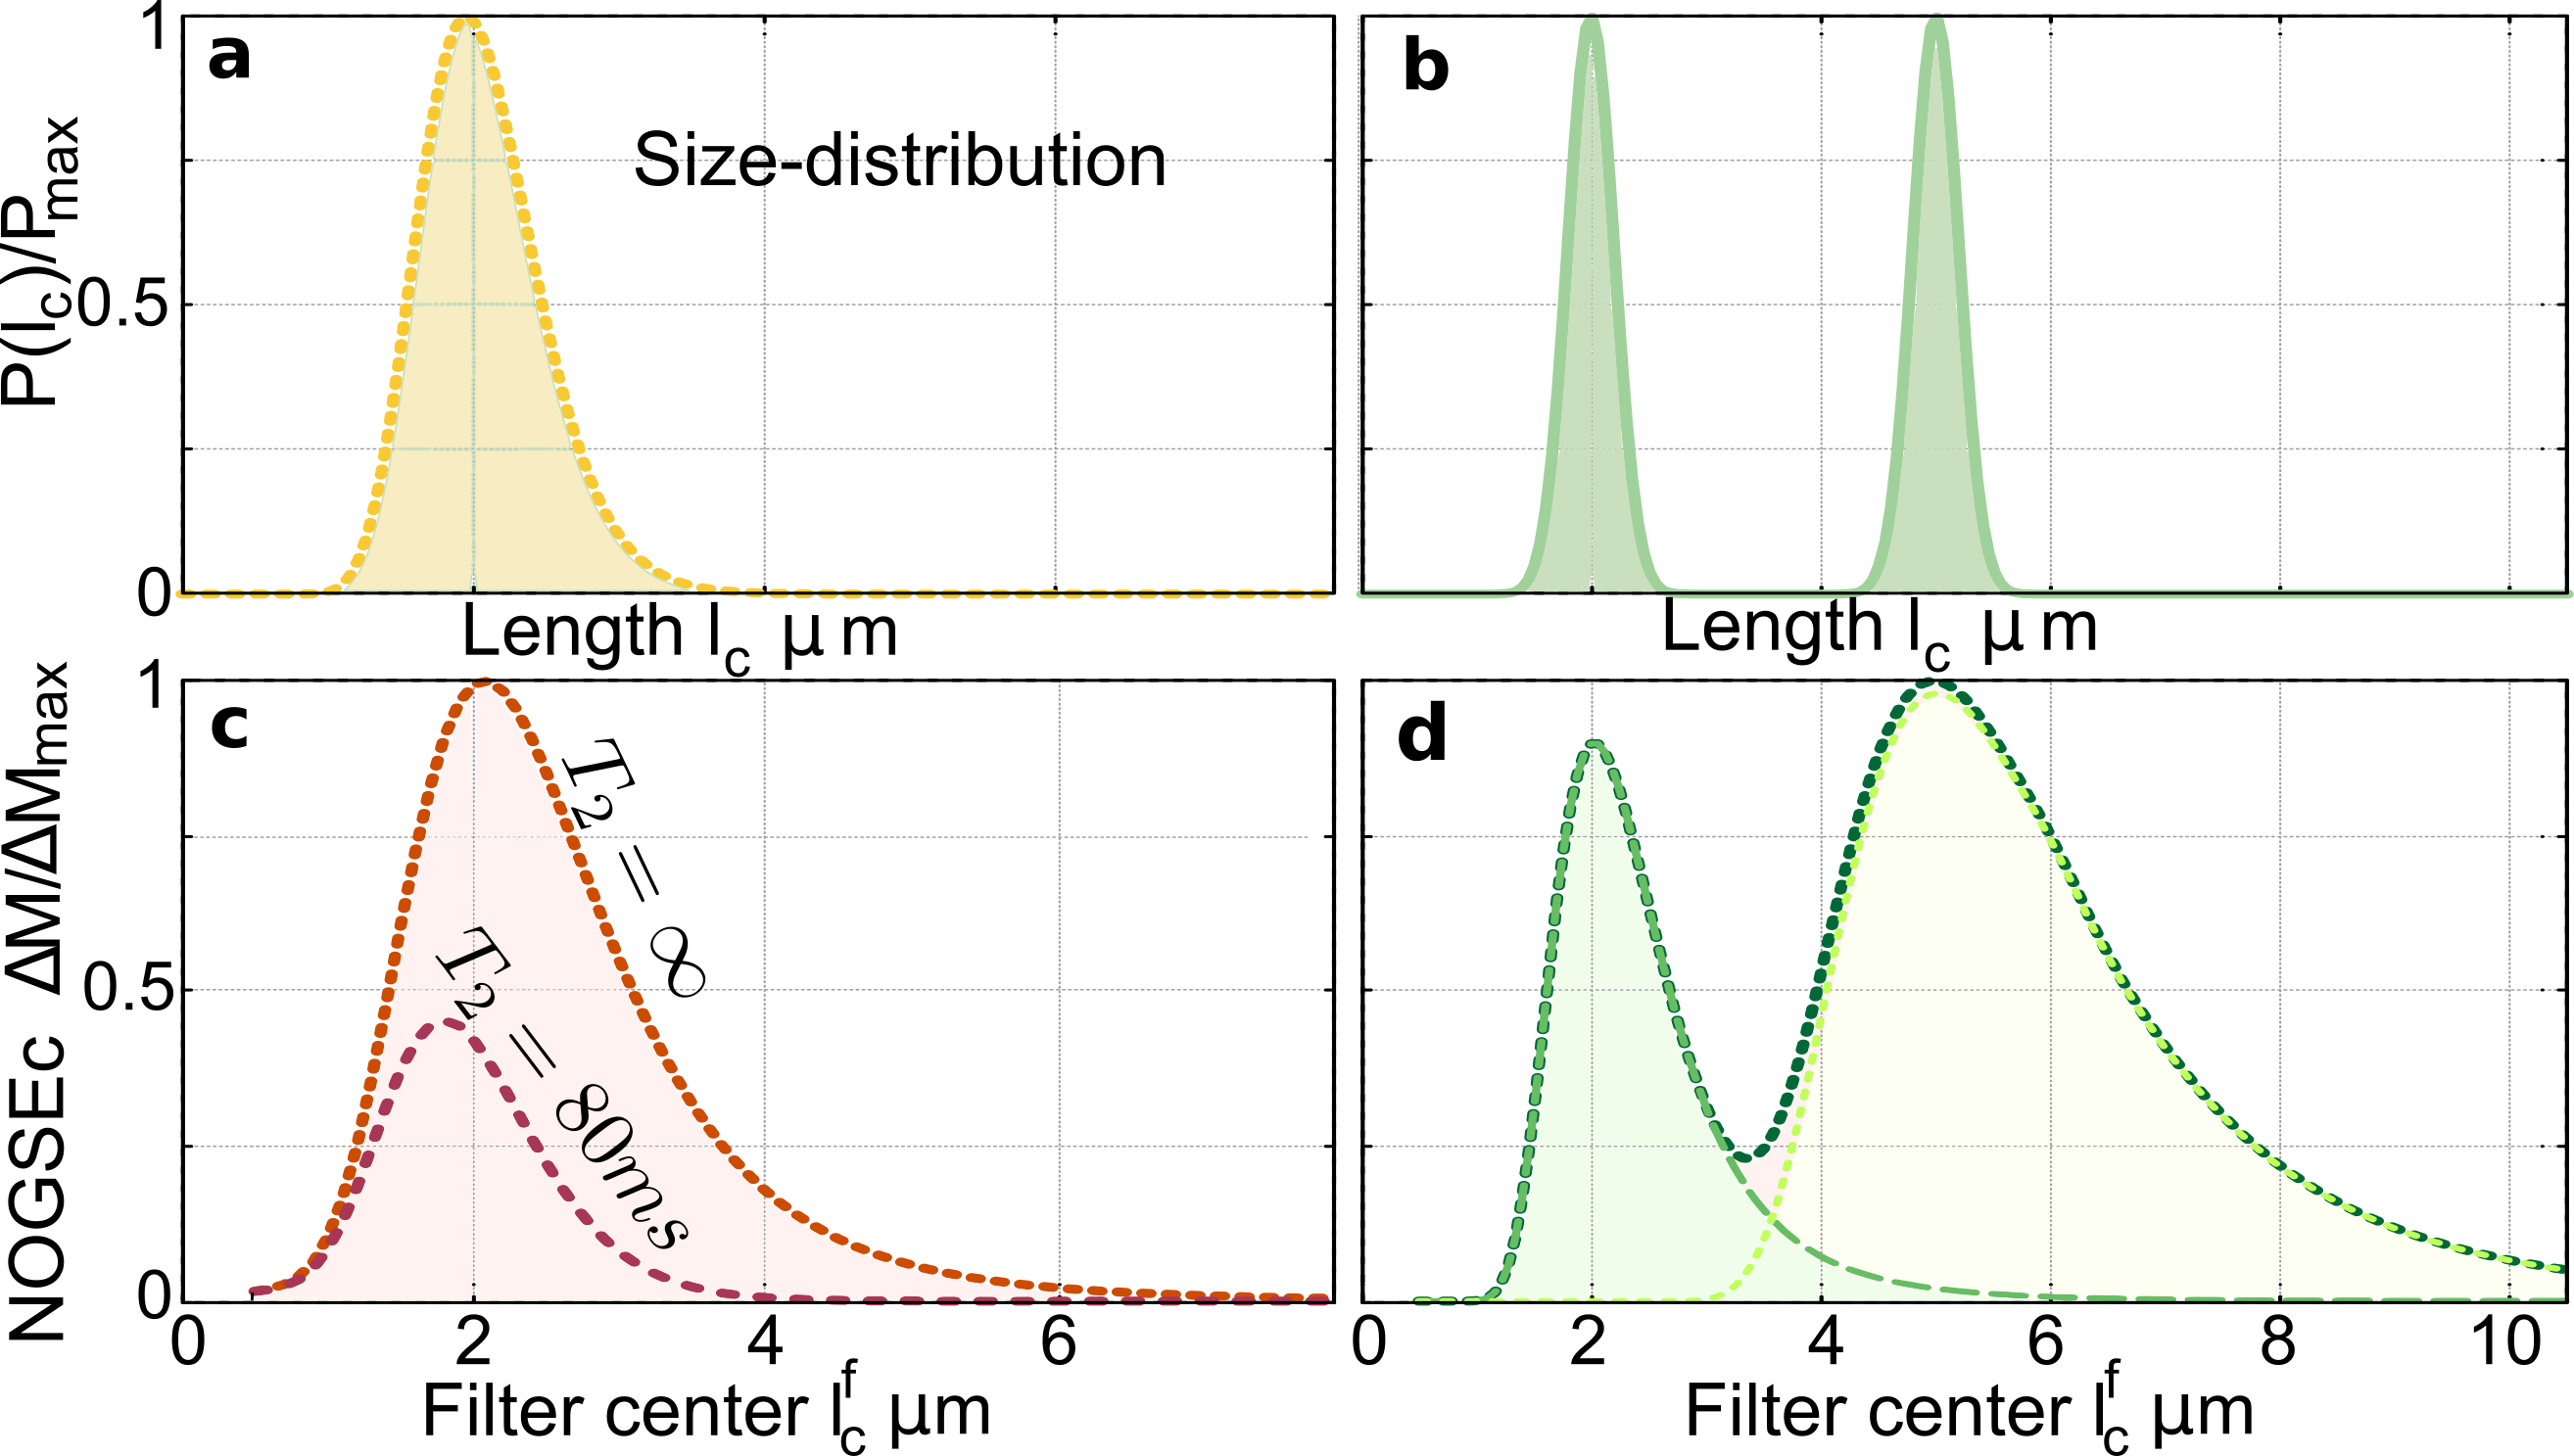
Selective size-filtering in typical microstructure-size distributions. Our results show that one can produce quantitative images based on a signal contrast generated by specific microstructure-sizes from a size-distribution. This method avoids extracting the microstructure-size by fitting a curve, which is time consuming as it typically requires several measurements (Assaf et al., 2008; Alexander et al., 2010; Ong and Wehrli, 2010; Xu et al., 2014; Shemesh et al., 2015; Novikov et al., 2019). The filter amplitude in Eq. (4) remains constant by varying the gradient strength and the evolution time keeping fixed the parameter , as shown in Fig. 2d-e. We exploit this property for a proof-of-principle evaluation of the performance of the NOGSEc filter applied to microstructural size-distribution inherent to heterogeneous biological tissues as shown in Fig. 3. Typical size-distributions are log-normal and bi-modal functions (Assaf et al., 2008; Pajevic and Basser, 2013; White et al., 2013; Liewald et al., 2014; Shemesh et al., 2015) as shown in Figs. 3a-b. NOGSEc for a size-distribution is given by
| (7) |
where is the contribution for a given restriction length . Figures 3c-d show as a function of , where and are changed simultaneously keeping constant. The center of the filter at is therefore swept while the filter amplitude is kept constant. The resulting filtered signal as a function of the filter center therefore resembles the original size-distributions, where the log-normal peak and both Gaussian peaks are clearly identified. The effects of -relaxation are shown in Fig. 3c for typical values of white-matter tissue. To further demonstrate the filter selectivity, Figure 3d shows that if one chooses equal to the center of one of the two Gaussian distributions, the other component is filtered-out. These simulations demonstrate the feasibility of performing quantitative images of a selective microstructure-size based on the NOGSEc amplitude as a “bandpass” filter.
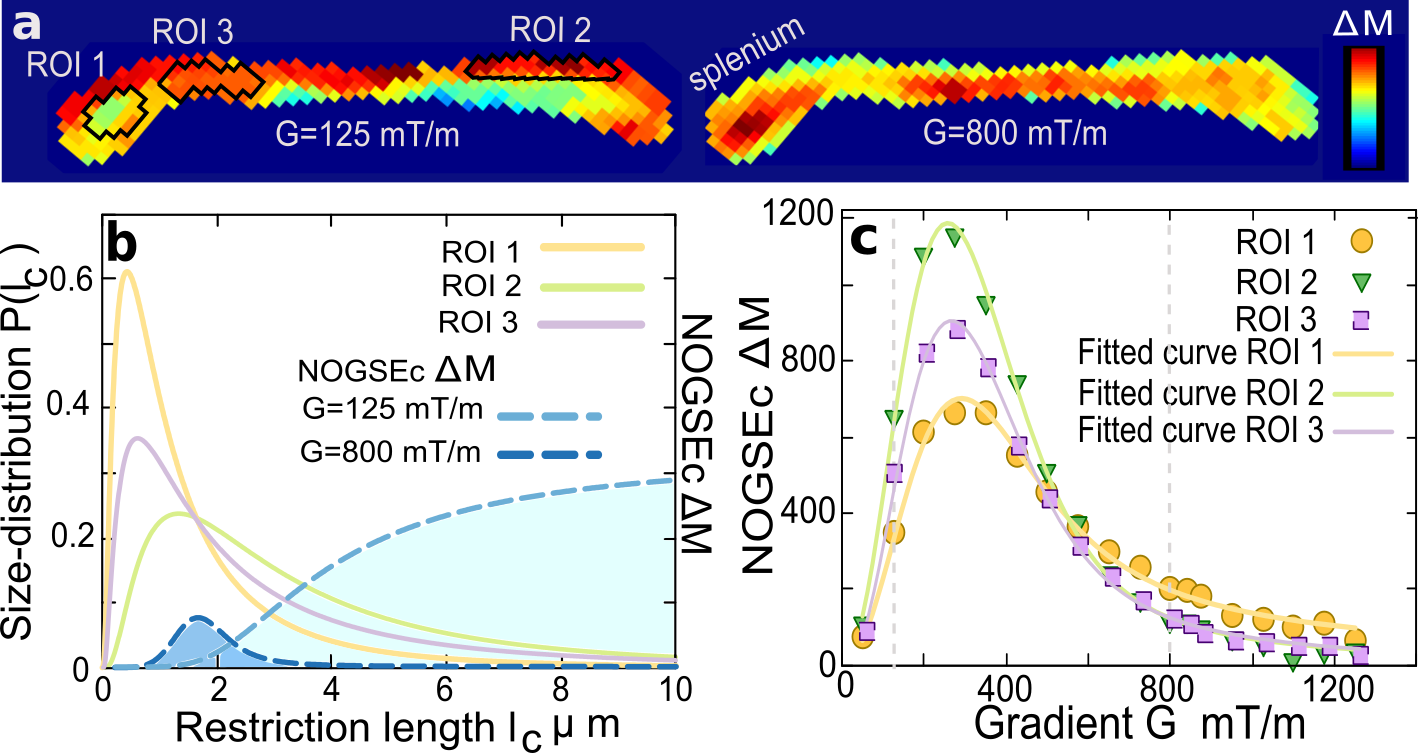
The transversal -relaxation limits the largest microstructure-size that can be filtered, as the restricted diffusion regime has to be achieved. A good SNR for is only obtained for . For short , the strategy is therefore using the lowest possible value of and reducing the number of refocusing periods so as to remain in the restricted regime. We consider this scenario in proof-of-principle experiments and perform a size-filter sweep varying only the gradient amplitude while keeping constant. We implement the microstructure-size filter method on an ex-vivo mouse brain focusing on the Corpus Callosum (CC) region (see experimental details in Methods). The CC contains aligned axons and is a paradigmatic model for log-normal size-distributions (Assaf et al., 2008; Pajevic and Basser, 2013; White et al., 2013; Liewald et al., 2014; Shemesh et al., 2015). Figure 4a shows images of for two gradient strengths. The largest gradient acts as a “bandpass” Gaussian-filter of the lower microscopic sizes of the distribution, compared to the weaker gradient that acts as a “high-pass” filter of the larger sizes (Fig. 4b). Therefore Fig. 4a clearly highlights zones of the CC with complementary colors depending of the microstructure-size. This is demonstrated quantitatively in Fig. 4b-c for three regions-of-interest (ROI). The average as a function of the gradient for the ROIs is shown in Fig. 4c together with fitted curves derived from our theoretical model following Eq. (7) (see Methods). The inferred microstructure-size distributions and the filter shapes are shown in Fig. 4b. The excellent agreement between the model and the experimental data fully demonstrates the reliability of the quantitative images shown in panel a based on the NOGSE microstructure-size filter and the assumed log-normal model.
Conclusions. The presented results introduce a method for performing non-invasive quantitative images of selective microstructure-sizes based on probing nuclear-spin dephasing induced by molecular diffusion with magnetic resonance. Conversely to standard diffusion-weighted imaging approaches that are based on observing the decay-rate of the spin signal, we exploit dynamical control with oscillating gradients to selectively probe a decay-shift on spin-echo decays. This decay-shift contains quantitative information of microstructure-sizes that restrict the molecular diffusion. We generate a contrast amplitude that behaves as a microstructure-size filter to selectively probe a restriction length determined by the control parameters. We show the usefulness and performance of the method with proof-of-principle simulations and experiments on typical size-distributions of white-matter tracts in a mouse brain. A quantitative image of specific diffusion restriction lengths is performed extracted from only two images, allowing to significantly reduce the tens of images that typically demand the inference of microstructure-sizes from data fittings (Assaf et al., 2008; Alexander et al., 2010; Ong and Wehrli, 2010; Xu et al., 2014; Shemesh et al., 2015; Novikov et al., 2019). Even though intrinsic -relaxation may represent a limitation, we show excellent performance probing quantitative information of microstructure details between on biological tissue as in the mouse white matter, being able to filter sizes much lower than the present image resolution. This work lays the foundations of a novel conceptual tool with low overhead for designing quantitative methods for non-invasive imaging of tissue microstructure. This diagnostic tool opens up a new avenue to explore for in-vivo imaging. In addition, these results can also be applied for characterizing material microstructures, such as rocks which are of particular interest for oil extraction, and for nanoscale-imaging of biological tissues with novel quantum sensors based on noise spectroscopy (Staudacher et al., 2015; Barry et al., 2016; Wang et al., 2019).
Acknowledgements.
Acknowledgments. We acknowledge Soledad Esposito and Micaela Kortsarz for preparing the ex-vivo mouse brain, and Federico Turco for scripting assistance to process the experimental data. We thank Lucio Frydman and Jorge Jovicich for fruitful discussions. This work was supported by CNEA, ANPCyT-FONCyT PICT-2017-3447, PICT-2017-3699, PICT-2018-04333, PIP-CONICET (11220170100486CO), UNCUYO SIIP Tipo I 2019-C028, Instituto Balseiro. A.Z. and G.A.A. are members of the Research Career of CONICET. M.C. and P.J. acknowledge support from the Instituto Balseiro’s fellowships.References
- Staudacher et al. (2015) T. Staudacher, N. Raatz, S. Pezzagna, J. Meijer, F. Reinhard, C. A. Meriles, and J. Wrachtrup, Nat. Commun. 6, 8527 (2015).
- Wang et al. (2019) P. Wang, S. Chen, M. Guo, S. Peng, M. Wang, M. Chen, W. Ma, R. Zhang, J. Su, X. Rong, F. Shi, T. Xu, and J. Du, Sci. Adv. 5, eaau8038 (2019), https://advances.sciencemag.org/content/5/4/eaau8038.full.pdf .
- Barry et al. (2016) J. F. Barry, M. J. Turner, J. M. Schloss, D. R. Glenn, Y. Song, M. D. Lukin, H. Park, and R. L. Walsworth, Proc. Natl. Acad. Sci. U.S.A. 113, 14133 (2016), https://www.pnas.org/content/113/49/14133.full.pdf .
- Glenn et al. (2015) D. R. Glenn, K. Lee, H. Park, R. Weissleder, A. Yacoby, M. D. Lukin, H. Lee, R. L. Walsworth, and C. B. Connolly, Nat. Methods 12, 736 (2015).
- Padhani et al. (2009) A. R. Padhani, G. Liu, D. M. Koh, T. L. Chenevert, H. C. Thoeny, T. Takahara, A. Dzik-Jurasz, B. D. Ross, M. Van Cauteren, D. Collins, D. A. Hammoud, G. J. S. Rustin, B. Taouli, and P. L. Choyke, Neoplasia 11, 102 (2009).
- Drago et al. (2011) V. Drago, C. Babiloni, D. Bartrés-Faz, A. Caroli, B. Bosch, T. Hensch, M. Didic, H.-W. Klafki, M. Pievani, J. Jovicich, L. Venturi, P. Spitzer, F. Vecchio, P. Schoenknecht, J. Wiltfang, A. Redolfi, G. Forloni, O. Blin, E. Irving, C. Davis, H.-g. Hårdemark, and G. B. Frisoni, J. Alzheimers Dis. 26, 159 (2011).
- White et al. (2013) N. S. White, T. B. Leergaard, H. D’Arceuil, J. G. Bjaalie, and A. M. Dale, Hum. Brain Mapp. 34, 327 (2013).
- White et al. (2014) N. S. White, C. R. McDonald, N. Farid, J. Kuperman, D. Karow, N. M. Schenker-Ahmed, H. Bartsch, R. Rakow-Penner, D. Holland, A. Shabaik, A. Bjørnerud, T. Hope, J. Hattangadi-Gluth, M. Liss, J. K. Parsons, C. C. Chen, S. Raman, D. Margolis, R. E. Reiter, L. Marks, S. Kesari, A. J. Mundt, C. J. Kaine, B. S. Carter, W. G. Bradley, and A. M. Dale, Cancer Res. 74, 4638 (2014).
- Enzinger et al. (2015) C. Enzinger, F. Barkhof, O. Ciccarelli, M. Filippi, L. Kappos, M. A. Rocca, S. Ropele, À. Rovira, T. Schneider, N. de Stefano, H. Vrenken, C. Wheeler-Kingshott, J. Wuerfel, F. Fazekas, and o. and, Nat. Rev. Neurol. 11, 676 (2015).
- Le Bihan (2003) D. Le Bihan, Nat. Rev. Neurosci. 4, 469 (2003).
- Xu et al. (2014) J. Xu, H. Li, K. D. Harkins, X. Jiang, J. Xie, H. Kang, M. D. Does, and J. C. Gore, Neuroimage 103, 10 (2014).
- Grussu et al. (2017) F. Grussu, T. Schneider, C. Tur, R. L. Yates, M. Tachrount, A. Ianuş, M. C. Yiannakas, J. Newcombe, H. Zhang, D. C. Alexander, G. C. DeLuca, and C. A. M. Gandini Wheeler-Kingshott, Ann. Clin. Transl. Neurol. 4, 663 (2017).
- Alexander et al. (2019) D. C. Alexander, T. B. Dyrby, M. Nilsson, and H. Zhang, NMR Biomed. 32, e3841 (2019), _eprint: https://onlinelibrary.wiley.com/doi/pdf/10.1002/nbm.3841.
- Grebenkov (2007) D. S. Grebenkov, Rev. Mod. Phys. 79, 1077 (2007).
- Callaghan (2011) P. T. Callaghan, Translational Dynamics and Magnetic Resonance:Principles of Pulsed Gradient Spin Echo NMR (Oxford University Press, Oxford, 2011).
- Stepisnik (1993) J. Stepisnik, Physica B 183, 343 (1993).
- Álvarez et al. (2013) G. A. Álvarez, N. Shemesh, and L. Frydman, Phys. Rev. Lett. 111, 080404 (2013).
- Shemesh et al. (2013) N. Shemesh, G. A. Álvarez, and L. Frydman, J. Magn. Reson. 237, 49 (2013).
- Hahn (1950) E. Hahn, Phys. Rev. 80, 580 (1950).
- Carr and Purcell (1954) H. Y. Carr and E. M. Purcell, Phys. Rev. 94, 630 (1954).
- Drobnjak et al. (2016) I. Drobnjak, H. Zhang, A. Ianus, E. Kaden, and D. C. Alexander, Magn. Reson. Med. 75, 688 (2016), https://onlinelibrary.wiley.com/doi/pdf/10.1002/mrm.25631 .
- Nilsson et al. (2017) M. Nilsson, S. Lasic, I. Drobnjak, D. Topgaard, and C.-F. Westin, NMR Biomed. 30, e3711 (2017), e3711 nbm.3711, https://onlinelibrary.wiley.com/doi/pdf/10.1002/nbm.3711 .
- Novikov et al. (2019) D. S. Novikov, E. Fieremans, S. N. Jespersen, and V. G. Kiselev, NMR Biomed. 32, e3998 (2019).
- Assaf et al. (2008) Y. Assaf, T. Blumenfeld-Katzir, Y. Yovel, and P. J. Basser, Magn. Reson. Med. 59, 1347 (2008), https://onlinelibrary.wiley.com/doi/pdf/10.1002/mrm.21577 .
- Alexander et al. (2010) D. C. Alexander, P. L. Hubbard, M. G. Hall, E. A. Moore, M. Ptito, G. J. Parker, and T. B. Dyrby, Neuroimage 52, 1374 (2010).
- Shemesh et al. (2015) N. Shemesh, G. A. Álvarez, and L. Frydman, PLoS One 10, e0133201 (2015).
- Ong and Wehrli (2010) H. H. Ong and F. W. Wehrli, Neuroimage 51, 1360 (2010).
- Stepisnik (1999) J. Stepisnik, Physica B 270, 110 (1999).
- Pajevic and Basser (2013) S. Pajevic and P. J. Basser, PLoS One 8, e54095 (2013).
- Liewald et al. (2014) D. Liewald, R. Miller, N. Logothetis, H.-J. Wagner, and A. Schüz, Biol. Cybern. 108, 541 (2014).
Methods
Magnetization decay of an spin ensemble under dynamical control. The magnetization signal observed from an ensemble of non-interacting and equivalent spins, under the effect of dynamical control, is . Here, the brackets denote the ensemble average over the random phases acquired by the spins during the evolution time . For the considered dynamical control with modulated gradient spin-echo sequences, the average phase becomes null, . Then, as typically follows a Gaussian distribution (Stepisnik, 1999), the signal will depend on the random phase variance .
The variance expressed in terms of the control applied to the system by and the molecular displacement autocorrelation function (Stepisnik, 1993; Álvarez et al., 2013; Shemesh et al., 2013) is given in Eq. (2) of the main text.
For a piecewise constant modulation , that switches times its sign at times with during the evolution time . The quadratic phase of the magnetization decay is
| (8) | ||||
Magnetization decay within the restricted diffusion regime. In the restricted diffusion regime all terms as for all , therefore the non-null terms in Eq. (8) are those with . The phase variance is then
| (9) | ||||
| (10) | ||||
| (11) |
Then, the decay-rate is , and the decay-shift is the time-independent term , which can also be derived from
| (12) |
NOGSE contrast amplitude. One can obtain an analytical expression for the magnetization decay in Eq. (8) for the Hahn, CPMG and NOGSE spin-echo sequences described in Fig. (1) of the main text. In the restricted diffusion regime , they result
| (13) |
with .
We define the NOGSE contrast (NOGSEc) amplitude to the difference between and ), i.e.
| (14) |
Then, we arrive to Eq. (3) of the main text by introducing Eq. (13) into Eq. (14)
| (15) |
NOGSEc results
| (16) |
within the restricted diffusion regime, using the dimensionless variables defined in the main text.
The general expression for that includes all diffusion time scales can be obtained from Eq. (8) by replacing the time intervals as defined in Fig. 1c of the main text.
Gaussian microstructure-size filter derivation. The NOGSEc amplitude in the restricted diffusion regime, Eq. (16), can be approximated by
| (17) |
for . The maximum of occurs at . In the asymptotic limit of , it is achieved for
| (18) |
where is the center of the filter as described in Eq. (5) of the main text.
The NOGSEc amplitude can be approximated by
with a Taylor expansion in at of the expression given in Eq. (17). We use this expansion to define the first moments of the Gaussian filter function of Eq. (4) in the main text, obtaining
| (20) |
This expression is then verified to approximate very well the exact expression derived from Eq. (8) within the regime of and .
Ex-vivo mouse brain preparation. The experiments were approved by the Institutional Animal Care and Use Committee of the Comisión Nacional de Energía Atómica under protocol number 08_2018. One mouse was sacrificed by isoflurane overdose and its brain was fixed in formaline. The brain was washed twice with PBS prior to the insertion into a 15 ml falcon tube filled with PBS. The brain was left in the magnet for at least three hours prior to the reported experiments to reach thermal equilibration.
MRI experiments. The experiments were performed on a 9.4T Bruker Avance III HD WB NMR spectrometer with a 1H resonance frequency of MHz. We use a Micro 2.5 probe capable of producing gradients up to 1500 mT/m in three spatial directions. The experiments temperature was stabilized at 21°C. We programmed and implemented with Paravision 6 the NOGSE MRI sequence shown in Fig. 5. The sequence parameters were: Repetition time ms, , FOV = 15x15 mm2 with a matrix size of 192x192, leading to an in-plane resolution of , and slice thickness of 1 mm with 128 signal averages. The two images were acquired with echo planar imaging (EPI) encoding with 4 segments (image acquisition time min) and then subtracted to generate . The NOGSE modulation time was with . The NOGSE gradients were applied perpendicular to the main axis of the axons in the corpus callosum. NOGSEc is determined from an image generated with for the CPMG modulation and with and for the Hahn modulation. The set of parameter values were chosen for achieving good SNR for performing the proof-of-principle experiments. Further studies should be considered to explore the optimal values for acquiring the images in the shortest possible time.
Experimental data analysis. The mean signal from the pixels in the ROIs of Fig. 4a of the main text was analyzed, and plotted as a function of in Fig. 4c. Fittings to the theoretical model were done assuming a uniform and a log-normal distribution with median and geometric standard deviation . This implies that no extra assumptions were considered for the tissue model (e.g., intra/extra-cellular compartments). Therefore a single log-normal distribution was thus fitted to the experimental data, regardless of the potential heterogeneity. This means that all underlying compartments (e.g., extracellular, intracellular, etc.) reflected in the diffusion weighted are assumed to be described by a single log-normal distribution. We considered a distribution of restriction lengths without assuming particular geometries. Remarkably the excellent agreement of the fitted curves to the experimental data in Fig. 4c is consistent with these simple assumptions.