Non-Hermitian topological phases and exceptional lines in topolectrical circuits
Abstract
We propose a scheme to realize various non-Hermitian topological phases in a topolectrical (TE) circuit network consisting of resistors, inductors, and capacitors. These phases are characterized by topologically protected exceptional points and lines. The positive and negative resistive couplings in the circuit provide loss and gain factors which break the Hermiticity of the circuit Laplacian. By controlling , the exceptional lines of the circuit can be modulated, e.g., from open curves to closed ellipses in the Brillouin zone. In practice, the topology of the exceptional lines can be detected by the impedance spectra of the circuit. We also considered finite TE systems with open boundary conditions, the admittance spectrum of which exhibits highly tunable zero-admittance states demarcated by boundary points (BPs). The phase diagram of the system shows topological phases which are characterized by the number of their BPs. The transition between different phases can be controlled by varying the circuit parameters and tracked via impedance readout between the terminal nodes. Our TE model offers an accessible and tunable means of realizing different topological phases in a non-Hermitian framework, and characterizing them based on their boundary point and exceptional line configurations.
.1 Introduction
There is growing interest in studying topological states in various platforms such as topological insulatorsFu and Kane (2007); Moore and Balents (2007), cold atomsLiu et al. (2013); Zhang et al. (2018), photonics systems Lu et al. (2014); Khanikaev et al. (2013), superconductorsSato and Ando (2017), and optical latticesGoldman et al. (2016); Lang et al. (2012) due to their extraordinary properties such as topologically protected edge states and unconventional transport characteristics Rafi-Ul-Islam et al. (2020a, b). Such topological states have been studied in Hermitian and lossless systemsRoy (2009), where the eigenenergies are always real. However, Hermitian systems do not exhibit many interesting phenomena such as exceptional pointsAlvarez et al. (2018a), the skin effectYao and Wang (2018); Lee and Thomale (2019); Rafi-Ul-Islam et al. (2021), biorthogonal bulk polarization Kunst et al. (2018), and wave amplification and attenuation El-Ganainy et al. (2018); Jin and Song (2019). In the pursuit of more exotic characteristics in topological phases, researchers have shifted attention from Hermitian to non-Hermitian systemsLiu et al. (2019). In contrast to Hermitian systems, non-Hermitian systems in general exhibit complex eigenvalues unless the system obeys some specific symmetries such as the symmetry where and are the parity and time reversal operations, respectively. One iconic feature of non-Hermitian systems is the existence of exceptional points, where two or more eigenvectors coalesce and the Hamiltonian becomes nondiagonalizable. This feature leads to many novel transport phenomena, such as unidirectional transparencyLin et al. (2011); Feng et al. (2013), unconventional reflectivity Zhu et al. (2018a), and super sensitivityLiu et al. (2016). Generally, the exchange of energy or particles between lattice points and the surrounding environment induces non-Hermiticity in the system. One way to induce non-Hermiticity is to add imaginary onsite potentials at different sublattices that represent gain or loss in the system depending on the sign of the potentials. In addition, asymmetric sublattice couplings may also induce non-Hermiticity in the system Hamiltonian Rafi-Ul-Islam et al. (2021). However, realizing non-Hermitian systems in condensed matterAlvarez et al. (2018b), acoustic metamaterialsAchilleos et al. (2017), and optical structuresZhang et al. (2016); Jin (2017) is in practice difficult because of the limited control over sublattice couplings, instability of the complex eigenspectraYuce and Oztas (2018a), and limitations in experimental accessibility. In pursuit of alternative platforms to overcome the aforementioned experimental limitations, topolectrical (TE) circuits Rafi-Ul-Islam et al. (2020c); Lee et al. (2018); Imhof et al. (2018); Helbig et al. (2019); Rafi-Ul-Islam et al. (2020d) have emerged as an ideal platform to not only realize non-Hermitian systems, but also to investigate many emerging phenomena such as Chern insulatorsHaenel et al. (2019), the quantum spin Hall effectZhu et al. (2019); Sun et al. (2020); Zhu et al. (2018b); Sun et al. (2019), higher-order topological insulatorsEzawa (2018); Peterson et al. (2018), topological corner modesImhof et al. (2018); Serra-Garcia et al. (2019), Klein tunneling Rafi-Ul-Islam et al. (2020a, d) and perfect reflection Rafi-Ul-Islam et al. (2020a, b). Appropriately designed TE circuits can emulate the topological properties of materials and offer unparalleled degrees of tunability and experimental flexibility through the conceptual shift from conventional materials system to artificial electrical networks. The freedom in design and control over lattice couplings allow us to investigate electronic structures beyond the limitations of condensed matter systems. Moreover, TE circuit networks are not constrained by the physical dimension or distance between two lattice (nodal) points but are described solely by the mutual connectivity of the circuit nodes. Besides, the freedom of choice in the connections at each node and long-range hopping make TE systems easier to fabricate compared to real material systems. Therefore, it is also possible to design an equivalent circuit network in lower dimensions that resembles the characteristics of higher-dimensional circuits Rafi-Ul-Islam et al. (2020d). Unlike real material systems, an infinite real system can be mimicked by finite-sized circuit networks in TE circuits. Therefore, TE networks enable us to design a non-Hemitian system in a circuit network with better measurement accessibility as all the characteristic variables such as the admittance bandstructure and the density of states can be evaluated through electrical measurementsHofmann et al. (2019)(e.g. impedance, voltage, and current readings). In this paper, we investigate the exceptional lines, i.e. loci of exceptional points (EP), in a non-Hermitian TE system consisting of electrical components such as resistors, inductors and capacitors as a function of the non-Hermitian parameter (i.e. resistance). We show that by introducing non-Hermiticity to the circuit Laplacian through the insertion of positive or negative resistances between the voltage nodes and the ground to induce imaginary onsite potentials in the lattice sites and tuning the non-Hermitian parameters appropriately through using by using appropriate resistance values, the loci of the EPs may be easily switched to take the form of either a line or closed curves such as ellipses in the Brillouin zone. We show that a unique property of the TE platform over earlier works Rui et al. (2019); Choi et al. (2019); Stegmaier et al. (2020), viz. the impedance spectrum, is that the exceptional lines can be detected and easily tracked by measuring the impedance spectrum of the circuit. We further investigate finite systems with open boundary conditions along one direction, and find that these finite systems possess a rich phase diagram with different phases possessing up to four pairs of BPs, depending on the circuit parameters. We also show that edge states in Hermitian or pure circuits, become hybridized with the bulk modes in non-Hermitian RLC circuits. In summary, our TE model provides an experimentally accessible means to investigate the phase diagram and various topological phases of non-Hermitian systems.
.2 Theoretical Model
We consider a two-dimensional TE circuit, shown in Fig. 1, which is composed of capacitors, inductors, positive resistors (loss elements) and negative resistors (gain elements). The circuit has a unit cell consisting of two sublattice nodes and . Each node is connected by a capacitor of and to its nearest neighbour in the and -direction, respectively, and a parallel combination of a common capacitor and inductor to the ground. The inductance can be varied to modulate the resonance condition. To explore the effects of loss and gain in the TE network, we consider an imaginary onsite potential on the nodes and on the nodes. This onsite potential can be realized by connecting resistors of resistance ( ) between each () node and the ground. The onsite potential are related to the resistors by , where denotes the frequency of the driving alternating current. The negative imaginary onsite potential at the -type nodes can be obtained by using op-amp-based negative resistance converters with current inversion (INRC) (see Supplemental section 1 for details) Alternatively, similar gain and loss terms can obtained in our TE model via using only two unequal positive resistances connected to ground for each type of nodes instead of using negative resistance converters, which yields the mathematically similar Hamiltonain as Eq. 1 except for a global shift of the imaginary part of all the admittance eigenenergies (see Supplementary Note 1 for details). The advantage of using grounding resistors with different values of (positive) resistance is the dynamic stability of the circuit because the absence of op-amps avoids the possibility that the voltage profiles may get over-amplified by the negative resistance.

The Laplacian of the TE circuit over the - plane can be expressed as
| (1) |
where the s denote the Pauli matrices in the sublattice space. In the absence of resistances, Eq. 1 exhibits both the chiral symmetry, i.e., and inversion symmetry, i.e., , where the chirality and inversion operators are and , respectively. However, a finite would break the inversion symmetry of the Laplacian in Eq. 1 although the parity time () symmetry as defined by , would still be preserved (here, is the parity operator and is complex conjugation). Therefore, the Laplacian in Eq. 1 can still have real eigenvalues despite its non-Hermiticity Lee (2016). More specifically, a non-zero in Eq. 1 corresponds to the insertion of alternating and terms on the diagonal of the Laplacian, which preserves the commutation with the operator Weimann et al. (2017). In contrast to the Hermitian case, symmetry in the non-Hermitian TE system eigenmodes can be broken depending on the model parameters, i.e., the eigenmodes of Eq. 1 are not necessarily the eigenstates of the operator Yuce and Oztas (2018b) even when the Laplacian itself respects symmetry. In this situation, complex admittance spectra emerge with exceptional points where both the hole- and particle-like admittance bands coalesce. Therefore, the complex admittance dispersion for the circuit model take the form of
| (2) |
where the refers to the two admittance bands, respectively. By tuning the circuit parameters, we can obtain different numbers of real solutions for for in Eq. (2), which translates into different number of exceptional points in the Brillouin zone (BZ). The exceptional points occur at and .

To illustrate the effect of non-Hermitian gain or loss, we plot the admittance spectrum as a function of wavevector and fix for three representative values of . In the absence of gain or loss (i.e., ), the admittance spectrum becomes purely real with two Dirac points or exceptional points (see Fig. 2a). Because the Laplacian in Eq. 1 obeys chiral symmetry, for a given , the admittance eigenvalues always come in pairs with equal magnitude but opposite signs. For non-zero values of , the admittance dispersion becomes complex and the band-touching degeneracy points split into pairs of band-touching exceptional points. For instance, in Fig. 2b, the splitting of the degeneracy points is most evident in the admittance plots in the left-most and middle columns. Here, the degeneracy point with zero admittance at in Fig. 2a splits into two exceptional points (EPs) at and in Fig. 2b. The admittance spectrum is then either real (for some range of ) with -symmetrical eigenmodes or purely imaginary (in the complementary range of ), in which case the eigenmodes break the symmetry. The boundaries between the real and imaginary admittances are defined by the EPs, where all the eigenmodes coalesce at the eigenvalue of zero. Two of the four EPs are located at while the other two are at . As the magnitude of increases, the range of corresponding to the real (imaginary) part of the admittance spectrum shrinks (expands). At some critical value given by , the whole spectrum becomes purely imaginary with a thre EPs (see Fig. 2c). When exceeds , the two admittance bands will become gapped and no EP exists in the Brillouin zone (not shown in Fig. 2). In this case, the admittance eigenmodes break the symmetry for the entire range of in the BZ. As can be seen from Fig. 2c, the real part of the admittance spectrum vanishes at the critical resistance . In summary, we can obtain a variable number of EPs depending on the parameter, i.e., two, four, three, and zero EPs for , , , and , respectively.
To obtain the exceptional lines (the loci of the exceptional points), we use the equation for the degeneracy points of the admittance spectrum:
| (3) |
Eq. 3 governs the loci of the exceptional points in the - plane. A finite will transform a single pair of band-touching points into exceptional or nodal lines on the plane characterized by Eq. 3. On these exceptional lines, both the real and imaginary parts of the eigenvalues vanish. The top panels of Fig. 3a and b show the exceptional lines for the parameter sets in Fig. 2b and c , respectively. The exceptional points shown in Fig. 2b and c then correspond to the cross sections of the exceptional lines in Fig. 3 at .

In addition to the above analysis of the exceptional lines based on the admittance spectrum, an alternative visual representation of the exceptional lines can also be obtained from the impedance spectrum of the TE circuit. In general, the impedance between any two arbitrary nodes and in the circuit can be measured by connecting an external current source providing a fixed current to the two nodes and measuring the resulting voltages at the two nodes and . The impedance in the circuit is then given by
| (4) |
where and are the voltage at node and the eigenvalue of the eigenmode of the (finite-width) Laplacian. One of the key characteristics of Eq. 4 is that the impedance diverges (increases to a large value) in the vicinity of the zero-admittance modes ( ) for non-zero eigen-mode voltages and . Therefore, the locus of the high impedance readout can be used to mark out the exceptional lines in momentum space. The lower panels of Fig. 3a and b depict the corresponding impedance spectra for the parameter sets in Fig. 2b and c respectively. The plotted impedance is that across the two nodes in a unit cell (i.e. with nodes and chosen to be terminal points at either end of the circuit). (For the case of plotted in Fig. 3b, the lines are also exceptional lines.) For both resistive values, the locus of high impedance readouts coincides exactly with the exceptional lines in the admittance spectrum (compare upper and lower panels of Fig. 3). This suggests the possible electrical detection of exceptional lines in the TE system via impedance measurements.
.3 Zero-admittance states in finite system
To gain further insight into the zero-admittance states of a non-Hermitian system, we will study a 2D dissipative TE system described by Eq. 1 , which is finite along the -direction, i.e., having open boundary conditions along that direction, but is infinite in the -direction. Before investigating the properties of the finite system, we will first explain some properties of the infinite-sized 2D system. For this system, Kirchoff’s current law at the and nodes at resonance can be written as
| (5) |
and
| (6) |
By substituting the ansatz in Eqs. 5 and 6, we obtain
| (7) |
where and . For a given and , can be solved from Eq. 7 as
| (8) |
where and , and
| (9) |
When ,
| (10) |
It can be readily seen that , and because , this indicates that the corresponding values of would be real when . In this case, . On the other hand, when , is real, and, in general, . This indicates that the corresponding values of would be imaginary. At the boundary between the two cases, we have
so that the corresponding depending on the sign of . When , the terms in Eq. 10 result in a finite separation along the axis between two points on the same equal admittance contours (EACs) for a given value (see Fig. 4). The two values of meet when . Figure 4a depicts the case where when . Here, for a given , on the EAC becomes single-valued at . Figure 4b depicts the case where when , and here becomes single-valued at . For both cases, the values of where mark the boundaries for the existence of real .

We now consider the nanoribbon geometry with a finite width along the -direction. We show in the Supplementary Materials that for the nanoribbon geometry with non-zero , the zero-admittance exceptional points do not occur within the bulk energy gaps, but in the bulk bands where real values of exist for in the infinite bulk system. Due to the finite width of the nanoribbons, these zero-admittance points occur as quantized bulk states. The points on the axis that mark the threshold for the existence of the zero admittance states for the nanoribbon system coincide with the values where the solutions of at in Eq. 8 are equal, i.e., when . These values of would mark the ‘boundary points’ (BPs) of the system. The values of corresponding to the BPs are given by the solutions of the following equation:
| (11) |
where and independently. The four possible combinations of and and the two possible signs of in Eq. (11) therefore provide up to eight real solutions for . The BPs come in pairs, and hence, depending on the choice of the coupling capacitances and and resistance , we can obtain up to a maximum of four pairs of BPs (see later discussions on phase diagram). Note that the BPs set the boundaries for the existence of exceptional points. In a nanoribbon, the exceptional points do not necessarily appear exactly at the BPs, but in between alternating pairs of BPs. To illustrate the role of the capacitive and resistive coupling parameters in determining the number of BPs, we plot the admittance spectra for finite TE circuits with unit cells along the -direction in Fig. 5. In the Hermitian limit (i.e. ), the admittance spectrum is purely real, and each pair of quantized bands is symmetric about the axis. The Hermitian TE circuit can host two or four BPs depending upon the relative strength of the capacitive couplings. If , we only have a pair of BPs occurring at . However, an additional pair of BPs emerges at in the spectrum if (which is the case illustrated in Fig. 5a). The Hermitian system possesses chiral and time-reversal symmetries and belongs to to the BDI Altland-Zimbauer class Kawabata et al. (2019). Treating as a parameter to an effectively one-dimensional model, the effective 1D model along the direction is mathematically identical to the SSH model, for which the topological invariant is the winding number. The band-touching points B1 to B4 will then correspond to the values of at which the bulk band gap closes and the system transits between topologically trivial phases and topologically non-trivial phases. The emergence of the non-trivial states in Fig. 5a) span over ( to ) and ( to ) in the axis. (Although the bands appear to be flat at the scale of the figure, they actually disperse weakly and touch only at isolated points.) The transition points between non-trivial (with edge states) and trivial regions (without edge states) are marked by the onset of high impedance states (shown in the rightmost plot of Fig. 5a).

A finite non-Hermitian gain or loss term results in four different types of admittance regions for a given value of . These admittance regions can host purely real, purely imaginary, complex spectra with exceptional points, and complex admittances without states, which are labelled as I, III, IIA and IIB respectively, as shown in Figs. 5b and 5c. (For instance, the states between B2 and B3, and B6 and B7 in Fig. 5c have purely imaginary admittances.) Eigenstates with preserved and broken symmetry are present in regions I and III. Additionally, region IIA hosts exceptional points while IIB does not (see Figs. 5b and 5c ). The difference between regions IIA and IIB can be explained via the existence and non-existence of real solutions of in Eq. 8. The transition points between any two successive regions are marked by the BPs. Moreover, the zero-admittance states in region IIA and the states in the other regions are characterized by high and low impedances respectively (see impedance plots shown in the right-most column of Fig. 5b and c ). For illustration, the EPs in the region IIA are marked by crosses in Fig. 5b in both the impedance and admittance plots. The impedance readout switches between the high and low impedance states occur at the BPs, which mark the boundaries between the IIA and other regions.
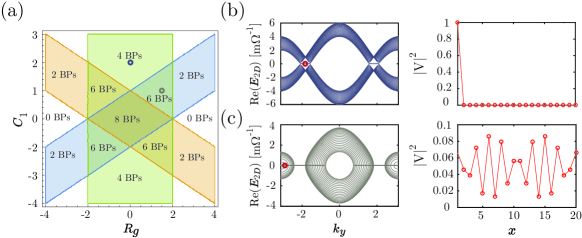
Fig. 6a shows the phase diagram of the 2D non-Hermitian TE model as a function of the resistive coupling and the capacitive coupling . The different phases are characterized by different numbers of BPs and hence different numbers of zero-admittance regions. These phases are separated from one another by phase boundaries that are defined by the existence and number of real solutions in Eq. 11. Note that BPs always occur and annihilate in pairs and they connect two admittance bands together. To study the effect of non-Hermitian term on the zero-admittance states, we consider a 2D TE system with open-boundary conditions in the -direction. In the Hermitian condition, i.e., , the system hosts zero-energy modes in which the square of the voltage amplitudes are localized at its edges, as shown in top panel of Fig. 6b. This corresponds to the usual non-trivial SSH edge state. However, in the non-Hermitian case, i.e., with the introduction of a finite , we would instead obtain bulk states at rather than edge states (see Fig. 6c). This is indicated by the square of the voltage amplitude being no longer localized at an edge.
.4 Conclusion
In conclusion, we proposed a topolectrical (TE) circuit model with resistive elements which provide loss and gain factors that break the Hermiticity of the circuit to model and realize various non-Hermitian topological phases. By varying the resistive elements, the loci of the exceptional points (or exceptional lines) of the circuit can be modulated. IWe showed that the topology of the exceptional lines in the Brillouin zone can be traced by the impedance spectra of the circuit. Additionally, we studied a finite TE system where open boundary conditions apply in one of the dimensions. In these finite circuits, we demonstrated the tunability of both the number of exceptional points corresponding to zero-admittance states, as well as that of boundary points (BPs) which delineate the circuit parameter range where these exceptional points exist. The regions separated by the BPs are characterized by high and low values of impedance differing by several orders of magnitude, which are detectable in a practical circuit. We also derived a phase diagram of the finite TE system which delineates different between topological phases that are characterized by different number of BP pairs (up to a maximum of four). The edge state character of zero-admittance states of Hermitian LC circuits are transformed into exceptional points which are hybridized with the bulk modes in the non-Hermitian RLC circuits. In summary, we have proposed a tunable electrical framework consisting of RLC circuit networks as a means to realize different topological phases of non-Hermitian systems, and characterize them based on their impedance output, as well as their BP and exceptional line configurations.
Data availability
The data that support the plots within this paper and other findings of this study are available from the corresponding author upon reasonable request.
Code availability
The computer codes used in the current study are accessible from the corresponding author upon reasonable request.
Acknowledgement
This work is supported by the Ministry of Education (MOE) Tier-II grant MOE2018-T2-2-117 (NUS Grant Nos. R-263-000-E45-112/R-398-000-092-112), MOE Tier-I FRC grant (NUS Grant No. R-263-000-D66-114), and other MOE grants (NUS Grant Nos. C-261-000-207-532, and C-261-000-777-532).
Author contributions
S.M.R-U-I, Z.B.S and M.B.A.J initiated the primary idea. S.M.R-U-I and Z.B.S contributed to formulating the analytical model and developing the code, under the kind supervision of M.B.A.J. All the authors contributed to the data analysis and the writing of the manuscript.
Additional information
Competing interests: The authors declare no competing interests.
References
- Fu and Kane (2007) L. Fu and C. L. Kane, Phys. Rev. B 76, 045302 (2007).
- Moore and Balents (2007) J. E. Moore and L. Balents, Phys. Rev. B 75, 121306 (2007).
- Liu et al. (2013) X.-J. Liu, K.-T. Law, T.-K. Ng, and P. A. Lee, Phys. Rev. Lett. 111, 120402 (2013).
- Zhang et al. (2018) D.-W. Zhang, Y.-Q. Zhu, Y. Zhao, H. Yan, and S.-L. Zhu, Adv. Phys. 67, 253 (2018).
- Lu et al. (2014) L. Lu, J. D. Joannopoulos, and M. Soljačić, Nat. Photonics 8, 821 (2014).
- Khanikaev et al. (2013) A. B. Khanikaev, S. H. Mousavi, W.-K. Tse, M. Kargarian, A. H. MacDonald, and G. Shvets, Nat. Mater. 12, 233 (2013).
- Sato and Ando (2017) M. Sato and Y. Ando, Rep. Prog. Phys. 80, 076501 (2017).
- Goldman et al. (2016) N. Goldman, J. C. Budich, and P. Zoller, Nat. Phys. 12, 639 (2016).
- Lang et al. (2012) L.-J. Lang, X. Cai, and S. Chen, Phys. Rev. Lett. 108, 220401 (2012).
- Rafi-Ul-Islam et al. (2020a) S. Rafi-Ul-Islam, Z. B. Siu, and M. B. Jalil, Appl. Phys. Lett. 116, 111904 (2020a).
- Rafi-Ul-Islam et al. (2020b) S. Rafi-Ul-Islam, Z. B. Siu, C. Sun, and M. B. Jalil, Phys. Rev. Appl. 14, 034007 (2020b).
- Roy (2009) R. Roy, Phys. Rev. B 79, 195322 (2009).
- Alvarez et al. (2018a) V. M. Alvarez, J. B. Vargas, and L. F. Torres, Phys. Rev. B 97, 121401 (2018a).
- Yao and Wang (2018) S. Yao and Z. Wang, Phys. Rev. Lett. 121, 086803 (2018).
- Lee and Thomale (2019) C. H. Lee and R. Thomale, Phys. Rev. B 99, 201103 (2019).
- Rafi-Ul-Islam et al. (2021) S. Rafi-Ul-Islam, Z. B. Siu, and M. B. Jalil, Phys. Rev. B 103, 035420 (2021).
- Kunst et al. (2018) F. K. Kunst, E. Edvardsson, J. C. Budich, and E. J. Bergholtz, Phys. Rev. Lett. 121, 026808 (2018).
- El-Ganainy et al. (2018) R. El-Ganainy, K. G. Makris, M. Khajavikhan, Z. H. Musslimani, S. Rotter, and D. N. Christodoulides, Nat. Phys. 14, 11 (2018).
- Jin and Song (2019) L. Jin and Z. Song, Phys. Rev. B 99, 081103 (2019).
- Liu et al. (2019) T. Liu, Y.-R. Zhang, Q. Ai, Z. Gong, K. Kawabata, M. Ueda, and F. Nori, Phys. Rev. Lett. 122, 076801 (2019).
- Lin et al. (2011) Z. Lin, H. Ramezani, T. Eichelkraut, T. Kottos, H. Cao, and D. N. Christodoulides, Phys. Rev. Lett. 106, 213901 (2011).
- Feng et al. (2013) L. Feng, Y.-L. Xu, W. S. Fegadolli, M.-H. Lu, J. E. Oliveira, V. R. Almeida, Y.-F. Chen, and A. Scherer, Nat. Mater. 12, 108 (2013).
- Zhu et al. (2018a) W. Zhu, X. Fang, D. Li, Y. Sun, Y. Li, Y. Jing, and H. Chen, Phys. Rev. Lett. 121, 124501 (2018a).
- Liu et al. (2016) Z.-P. Liu, J. Zhang, Ş. K. Özdemir, B. Peng, H. Jing, X.-Y. Lü, C.-W. Li, L. Yang, F. Nori, and Y.-x. Liu, Phys. Rev. Lett. 117, 110802 (2016).
- Alvarez et al. (2018b) V. M. Alvarez, J. B. Vargas, M. Berdakin, and L. F. Torres, Eur. Phys. J. Spec. Top. 227, 1295 (2018b).
- Achilleos et al. (2017) V. Achilleos, G. Theocharis, O. Richoux, and V. Pagneux, Phys. Rev. B 95, 144303 (2017).
- Zhang et al. (2016) Z. Zhang, Y. Zhang, J. Sheng, L. Yang, M.-A. Miri, D. N. Christodoulides, B. He, Y. Zhang, and M. Xiao, Phys. Rev. Lett. 117, 123601 (2016).
- Jin (2017) L. Jin, Phys. Rev. A 96, 032103 (2017).
- Yuce and Oztas (2018a) C. Yuce and Z. Oztas, Sci. Rep. 8, 1 (2018a).
- Rafi-Ul-Islam et al. (2020c) S. Rafi-Ul-Islam, Z. B. Siu, C. Sun, and M. B. Jalil, New J. Phys. 22, 023025 (2020c).
- Lee et al. (2018) C. H. Lee, S. Imhof, C. Berger, F. Bayer, J. Brehm, L. W. Molenkamp, T. Kiessling, and R. Thomale, Commun. Phys. 1, 1 (2018).
- Imhof et al. (2018) S. Imhof, C. Berger, F. Bayer, J. Brehm, L. W. Molenkamp, T. Kiessling, F. Schindler, C. H. Lee, M. Greiter, T. Neupert, et al., Nat. Phys. 14, 925 (2018).
- Helbig et al. (2019) T. Helbig, T. Hofmann, C. H. Lee, R. Thomale, S. Imhof, L. W. Molenkamp, and T. Kiessling, Phys. Rev. B 99, 161114 (2019).
- Rafi-Ul-Islam et al. (2020d) S. Rafi-Ul-Islam, Z. B. Siu, and M. B. Jalil, Commun. Phys. 3, 1 (2020d).
- Haenel et al. (2019) R. Haenel, T. Branch, and M. Franz, Phys. Rev. B 99, 235110 (2019).
- Zhu et al. (2019) W. Zhu, Y. Long, H. Chen, and J. Ren, Phys. Rev. B 99, 115410 (2019).
- Sun et al. (2020) C. Sun, S. Rafi-Ul-Islam, H. Yang, and M. B. Jalil, Phys. Rev. B 102, 214419 (2020).
- Zhu et al. (2018b) W. Zhu, S. Hou, Y. Long, H. Chen, and J. Ren, Phys. Rev. B 97, 075310 (2018b).
- Sun et al. (2019) C. Sun, J. Deng, S. Rafi-Ul-Islam, G. Liang, H. Yang, and M. B. Jalil, Phys. Rev. Appl. 12, 034022 (2019).
- Ezawa (2018) M. Ezawa, Phys. Rev. B 98, 201402 (2018).
- Peterson et al. (2018) C. W. Peterson, W. A. Benalcazar, T. L. Hughes, and G. Bahl, Nature 555, 346 (2018).
- Serra-Garcia et al. (2019) M. Serra-Garcia, R. Süsstrunk, and S. D. Huber, Phys. Rev. B 99, 020304 (2019).
- Hofmann et al. (2019) T. Hofmann, T. Helbig, C. H. Lee, M. Greiter, and R. Thomale, Phys. Rev. Lett. 122, 247702 (2019).
- Rui et al. (2019) W. Rui, M. M. Hirschmann, and A. P. Schnyder, Phys. Rev. B 100, 245116 (2019).
- Choi et al. (2019) Y. Choi, C. Hahn, J. W. Yoon, and S. H. Song, Nat. Commun. 10, 1 (2019).
- Stegmaier et al. (2020) A. Stegmaier, S. Imhof, T. Helbig, T. Hofmann, C. H. Lee, M. Kremer, A. Fritzsche, T. Feichtner, S. Klembt, S. Höfling, et al., arXiv:2011.14836 (2020).
- Lee (2016) T. E. Lee, Phys. Rev. Lett. 116, 133903 (2016).
- Weimann et al. (2017) S. Weimann, M. Kremer, Y. Plotnik, Y. Lumer, S. Nolte, K. G. Makris, M. Segev, M. C. Rechtsman, and A. Szameit, Nat. Mater. 16, 433 (2017).
- Yuce and Oztas (2018b) C. Yuce and Z. Oztas, Sci. Rep. 8, 17416 (2018b).
- Kawabata et al. (2019) K. Kawabata, K. Shiozaki, M. Ueda, and M. Sato, Phys. Rev. X 9, 041015 (2019).