- 2MASS
- The Two Micron All-Sky Survey
- 30 Dor
- 30 Doradus
- AGN
- active galactic nucleus
- ATCA
- Australia Telescope Compact Array
- ATNF
- Australia Telescope National Facility
- ATOA
- Australia Telescope Online Archive
- AT20G
- Australia Telescope 20 GHz Survey
- ASKAP
- Australian Square Kilometre Array Pathfinder
- BL-Lac
- BL Lacertae Objects
- CASS
- CSIRO Astronomy and Space Science
- CABB
- Compact Array Broadband Back-end
- CHii
- Compact Hii
- CSIRO
- Australian Commonwealth Scientific and Industrial Research Organisation
- CSS
- Compact Steep Spectrum
- CME
- Coronal Mass Ejection
- Dec
- Declination
- DD
- double-degenerate
- DS9
- SAOImage DS9
- DSS
- Digital Sky Survey
- EMU
- Evolutionary Map of the Universe
- eV
- electronvolt: 1 eV J
- Fits
- Flexible Image Transport System
- FRB
- Fast Radio Bursts
- FRII
- Fanaroff-Riley II
- FRI
- Fanaroff-Riley I
- FSRQ
- Flat Spectrum Radio Quasars
- FWHM
- full width at half-maximum
- GLEAM
- GaLactic Extragalactic All-sky MWA
- GMRT
- Giant Meterwave Radio Telescope
- GRG
- Giant Radio Galaxy
- GPS
- Gigahertz Peak Spectrum
- HEMT
- High Electron Mobility Transistor
- HFP
- High Frequency Peaker
- HzRGs
- High Redshift Radio Galaxies
- HVS
- hypervelocity star
- pHFP
- Potential High Frequency Peaker
- HST
- Hubble Space Telescope
- IAU
- International Astronomical Union
- IFRSs
- Infrared Faint Radio Sources
- ISM
- interstellar medium
- IR
- Infrared
- Jy
- Jansky, 1 Jy =
- LLS
- Largest Linear Size
- LFAA
- Low-Frequency Aperture Array
- LMC
- Large Magellanic Cloud
- LG
- Local Group
- LSOs
- Large Scale Objects
- MACHO
- Massive Astrophysical Compact Halo Objects
- MCs
- Magellanic Clouds
- MC
- Magellanic Cloud
- MCELS
- Magellanic Cloud Emission Line Survey
- MW
- Milky Way
- Miriad
- Multichannel Image Reconstruction, Image Analysis and Display
- MIT
- Massachusetts Institute of Technology
- MOST
- Molonglo Observatory Synthesis Telescope
- MQS
- Magellanic Quasars Survey
- MRC
- Molonglo Reference Catalogue of Radio Sources
- MWA
- Murchison Widefield Array
- NAT
- Narrow-Angle Tail
- NRAO
- National Radio Astronomy Observatory
- NVSS
- NRAO VLA Sky Survey
- ORC
- Odd Radio Circle
- OPAL
- Online Proposal Applications & Links
- OVV
- Optically Violent Variable Quasars
- PAF
- Phased Array Feed
- pc
- parsec: 1 pc m
- PMN
- Parkes-MIT-NRAO
- PNe
- Planetary Nebulae
- PN
- Planetary Nebula
- PWN
- Pulsar Wind Nebula
- QSO
- Quasi-Stellar Object
- RA
- Right Ascension
- RFI
- Radio-Frequency Interference
- rms
- Root Mean Squared
- SDSS
- Sloan Digital Sky Survey
- SED
- spectral energy distribution
- Spectral Index,
- SKA
- Square Kilometre Array
- SMASH
- Survey of the MAgellanic Stellar History
- SMB
- Super Massive Blackholes
- SMC
- Small Magellanic Cloud
- SN
- Supernova
- SNe
- Supernovae
- SNR
- Supernova Remnant
- SD
- single-degenerate
- SUMSS
- Sydney University Molonglo Sky Survey
- SMBH
- Super Massive Black Hole
- Topcat
- Tool for OPerations on Catalogues And Tables
- USS
- Ultra Steep Spectrum
- WBAC
- Wide-Band Analogue Correlator
- WiFeS
- Wide-Field Spectrograph
- WISE
- Wide-Field Infrared Survey Explorer
- VLA
- Very Large Array
- VLBI
- Very Long Baseline Interferometry
- Velocity in the Line of Sight
- WD
- white dwarf
New ASKAP Radio Supernova Remnants and Candidates in the Large Magellanic Cloud
Abstract
We present a new Australian Square Kilometre Array Pathfinder (ASKAP) sample of 14 radio Supernova Remnant (SNR) candidates in the Large Magellanic Cloud (LMC). This new sample is a significant increase to the known number of older, larger and low surface brightness LMC SNR. We employ a multi-frequency search for each object and found possible traces of optical and occasionally X-ray emission in several of these 14 SNR candidates. One of these 14 SNR candidates (MCSNR J0522–6543) has multi-frequency properties that strongly indicate a bona fide SNR. We also investigate a sample of 20 previously suggested LMC SNR candidates and confirm the SNR nature of MCSNR J0506–6815. We detect lower surface brightness SNR candidates which were likely formed by a combination of shock waves and strong stellar winds from massive progenitors (and possibly surrounding OB stars). Some of our new SNR candidates are also found in a lower density environments in which SNe type Ia explode inside a previously excavated interstellar medium (ISM).
keywords:
ISM: supernova remnants – (galaxies:) Magellanic Clouds1 Introduction
Supernovae (SNe) are powerful explosions that mark the end for certain types of stars. The study of SNe and their remnants is essential to understanding the physical and chemical evolution of the ISM. SNe are typically categorised as arising either from a core-collapse event occurring in more massive, short-lived stars (8 M⊙), or a thermonuclear type Ia event occurring in carbon-oxygen white dwarfs. Both types enrich the ISM with heavy elements, create a shock wave that heats the swept-up ISM, compress magnetic fields, and accelerate particles such as cosmic rays (e.g. Filipović & Tothill, 2021a).
In the search for the imprints of these SNe explosions, a few key characteristics are used to classify an object as a SNR: a non-thermal radio spectral index of (defined as , where is flux density, is frequency and is the spectral index), diffuse X-ray emission and an elevated [Sii]/H ratio which is produced by the high-velocity shocks (e.g. Hurley-Walker et al., 2021; Maggi, 2021; Yew et al., 2021). Not all SNR exhibit all three of these characteristics. Typically, two of these characteristics are enough to confirm a SNR classification, while one of them marks the source as an SNR candidate (Reynolds et al., 2012; Maggi et al., 2016; Bozzetto et al., 2017; Maggi et al., 2019). Also, a variety of SNR types (such as Pulsar Wind Nebula (PWN)) produces other recognisable signatures such as the polarised radio emission and flatter radio spectral index.
The LMC, an irregular dwarf galaxy, has been the target of extensive studies into SNR since they were first observed by Mathewson & Healey (1964). Details of the LMC SNR studies are covered in Bozzetto et al. (2017) & Yew et al. (2021). The LMC is of particular interest in the hunt for SNR because of its low foreground absorption and relatively close proximity of 50 kpc (Pietrzyński et al., 2019). While the proximity of the LMC allows us to study our nearest Galactic neighbour in more detail than those further away, for all intents and purposes, all objects within the LMC are assumed to be at the same approximate 50 kpc.
The LMC also hosts a mini-starburst at sub-solar metallicity. This may result in a dis-proportionally high number of very massive stars (100 M⊙; Schneider et al., 2018) and pair-instability SNe which ultimately produce SNR. The mean energy of the LMC SNR is erg, very similar to Galactic SNR ( erg; Leahy, 2017; Leahy et al., 2020).

The new generation of radio telescopes such as ASKAP and MeerKAT, with their higher sensitivity instrumentation, give us an unprecedented look into some of the older, larger, faded remnants – especially those that are embedded or obscured by nearby stronger sources (Norris et al., 2021; Koribalski et al., 2021; Filipović et al., 2022; Johnston et al., 2022) and those expending into cavities blown by the progenitor. Certainly, small size LMC SNR ( arcsec or 3.5 pc at the LMC distance) are presumably young (and therefore bright) and they are most likely discovered in the previous surveys (Urošević, 2022).
In this paper, we make use of new radio continuum data taken by the ASKAP telescope (Pennock et al., 2021; Filipović et al., 2021) to add 14 new candidates to the LMC SNR sample, creating the most complete SNR sample of any galaxy (see Fig. 1). Moving towards such a comprehensive population is essential for statistical analysis and the evolutionary understanding of the remains of exploded stars. A complete sample of SNR provides the ability to study their global properties, in addition to carrying out detailed analyses of their sub-classes (e.g., sorted by X-ray, optical and radio morphology or by progenitor Supernova (SN) type).
2 Observations and Data Processing
This paper draws together various existing surveys of the LMC at multiple wavelengths to identify new candidate SNR, with a primary focus on the sources identified in the new ASKAP observations of Pennock et al. (2021, see Fig. 1).
2.1 ASKAP data
These ASKAP radio data comprise a twelve-pointing mosaic taken of the LMC at a centre frequency of 888 MHz (bandwidth of 256 MHz, spatial resolution of 13.912.1 arcsec2 and position angle ). Details of the observations, data reduction and analysis of these data have been presented in Pennock et al. (2021). The image shown in Fig. 1 is affected by various artefacts and missing short spacing data. However, its robust maximum angular scale of 49 arcmin combined with improved sensitivity (Filipović et al., 2022) ensures a reasonable environment to search for new LMC SNR. At the time of these observations (April 2019) ASKAP didn’t have polarisation capability, and therefore, the ASKAP image used here is total intensity (Stokes I).
2.2 ATCA data
We observed MCSNR J0522–6543111To distinguish between SNR candidates and confirmed SNR, Maggi et al. (2016) established nomenclature where bona fide Magellanic Clouds (MCs) SNR are named with the prefix ‘MCSNR J’ and candidates with only ‘J’. with the Australia Telescope Compact Array (ATCA) on 30th November 2019 and 23rd February 2020 (project codes C3275 and C3292; see Appendix A.8). The observations were carried out in frequency switching mode (between 2100 MHz and 5500/9000 MHz) with 1-hour of integration over a 12-hour period using arrays 1.5C and EW367. The Compact Array Broadband Back-end (CABB) with its 2048 MHz bandwidth was used centred at =5500 and 9000 MHz, totaling 117.62 minutes of integration. At the same time, we also used the =2100 MHz band with a total of 112.2 minutes of integration. The primary (flux) calibrator was PKS B1934–638 (=11.651, =5.010 and =2.704 Jy) and secondary calibrator (phase) was PKS B0530–727 (=0.680, =0.585 and =0.695 Jy). For imaging, we used WSClean (Offringa et al., 2014) and flagged out data from the 6th antenna for all observations to focus on the extended emission of this object at the expense of reducing the resolution. We achieved a resolution of 20.9516.60 arcsec2 at 2100 MHz, 15.8512.79 arcsec2 at 5500 MHz and 8.817.05 arcsec2 at 9000 MHz (all at P.A.=0 degrees) with a corresponding rms noise of 0.1, 0.05 and 0.025 mJy beam-1, respectively.
2.3 Optical, X-ray and IR data
The optical data used in this study consists of H, [Sii], [Oiii] images from the Magellanic Cloud Emission Line Survey (MCELS) survey; more details can be found in Points et al. (2019).
To gain insight into the type of stellar environment hosting the suspected progenitors of these objects, we use data sourced from the Magellanic Clouds Photometric Survey (MCPS; Zaritsky et al., 2004). To this end, we construct colour-magnitude diagrams and identify blue stars more massive than 8 M☉ within a 100 pc (6.9 arcmin at the distance of the LMC; 107 yr at 10 km s-1) radius of each of the objects presented in this study. The size of SNR can well exceed 150 pc in diameter and therefore our chosen search area will give us a good view of the environment and possible origin of these objects as demonstrated in Bozzetto et al. (2017). This allows us to see the prevalence of early-type stars close to the candidate remnants.
2.4 Hi data
For atomic hydrogen, we used the ATCA & Parkes Hi survey data from Kim et al. (2003) with its angular resolution of 60 60 arcsec2. We made the velocity channel maps and position-velocity () diagrams to constrain the velocity ranges of Hi clouds that physically interact with the SNR. The velocity channel maps provide a spatial correspondence between the SNR shell boundary and Hi clouds as tested by previous studies (e.g. Moriguchi et al., 2005). When the Hi clouds are associated with the SNR, they are expected to be located along with the shell. Likewise, Hi cavities in diagrams are also expected when supernova shocks and/or stellar winds from the progenitor evacuated (accelerated) the Hi gas.
In order to define the shock-interacting velocity range of Hi clouds, we first prepared velocity channel maps of Hi towards each SNR candidate. Because the shock-interacting clouds will be limb-brightened in the synchrotron radio continuum through the shock-cloud interactions with the magnetic field amplification, the velocity channel distribution of Hi is useful to identify the spatial correlation between the shocked Hi clouds and SNR candidate shells.
Here, we prepared a velocity channel distribution of Hi as a velocity step of 6.6 km s-1 (see Appendix A). The map was centred at each SNR candidate with a size of 50 50 arcmin2. Finally, we searched for expanding shell-like structures in the diagram by changing the integration range of R.A. When the expanding gas motion is identified, we selected the Hi velocity range which traces the inner edge of the cavity in the diagram.
3 Results & Discussion
The first extragalactic SNR was discovered over half a century ago as the LMC SNR N 49 (Mathewson & Healey, 1963). Ever since then, studies of our Milky Way (MW) immediate neighbouring galaxy the LMC SNR sample is recognised as of essential importance because it provides the best opportunity to reach a complete sample of these objects. With every new generation of astronomical instruments, we improved our knowledge about these objects as they come in large varieties. One of the most important aspects of these previous studies is to detect new SNR which in return provides a better view of their evolutionary processes in various environments and with different progenitors.
As introduced in Section 1, we divide the LMC SNR population into two groups: bona fide SNR and SNR candidates. Previous studies of the LMC SNR revealed 71 confirmed objects (58+1+1+1+3+7 as in Bozzetto et al., 2017; Maggi et al., 2016; Maitra et al., 2019, 2021; Yew et al., 2021; Kavanagh et al., 2022) and 20 candidates (4+15+1 as in Bozzetto et al., 2017; Yew et al., 2021; Filipović et al., 2022). These studies are mainly based on the previous generation of ATCA radio, XMM-Newton and Chandra X-ray and MCELS optical surveys. One of the main conclusions from Bozzetto et al. (2017) study of the LMC SNR sample is that we were missing detection of large size but low surface brightness SNR. It was also acknowledged that some SNR could escape detection as they could be embedded into the large scale Hii regions such as 30 Doradus (Kavanagh et al., 2015). Along that expectation, we endeavour in a search for new LMC SNR using the latest generation of ASKAP radio survey (Pennock et al., 2021).
3.1 Previous LMC SNR candidates
We first investigate the present LMC SNR candidate sample of 20 objects. Yew et al. (2021) found that none of their 15 optically selected candidates can be detected in our ASKAP survey. In addition to these, Filipović et al. (2022) suggested that ASKAP J0624–6948 is an intergalactic SNR positioned in the outskirts of the LMC, but the true nature of this object remains mysterious.
This leaves four remaining LMC SNR candidates that are initially investigated in Bozzetto et al. (2017): J0506–6815 ([HP99] 635), J0507–7110 (DEM L81), J0538–6921 (MC 73) and J0539–7001 ([HP99] 1063)). We search for their radio continuum SNR signature in our ASKAP survey (see Fig. 2) as well as in other wavelengths.
We find that J0506–6815 ([HP99] 635) is a circular source in our ASKAP radio image (see Figs. 2 (top left panel) and 3) with an estimated flux densities of =782 mJy and =644 mJy (from Filipović et al. (2021)) produce a spectral index . Together with a prominent central soft X-ray emission in the XMM-Newton survey and [Sii]/H0.9, we now safely confirm MCSNR J0506–6815 as a bona fide SNR. Interestingly, the X-ray emission occupies central part of the SNR while radio and optical emission dominates at the edges. This anti-correlation indicates that MCSNR J0506–6815 could be very similar to the known iron-rich cores SNR such as MCSNR J0506–7025 and MCSNR J0527–7104 (Kavanagh et al., 2016, 2022).
SNR candidate J0507–7110 (DEM L81; Fig. 2 top right panel) shows some typical SNR morphological characteristics, but in our ASKAP LMC radio image this object is confused by the nearby emission and other sources. Therefore, we are keeping its status as a candidate SNR.
J0538–6921 (MC 73; Fig. 2 bottom left panel) is certainly a prototype radio SNR candidate based on its radio properties (=2943 mJy; =2484 mJy; =12010 mJy; ) but lack of X-ray or optical confirmation prevent us from a final classification.
We clearly see a point radio source close to the centre of X-ray LMC SNR candidate J0539–7001 ([HP99] 1063; Fig. 2 bottom right panel), but we cannot confirm its SNR nature as the positional displacement between radio and X-ray position of 25 arcsec is not negligible. Also, no other nearby and obvious fine-scale structure could be linked with the object’s possible SNR nature. However, we acknowledge that a compact type of SNR candidate such as J051327–6911 (Bojičić et al., 2007) is still a possibility.


3.2 New ASKAP LMC SNR candidates
We searched our new ASKAP images of the LMC for circular shaped objects (above 5 of local noise) with an enhanced ratio of radio continuum to H emission. This method, introduced by Ye et al. (1991), successfully identifies objects in which non-thermal emission is dominant, i.e. SNR. Using this enhanced ratio, combined with the typically circular SNR morphology, we find 14 regions in which the presence of an SNR is plausible. We present a catalogue of radio images of these newly discovered SNR candidates in Fig. 4 and details in Appendix A.

We used the method described in Hurley-Walker et al. (2019, Section 2.4) and Filipović et al. (2022) to measure the position, extent and flux densities of all 14 selected LMC SNR candidates. In the same manner, we measure the three ATCA observations of MCSNR J0522–6543 (at 2100, 5500 and 9000 MHz). In short, we carefully selected proposed SNR regions that exclude all obvious point sources and then measured the total radio flux density, accounting for local background. We note the selected SNR candidates have low surface brightness and/or are sometimes embedded in complex environments (c.f. J0457–6823, J0459–7008b222Because of the close proximity (and similar position) to SNR N 186D, we use ‘b’ (as J0459–7008b) to distinguish between two possibly separate objects. and J0459–6757). This significantly influences the accuracy or may prevent any meaningful measurements. We estimate our flux density measurements have an error of 20 per cent. Also, Filipović et al. (2022, see their Figure 7) noted that a lack of short spacing data in observations333We also used the same 888 MHz image and the same ATCA array observations with the similar integration time. may result in under-estimates of extended flux density measurements. Filipović et al. (2022) suggest that spectral index estimates could be as much as 15–20 % (or 0.1) flatter.
In Table 1 we list the source name in Column 1, its central position (RA and DEC) in Columns 2 and 3, source angular extent as major and minor axis/diameter in Column 4 (in arcsec), arithmetic average of major and minor axes/diameter converted to parsecs for a distance of 50 kpc in Column 5, and position angle (PA) in Column 6, measured from north to east. Our flux density estimates at 888 MHz are listed in Column 7. As none of the here selected LMC SNR candidates (except for MCSNR J0522–6543) can be seen at other radio frequencies, we can not estimate their spectral index. To compare the surface brightness of our sample with established LMC SNR, we assumed a typical SNR spectral index of (Reynolds et al., 2012; Galvin & Filipovic, 2014; Bozzetto et al., 2017; Maggi et al., 2019; Filipović & Tothill, 2021b). However, we acknowledge that some of our SNR candidates may contain an old PWN which would have a somewhat flatter spectral index. Using this assumed spectral index allowed us to estimate the flux density and surface brightness of these sources at 1 GHz (Column 8; ). In Column 9 we provide the number of massive OB stars found within a 100 pc radius of each of the objects’ central position. Lastly, in Columns 10 and 11, Y/N apply when optical and X-ray data are available and/or the source is detected.
| Name | RA (J2000) | DEC (J2000) | PA | # OB Star | Optical | X-ray | ||||
|---|---|---|---|---|---|---|---|---|---|---|
| (h m s) | (∘ ′ ′′) | (arcsec) | (pc) | (∘) | (mJy) | (W m-2 Hz-1sr) | Candidates | ID | ID | |
| J0451–6906 | 04 51 38.9 | –69 06 26 | 299 194 | 58 | 90 | 27 | 2.41 | 19 | Y | – |
| J0451–6951 | 04 51 50.8 | –69 51 30 | 170 168 | 41 | 0 | 1 | 0.21 | 10 | N | N |
| J0452–6638 | 04 52 42.4 | –66 38 35 | 277 196 | 56 | 90 | 5 | 0.04 | 29 | Y | – |
| J0457–6823 | 04 57 30.9 | –68 23 35 | 196 115 | 36 | 60 | — | — | 33 | Y | ? |
| J0459–7008b | 04 59 38.7 | –70 08 37 | 203 178 | 46 | 150 | — | — | 44 | Y | – |
| J0459–6757 | 04 59 54.9 | –67 57 04 | 131 114 | 30 | 0 | — | — | 18 | Y | – |
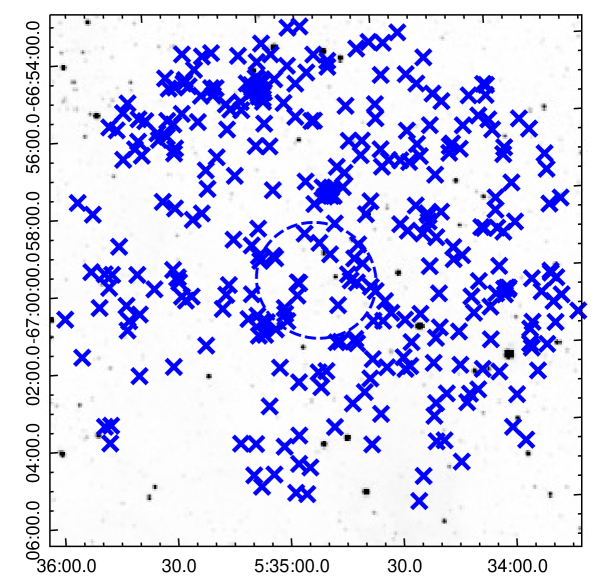
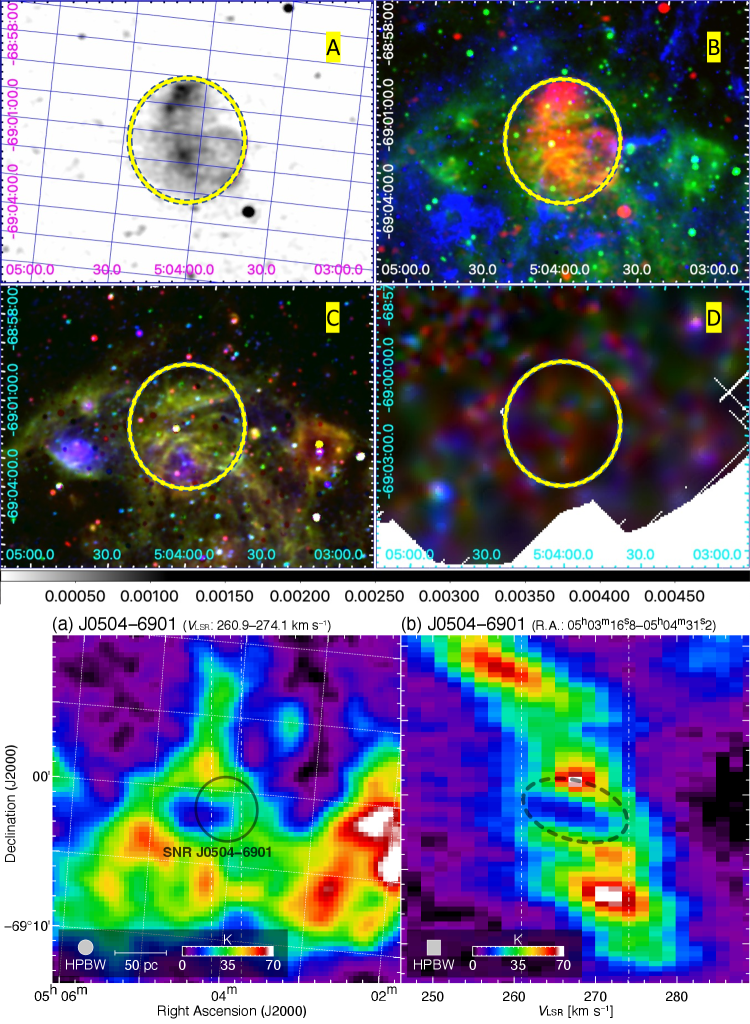
| J0504–6901 | 05 04 04.8 | –69 01 12 | 259 246 | 61 | 22 | 93 | 7.49 | 72 | Y | ? |
| J0522–6543 | 05 22 53.5 | –65 43 09 | 171 159 | 40 | 0 | 35 | 6.54 | 15 | Y | – |
| J0534–6720 | 05 34 05.5 | –67 20 48 | 293 288 | 70 | 0 | 102 | 6.15 | 45 | N | – |
| J0534–6700 | 05 34 48.7 | –67 00 01 | 188 179 | 45 | 0 | 1 | 0.21 | 325 | N | – |
| J0542–6852 | 05 42 05.9 | –68 52 14 | 251 218 | 57 | 75 | 74 | 6.92 | 40 | Y | Y |
| J0543–6928 | 05 43 06.3 | –69 28 42 | 157 104 | 31 | 125 | 45 | 14.11 | 34 | N | N |
| J0543–6923 | 05 43 16.5 | –69 23 27 | 228 213 | 54 | 0 | 28 | 2.92 | 31 | ? | N |
| J0543–6906 | 05 43 25.2 | –69 07 19 | 443 354 | 96 | 0 | 83 | 2.42 | 50 | N | ? |
These 14 new SNR candidates escaped previous detection because of their low surface brightness, which indicates an advanced age. They are most likely evolved and expanding in a rarefied environment, and we note that they occupy the bottom part of the SNR –D diagram (Pavlović et al., 2018; Urošević, 2020). In fact, the arithmetic average of surface brightness (; Table 1, Column 8) from the sample of 40 LMC SNR (Bozzetto et al., 2017) is 7.9 W m-2 Hz-1sr-1 while from our sample of 14 new candidates is 4.5 W m-2 Hz-1sr-1. This order of magnitude difference suggests that we are discovering low surface brightness SNR in the LMC. At the same time, our sample SNR candidate diameters are fractionally larger but because of the large overlap with the sample of established LMC SNR (=51.2 pc and SD=16.9 vs. =44.9 pc and SD=24.9) we can not separate two samples.
The size distribution of the 14 new SNR candidates against the 71 (58+1+1+1+3+7) previously confirmed SNR from Bozzetto et al. (2017), Maggi et al. (2016); Maitra et al. (2019, 2021), Yew et al. (2021) and Kavanagh et al. (2022) can be seen in Fig. 5. Our new sample of 14 LMC SNR candidates are distributed across a large range of sizes from 30 to 96 pc. From the sample of 71 known LMC SNR, 45 objects have an estimated age, which spreads from the small size SN1987A of 35 yrs to the large 107 pc DEM L72 of 115000 yrs (Klimek et al., 2010). Bozzetto et al. (2017, see their fig. 18) showed that at age of 5000 yrs SNR such as N 49 (Park et al., 2012) or 30 Dor B (a.k.a. N 157B; Chen et al., 2006) can reach sizes of 30 pc in diameter which is mid-to-late Sedov phase. However, this is very much dependent on various factors such as the environmental density, initial progenitor type and its explosion energy. Nevertheless, this implies that our sample of 14 new objects belongs to a more evolved and mid-to-older ( yrs) SNR population.
We also cross-matched various X-ray surveys and pointed observations including XMM-Newton and Chandra. However, one would not expect to detect X-ray emission from an SNR in the very late stage of evolution in such a rarefied environment, especially at the distance of 50 kpc, as shown in the above-mentioned case of J0624–6948 (Filipović et al., 2022). SNR X-ray emission depends on ISM density squared, while synchrotron emission scales linearly with ISM density (Duric, 2000a, b; Urošević, 2022). This implies that X-ray emission in less dense environments will fade much quicker than predominantly non-thermal (synchrotron) radio emission. In some cases (8/14) we can detect very weak optical emission (mainly H) which indicates active non-radiative shocks from the late Sedov and radiative phases, implying an older SNR.
Optical emission from SNR typically originate from highly compressed, thin, radiative shells. This may further indicate the eight optically-identified SNR candidates are not expanding in a low-density medium. In 6 candidates, we did not detect optical emission, which suggests that these SNR candidates are in the radiative phase of their evolution. However, in the radiative phase, there could be significant emission from various coolants, depending on temperature (). Most notably, we may see [Oiii] emission from 105 K gas, as the X-ray emission of such shocks fades. However, for 105 K there is little line emission in the MCELS optical bands that we use here. This all implies that in many cases, the X-rays from SNR fade first followed by the optical emission and then the last standing emission before the remnant completely disappears would come from radio continuum (Vink, 2020). That suggests, the eight optically-detected candidates are perhaps not as old as those in which we detect only radio emission. We also detect one SNR candidate (J0542–6852) in the XMM-Newton survey which strengthens our SNR classification for this source.

We investigate the Hi properties of our SNR candidate sample (see Appendix A). As a result, 80% (11 out of 14) of them show possible evidence of expanding Hi shells, which were likely formed by a combination of shock waves and strong stellar winds from the massive progenitor (and possibly surrounding OB stars). As shown in the Appendix A, several SNR show a good spatial correspondence between the intensity peaks of the radio continuum and Hi, suggesting that shock-cloud interactions occurred. Indeed, our diagrams show cavities in which these SNR are almost freely expanding (Sano et al., 2020; Luken et al., 2020; Alsaberi et al., 2019). Some of these 14 LMC SNR candidates (such as J0451–6906, J0457–6823, J0459–6757, J0534–6720, J0534–6700, J0542–6852 and J0543–-6923 have reached the wind-cavity of Hi, while others (such as J0452–6638, J0504–6901, J0522–6543 ) are in the free expansion phase inside the wind bubble. This is very similar to Galactic SNR SN 1006 (Sano et al., 2022), G346.6–0.2 (Sano et al., 2021b) and the mixed-morphology W49B (Sano et al., 2021a) where a wind-blown bubble was found along the radio continuum shell with an expansion velocity of 10 km s-1, which was likely formed by strong stellar winds from the high-mass progenitor of the SNR.
Finally, we investigate the stellar environment of each of our 14 SNR candidates (Fig. 6) using a 100 pc (107 yr at 10 km s-1) search radius. The number of OB stars () in the environments of these objects is an indicator of whether they are more likely to be core-collapse rather than type Ia SNRs, as such short-lived stars are a direct tracers of star formation activity that must have occurred recently in the core-collapse scenario. This indicator was calibrated in the LMC in Maggi et al. (2016) using SNR types determined via other methods. Numbers of neighbouring OB stars less than 15 are associated with type Ia SNR while CC SNR had generally (much) more than 35 such stars around them. The overall number of OB stars in our candidates trend toward the lower end of what is observed in other confirmed LMC SNR with several in the ‘undecided’ range. The outlier here is J0534–6700 which has 325 blue early-type stars in the immediate vicinity of the remnant which point toward a most likely core-collapse scenario. However, in the SN-cavities we also expect a small number of neighbouring OB stars which suggests relatively low-mass (8-10 M⊙) SN II-P progenitors. The local ratio of red supergiants to OB stars might corroborate such a hypothesis as well.
J0451-6906
J0451-6951
J0452-6638
J0457-6823


J0459-7008b
J0459-6757
J0504-6901
J0522-6543


J0534-6720
J0534-6700
J0542-6852
J0543-6928


J0543-6923
J0543-6906


4 Conclusions
We have presented 14 new SNR candidates in the LMC, adding to the ongoing effort of compiling a comprehensive set of LMC SNR. For one of these 14 objects (MCSNR J0522–6543) we confirm SNR nature based on the elevated [Sii]/H ratio and non-thermal radio spectral index (see Appendix A.8) as well as for one previously selected candidate (MCSNR J0506–6815). This increases the count of SNR in the LMC to 73 confirmed and 32 candidates. Our radio candidates are fainter in comparison to previously known SNR in the LMC; their detection made possible by a new generation of radio telescopes with improved sensitivity (such as ASKAP). Most of our candidate remnants do not have counterparts in the X-ray domain because of the non-complete coverage and poor sensitivity, but a few have optical signatures. These SNR candidates have a low surface brightness compared to their diameter, which we interpret as indicating an evolution in a rarefied medium. This conclusion is supported by their predominantly circular morphology. We suggest a few of these remnant candidates may have a SN type Ia origin (fewer OB stars than commonly seen) while others may be expanding in a cavity resulting from previous winds or SNe. Future work using deeper radio observations (at multiple wavelengths to allow the calculation of spectral indices and confirmation of their non-thermal nature) and deeper targeted X-ray and optical observations will be essential in confirming these sources as SNR.
Acknowledgements
The Australian SKA Pathfinder is part of the Australia Telescope National Facility which is managed by Australian Commonwealth Scientific and Industrial Research Organisation (CSIRO). Operation of ASKAP is funded by the Australian Government with support from the National Collaborative Research Infrastructure Strategy. ASKAP uses the resources of the Pawsey Supercomputing Centre. Establishment of ASKAP, the Murchison Radio-astronomy Observatory and the Pawsey Supercomputing Centre are initiatives of the Australian Government, with support from the Government of Western Australia and the Science and Industry Endowment Fund. We acknowledge the Wajarri Yamatji people as the traditional owners of the Observatory site. This work was supported by resources provided by the Pawsey Supercomputing Centre with funding from the Australian Government and the Government of Western Australia. D.U. acknowledges the Ministry of Education, Science and Technological Development of the Republic of Serbia through contract No. 451-03-68/2022-14/200104, and for support through the joint project of the Serbian Academy of Sciences and Arts and Bulgarian Academy of Sciences on the detection of extragalactic SNR and Hii regions. MS acknowledges support from the Deutsche Forschungsgemeinschaft through the grants SA 2131/13-1, SA 2131/14-1, and SA 2131/15-1. We thank the anonymous referee for comments and suggestions that greatly improved our paper.
Data Availability
The data that support the plots/images within this paper and other findings of this study are available from the corresponding author upon reasonable request. The ASKAP data used in this article are available through the CSIRO ASKAP Science Data Archive (CASDA) and ATCA data via the Australia Telescope Online Archive (ATOA).
References
- Alsaberi et al. (2019) Alsaberi R. Z. E., et al., 2019, Ap&SS, 364, 204
- Bojičić et al. (2007) Bojičić I. S., Filipović M. D., Parker Q. A., Payne J. L., Jones P. A., Reid W., Kawamura A., Fukui Y., 2007, MNRAS, 378, 1237
- Bozzetto et al. (2017) Bozzetto L. M., et al., 2017, ApJS, 230, 2
- Chen et al. (2006) Chen Y., Wang Q. D., Gotthelf E. V., Jiang B., Chu Y.-H., Gruendl R., 2006, ApJ, 651, 237
- Davies et al. (1976) Davies R. D., Elliott K. H., Meaburn J., 1976, Mem. RAS, 81, 89
- Duric (2000a) Duric N., 2000a, in Berkhuijsen E. M., Beck R., Walterbos R. A. M., eds, Proceedings 232. WE-Heraeus Seminar. pp 127–130
- Duric (2000b) Duric N., 2000b, in Berkhuijsen E. M., Beck R., Walterbos R. A. M., eds, Proceedings 232. WE-Heraeus Seminar. pp 179–186
- Filipović & Tothill (2021b) Filipović M. D., Tothill N. F. H., eds, 2021b, Multimessenger Astronomy in Practice. 2514-3433, IOP Publishing, doi:10.1088/2514-3433/ac2256, https://dx.doi.org/10.1088/2514-3433/ac2256
- Filipović & Tothill (2021a) Filipović M. D., Tothill N. F. H., 2021a, Principles of Multimessenger Astronomy. AAS-IOP astronomy, Institute of Physics Publishing, doi:10.1088/2514-3433/ac087e
- Filipovic et al. (1995) Filipovic M. D., Haynes R. F., White G. L., Jones P. A., Klein U., Wielebinski R., 1995, A&AS, 111, 311
- Filipovic et al. (1996) Filipovic M. D., White G. L., Haynes R. F., Jones P. A., Meinert D., Wielebinski R., Klein U., 1996, A&AS, 120, 77
- Filipovic et al. (1998) Filipovic M. D., Haynes R. F., White G. L., Jones P. A., 1998, A&AS, 130, 421
- Filipović et al. (2021) Filipović M. D., et al., 2021, MNRAS, 507, 2885
- Filipović et al. (2022) Filipović M. D., et al., 2022, MNRAS, 512, 265
- Galvin & Filipovic (2014) Galvin T. J., Filipovic M. D., 2014, Serbian Astronomical Journal, 189, 15
- Haberl (2019) Haberl F., 2019, in A Synoptic View of the Magellanic Clouds: VMC, Gaia and Beyond. p. 63, doi:10.5281/zenodo.3472583
- Haberl & Pietsch (1999) Haberl F., Pietsch W., 1999, A&AS, 139, 277
- Hurley-Walker et al. (2019) Hurley-Walker N., et al., 2019, Publ. Astron. Soc. Australia, 36, e048
- Hurley-Walker et al. (2021) Hurley-Walker N., Payne J. L., Filipović M. D., Tothill N., 2021, in Filipović M. D., Tothill N. F. H., eds, 2514-3433, Multimessenger Astronomy in Practice. IOP Publishing, pp 2–1, doi:10.1088/2514-3433/ac2256ch2
- Jaskot et al. (2011) Jaskot A. E., Strickland D. K., Oey M. S., Chu Y. H., García-Segura G., 2011, ApJ, 729, 28
- Johnston et al. (2022) Johnston S., et al., 2022, MNRAS, 509, 5209
- Kavanagh et al. (2015) Kavanagh P. J., Sasaki M., Bozzetto L. M., Filipović M. D., Points S. D., Maggi P., Haberl F., 2015, A&A, 573, A73
- Kavanagh et al. (2016) Kavanagh P. J., et al., 2016, A&A, 586, A4
- Kavanagh et al. (2022) Kavanagh P. J., Sasaki M., Filipović M. D., Points S. D., Bozzetto L. M., Haberl F., Maggi P., Maitra C., 2022, MNRAS,
- Kim et al. (2003) Kim S., Staveley-Smith L., Dopita M. A., Sault R. J., Freeman K. C., Lee Y., Chu Y.-H., 2003, ApJS, 148, 473
- Klimek et al. (2010) Klimek M. D., Points S. D., Smith R. C., Shelton R. L., Williams R., 2010, ApJ, 725, 2281
- Kontizas et al. (1990) Kontizas M., Morgan D. H., Hatzidimitriou D., Kontizas E., 1990, A&AS, 84, 527
- Koribalski et al. (2021) Koribalski B. S., Norris R. P., Andernach H., Rudnick L., Shabala S., Filipović M., Lenc E., 2021, MNRAS, 505, L11
- Leahy (2017) Leahy D. A., 2017, ApJ, 837, 36
- Leahy et al. (2020) Leahy D. A., Ranasinghe S., Gelowitz M., 2020, ApJS, 248, 16
- Luken et al. (2020) Luken K. J., et al., 2020, MNRAS, 492, 2606
- Maggi (2021) Maggi P., 2021, in Filipović M. D., Tothill N. F. H., eds, 2514-3433, Multimessenger Astronomy in Practice. IOP Publishing, pp 6–1, doi:10.1088/2514-3433/ac2256ch6
- Maggi et al. (2016) Maggi P., et al., 2016, A&A, 585, A162
- Maggi et al. (2019) Maggi P., et al., 2019, A&A, 631, A127
- Maitra et al. (2019) Maitra C., et al., 2019, MNRAS, 490, 5494
- Maitra et al. (2021) Maitra C., Haberl F., Maggi P., Kavanagh P. J., Vasilopoulos G., Sasaki M., Filipović M. D., Udalski A., 2021, MNRAS, 504, 326
- Mathewson & Healey (1963) Mathewson D. S., Healey J. R., 1963, Nature, 199, 681
- Mathewson & Healey (1964) Mathewson D. S., Healey J. R., 1964, in Symposium International Astronomical Union; Kerr F. J., ed., Vol. 20, The Galaxy and the Magellanic Clouds. Cambridge University Press, p. 245
- Meaburn (1980) Meaburn J., 1980, MNRAS, 192, 365
- Meixner et al. (2006) Meixner M., et al., 2006, AJ, 132, 2268
- Moriguchi et al. (2005) Moriguchi Y., Tamura K., Tawara Y., Sasago H., Yamaoka K., Onishi T., Fukui Y., 2005, ApJ, 631, 947
- Norris et al. (2021) Norris R. P., et al., 2021, Publ. Astron. Soc. Australia, 38, e003
- Oey et al. (2002) Oey M. S., Groves B., Staveley-Smith L., Smith R. C., 2002, AJ, 123, 255
- Offringa et al. (2014) Offringa A. R., McKinley B., Hurley-Walker et al., 2014, MNRAS, 444, 606
- Park et al. (2012) Park S., Hughes J. P., Slane P. O., Burrows D. N., Lee J.-J., Mori K., 2012, ApJ, 748, 117
- Pavlović et al. (2018) Pavlović M. Z., Urošević D., Arbutina B., Orlando S., Maxted N., Filipović M. D., 2018, ApJ, 852, 84
- Pennock et al. (2021) Pennock C. M., et al., 2021, MNRAS, 506, 3540
- Pietrzyński et al. (2019) Pietrzyński G., et al., 2019, Nature, 567, 200
- Points et al. (2019) Points S. D., Long K. S., Winkler P. F., Blair W. P., 2019, ApJ, 887, 66
- Reynolds et al. (2012) Reynolds S. P., Gaensler B. M., Bocchino F., 2012, Space Science Reviews, 166, 231
- Sano et al. (2020) Sano H., et al., 2020, ApJ, 902, 53
- Sano et al. (2021a) Sano H., et al., 2021a, ApJ, 919, 123
- Sano et al. (2021b) Sano H., Suzuki H., Nobukawa K. K., Filipović M. D., Fukui Y., Moriya T. J., 2021b, ApJ, 923, 15
- Sano et al. (2022) Sano H., Yamaguchi H., Aruga M., Fukui Y., Tachihara K., Filipović M. D., Rowell G., 2022, ApJ, 933, 157
- Schneider et al. (2018) Schneider F. R. N., et al., 2018, Science, 359, 69
- Urošević (2020) Urošević D., 2020, Nature Astronomy, 4, 910
- Urošević (2022) Urošević D., 2022, PASP, 134, 061001
- Uyanıker et al. (2002) Uyanıker B., Reich W., Yar A., Kothes R., Fürst E., 2002, A&A, 389, L61
- Vink (2020) Vink J., 2020, Physics and Evolution of Supernova Remnants, doi:10.1007/978-3-030-55231-2.
- Ye et al. (1991) Ye T., Turtle A. J., Kennicutt R. C. J., 1991, MNRAS, 249, 722
- Yew et al. (2021) Yew M., et al., 2021, MNRAS, 500, 2336
- Zaritsky et al. (2004) Zaritsky D., Harris J., Thompson I. B., Grebel E. K., 2004, AJ, 128, 1606
Please note: Oxford University Press is not responsible for the content or functionality of any supporting materials supplied by the authors. Any queries (other than missing material) should be directed to the corresponding author for the article.
1Western Sydney University, Locked Bag 1797, Penrith South DC, NSW 2751, Australia
2Faculty of Engineering, Gifu University, 1-1 Yanagido, Gifu 501-1193, Japan
3Dublin Institute for Advanced Studies, Astronomy & Astrophysics Section, 31 Fitzwilliam Place, D02 XF86 Dublin 2, Ireland
4Center for Data Intensive and Time Domain Astronomy, Department of Physics and Astronomy, Michigan State University, East Lansing, MI 48824, USA
5Max-Planck-Institut für extraterrestrische Physik, Gießenbachstraße 1, D-85748 Garching, Germany
6Australian Astronomical Optics, AAO-Macquarie, Faculty of Science and Engineering, Macquarie University, 105 Delhi Rd, North Ryde, NSW 2113, Australia
7INAF – Osservatorio Astrofisico di Catania, via Santa Sofia 78, I-95123 Catania, Italia
8The Inter-University Institute for Data Intensive Astronomy (IDIA), Department of Astronomy, University of Cape Town, Rondebosch 7701, South Africa
9School of Cosmic Physics, Dublin Institute for Advanced Studies, 31 Fitzwilliam Place, Dublin 2, Ireland
10ATNF, CSIRO Space & Astronomy, PO Box 76, Epping, NSW 1710, Australia
11Dominion Radio Astrophysical Observatory, Herzberg Astronomy and Astrophysics, National Research Council Canada, PO Box 248, Penticton BC V2A 6J9, Canada
12Department of Physics and Astronomy, University of Calgary, University of Calgary, Calgary, Alberta, T2N 1N4, Canada
13Department of Physics, University of Crete, GR-70013 Heraklion, Greece; Institute of Astrophysics, FORTH, GR-71110 Heraklion, Greece
14Observatoire Astronomique de Strasbourg, Université de Strasbourg, CNRS, 11 rue de l’Université, F-67000 Strasbourg, France
15Lennard-Jones Laboratories, Keele University, Staffordshire ST5 5BG, UK
16Cerro Tololo Inter-American Observatory/NSF’s NOIRLab, Casilla 603, La Serena, Chile
17Observatory Hill Waitoki, 130 Dormer Rd, Helensville RD2, Auckland 0875, New Zealand
18School of Mathematical and Physical Sciences, Macquarie University, Sydney, NSW 2109, Australia
19School of Physical Sciences, The University of Adelaide, Adelaide 5005, Australia
20Dr. Karl Remeis Observatory, Erlangen Centre for Astroparticle Physics, Friedrich-Alexander-Universität Erlangen-Nürnberg, Sternwartstraße 7, 96049 Bamberg, Germany
21Department of Physics and Astronomy, University of Manitoba, Winnipeg, MB R3T 2N2, Canada
22Department of Astronomy, Faculty of Mathematics, University of Belgrade, Studentski trg 16, 11000 Belgrade, Serbia
23Isaac Newton Institute of Chile, Yugoslavia Branch
Appendix A Properties of 14 newly discovered LMC SNR candidates
We present the properties of each LMC remnant candidate detected in this study such as their extent, radio morphology, potential OB associations and counterpart emission at other wavelengths.
A.1 J0451–6906
The emission of this potential SNR from the ASKAP radio image appears as a faint shell morphology with slight rim brightening toward the western region (Figs. 4 and 7). The western rim of this emission also has elevated [Sii]/H (0.5), which helps push the case for the SNR candidate classification. Five of the 19 massive (OB) stars close to this candidate are positioned in the south/eastern rim of this tentative remnant. Its optical and radio boundaries are not obvious but our Hi and diagram shows evidence of a cavity-like structure typical of a SNR expanding inside this cavity.

A.2 J0451–6951
This source exhibits a circular shell morphology (Fig. 4 and 8). Its diameter, pc, is a typical size for the LMC SNR sample (where the average is 44.9 pc). 10 OB star candidates are located within 100 pc of the source, but none are located within the measured extent of the candidate. No obvious optical or X-ray emission was found.

A.3 J0452–6638
This SNR candidate exhibits a shell, which is brightest to the south and west (Figs. 4 and 9), with pc and a very low surface brightness. Its radio emission coincides with the optical extent as it brightens on the south-west limb. There are 29 OB star candidates within 100 pc of the source, with four of these located within the extent of the ring emission. Hi and diagram shows a cavity typical for SNR (Sano et al., 2020; Luken et al., 2020; Alsaberi et al., 2019).

A.4 J0457–6823
This SNR candidate exhibits an elongated structure that can be seen best in the south-west where the source is possibly colliding, overlapping or embedded in emission from a separate nearby source (Figs. 4 and 10). A faint extended source at this position was detected at soft X-ray energies by Haberl & Pietsch (1999); source number 655 in their catalogue ([HP99] 655). The X-ray existence likelihood is low, due to the large off-axis angle of the source during the ROSAT observation and better data are needed to confirm any association with the SNR candidate. There are 33 OB star candidates located within, or in close proximity to this source – seven of the eight located inside the bounds of the remnant are located in the south-western region where there is higher radio emission. The Hi map and diagram show the existence of a cavity but the [Sii]/H ratio of 0.35 does not strongly favour an SNR. Therefore, we classify this object as a low confidence SNR candidate.

A.5 J0459–7008b
The emission in this region is obfuscated by emission in the south from the massive superbubble N 186 (Oey et al., 2002). Located only 90 arcsec towards the east, the previously established MCSNR J0459–7008 (a.k.a. N 186D) with a diameter of 34.3 pc (Jaskot et al., 2011) is indicated by a bright shell in the centre left of Fig. 4. There appears to be an almost circular ring of emission (=43 pc) located to the west from the previously established SNR (Figs. 4 and 11). In addition, there are two more faint radio shells to the north and one to the south-east. The elevated [Sii]/H(0.7) and radio-to-H levels also have a SNR shell-type morphology covering the same general area. In a search for massive stars in the region, we find 44 OB star candidates with within the projected bounds of the region. Also, the Hi map and the diagram show a feature and possible cavity (see Fig. 11; Panel E). Finally, we note that SNR N 186D is very bright in [Oiii] while here proposed SNR candidate J0459–7008b is bright in [Sii]. This is good indication that we see two different SNR.

A.6 J0459–6757
This is the smallest SNR candidate in our sample having a diameter of 30 pc embedded in the massive Hii region N 16A. It has an elongated half-ring morphology, with the strongest emission seen toward the source’s southern boundary where it appears to be interacting with a gas cloud resulting in rim brightening (Figs. 4 and 12). While the radio-to-H ratio is only mildly enhanced, the [Sii]/H ratio is not elevated indicating the absence of radiative shocks. This is a very tentative candidate with more evidence shown by its optical properties. There are 18 OB star candidates located within, or in close proximity to this source but only one within the projected bounds. Both Hi map and diagram indicate the presence of a cavity, so we tentatively classify this object as SNR candidate.

A.7 J0504–6901
J0504–6901 is a potential remnant of an SN that exhibits a complex and large ( pc) shell-morphology with a brightened region just off-centre and another in the northern part (Figs. 4 and 13). It is placed in the larger region known as DEM L64 and originally was detected as a radio source (LMC B0504–6906) in Filipovic et al. (1995); Filipovic et al. (1996); Filipovic et al. (1998) Parkes surveys. They found step spectral index of =–1.20.4 which supports a non-thermal radio spectrum, hence possible SNR identification. However, at least one strong nearby radio source (J0503–6903) and a number of other fainter ones are within the large Parkes beams (ranging from 2.7 arcmin at 8640 MHz to 15.2 arcmin at 1400 MHz) and would significantly contribute the measured flux densities and therefore may not represent the true spectral index of this LMC source alone. Very strong elevation of the radio-to-H ratio warrants the SNR candidate classification even though no clear X-ray (due to a low exposure time and a large off-axis angle) or optical boundaries could be drawn. There are 72 OB star candidates located within, or in close proximity to this source, with 10 located inside the measured extent. Our Hi map and the diagram show a clear cavity in which this object may be expanding.
A.8 MCSNR J0522–6543
This candidate has a shell morphology with ring brightened regions in the north-east and south-west (Figs. 4, 14 and 15). It also has a dominant bright central source. The intriguing central position of this point-like source suggests the possible presence of a PWN, but we can not exclude a random background galaxy. This region was catalogued by Davies et al. (1976) and given the reference DEM L155A. They described the source as a bright diffuse circular region arcmin2, which is fractionally smaller than our diameter measurement of arcmin2. The MCELS image has an enhanced [Sii]/H ratio of just slightly above 0.4 in the sources north-east region. There are 15 OB star candidates located within, or in close proximity to this source with 7 inside the projected boundary and four of these just off centre. Also, some 18 arcsec from the centre is the well studied young star cluster KMHK 833 (Kontizas et al., 1990). MCSNR J0522–6543 shows clear evidence of expanding inside a cavity or bubble-like structure in the Hi map and the diagram. These Hi clouds are most likely associated with the SNR as they seems to be positioned along the edge of the somewhat larger expanding Hi bubble (see Fig. 14 panels D and E).
We measured flux densities (see Table 2) and obtained a spectral index of =–0.510.05 for MCSNR J0522–6543 and for the central bright point source we estimate =–1.040.04. These results indicate the spectral index is typical of LMC SNR (Bozzetto et al., 2017) while the central bright source is most likely an unrelated background object ( active galactic nucleus (AGN) or radio quasar). However, as discussed above (Section 3), missing short spacing may influence our flux densities estimates. This is especially true at the higher frequencies (ATCA; 5500 and 9000 MHz; Fig. 15) where our flux density measurements could be underestimated. Filipović et al. (2022) suggest these could be as much as 15–20 per cent (in flux density) which translates to a flattening of the spectral index by about 0.1 to –0.41. Nonetheless, this would still allow the spectral index for MCSNR J0522–6543 to remain in a range acceptable for SNR classification.
| MCSNR J0522–6543 | J052254.7–654311 | |
|---|---|---|
| (mJy) | 33.10.7 | 3.520.11 |
| (mJy) | 31.30.4 | 2.100.05 |
| (mJy) | 19.80.4 | 1.470.05 |
| (mJy) | 15.10.4 | 0.550.05 |
| (mJy) | 10.20.4 | 0.290.05 |
| –0.510.05 | –1.040.04 |
MCSNR J0522–6543 satisfies two out of three criteria (optical [Sii]/H0.4 and radio spectral index –0.5) to be a bona fide SNR. Future deep X-ray observations of this region may reveal more about the true nature of this source.


A.9 J0534–6720
This is the second largest candidate proposed in this study at pc and appears with a complex shell morphology that includes areas of enhanced emission around the rim (Figs. 4 and 16). The radio shell is most pronounced to the south. There is also noticeable radio emission towards the west and slightly beyond the presumed circular boundaries of this SNR candidate that might be an integral part of the object. Its pear-like appearance is reminiscent of the Galactic SNR Cygnus Loop, which might consist of two SNR (Uyanıker et al., 2002). There are 45 OB star candidates located within 100 pc of the source, but only one appears within the bounds of the emission. While the enhanced radio-to-H ratio shows a large ring-like shell, no real traces of radiative shocks are seen in any MCELS band. But, the Hi map and the diagram show a clear cavity structure at this position which warrants an SNR candidate classification. This object is therefore potentially an excellent example of an SNR expanding inside the large scale cavity of a (super)bubble.

A.10 J0534–6700
This faint and almost circular shell morphology source (Figs. 4 and 17) is located at the eastern end of the large LMC4 supergiant shell (Meaburn, 1980). There are 325 OB star candidates located within, or in close proximity to, this source. As for the number of other sources in our sample, we can see a clear cavity in our Hi and diagram. The absence of an optical detection is intriguing, but expected for this possible late evolutionary stage SNR.

A.11 J0542-6852
The radio emission of this candidate appears with a faint and slightly elongated shell-like morphology (Figs. 4 and 18). The remnant also appears to show faint X-ray emission in the soft and medium bands of XMM-Newton survey images as well as some filaments associated with [Oiii] emission. There are 40 OB star candidates located within, or in close proximity to this source. J0542-6852 has possibly two counterparts of wind bubbles in the diagram, but these spatial extents in declination are slightly offset from the SNR position. It is, therefore, possible that these two expanding bubbles are not from the SNR candidate, but were caused by other events such as past activities of nearby OB associations.

A.12 J0543–6928
This source exhibits a complex shell morphology elongated in the NW-SE direction (Figs. 4 and 19). It has a very strong enhancement in the radio-to-H ratio image which suggests the structure is non-thermal. However, no counterpart is seen in the MCELS, nor in our deep XMM-Newton images. There are 34 OB star candidates located within, or in close proximity to, this source, though, only one of these lies in the bounds of the emission.

A.13 J0543–6923
Emission from this source follows a ring morphology (Figs. 4 and 20). Brightening in our radio/H/IR image (panel B of Fig. 20) can be seen in the north and east where the source appears to be colliding with emission from the Hi cloud (panel E of Fig. 20). Indeed, our diagram shows a clear cavity where this SNR candidate may be expanding. There are 31 OB star candidates located within, or in close proximity to, this source. However, only one is within the bounds of the emission – located at an area of brightening in the north-east. We note a significant amount of possible non-thermal radio emission beyond the proposed boundaries (east) of this SNR candidate. While we cannot exclude the association of these regions with the proposed remnant J0543–6923, we suggest it could be part of a larger and non-related (super)bubble structure.

A.14 J0543–6906
This source is the largest in our study ( pc) and exhibits a ring-like morphology with significant brightening on the western rim (Figs. 4 and 21). While there are a large number of optical filaments across this region, we cannot associate any of them with this potentially largest SNR candidate in our sample. Unfortunately, our XMM-Newton images of this region are not sensitive enough to clearly confirm its nature. There are 50 OB star candidates located within, or in close proximity to this source, with eight inside the measured extent of emission. J0543–6906 is likely located in the large wind-(super)bubble that was formed by massive star cluster(s); its size is significantly larger than that of a single supernova.
