Neural Option Pricing for Rough Bergomi Model
Abstract
The rough Bergomi (rBergomi) model can accurately describe the historical and implied volatilities, and has gained much attention in the past few years. However, there are many hidden unknown parameters or even functions in the model. In this work we investigate the potential of learning the forward variance curve in the rBergomi model using a neural SDE. To construct an efficient solver for the neural SDE, we propose a novel numerical scheme for simulating the volatility process using the modified summation of exponentials. Using the Wasserstein 1-distance to define the loss function, we show that the learned forward variance curve is capable of calibrating the price process of the underlying asset and the price of the European style options simultaneously. Several numerical tests are provided to demonstrate its performance.
1 Introduction
Empirical studies of a wild range of assets volatility time-series show that the log-volatility in practice behaves similarly to fractional Brownian motion (FBM) (FBM with a Hurst index is the unique centered Gaussian process with autocorrelation being ) with a Hurst index at any reasonable time scale [8]. Motivated by this empirical observation, several rough stochastic volatility models have been proposed, all of which are essentially based on fBM and involve the fractional kernel. The rough Bergomi (rBergomi) model [3] is one recent rough volatility model that has a remarkable capability of fitting both historical and implied volatilities.
The rBergomi model can be formulated as follows. Let be the price of underlying asset with the time horizon defined on a given filtered probability space , with being a risk-neutral martingale measure:
| (1) |
Here, is the spot variance process satisfying
| (2) |
denotes the initial value of the underlying asset, and the parameter is defined by
with being the ratio between the increment of and the FBM over [3, Equation (2.1)].
The Hurst index reflects the regularity of the volatility . is the so-called initial forward variance curve, defined by [3]. is a standard Brownian motion:
| (3) |
Here, is the correlation parameter and is a standard Brownian motion independent of . The price of a European option with payoff function and expiry is given by
| (4) |
Despite its significance from a modeling perspective, using a singular kernel in the rBergomi model leads to the loss of Markovian and semimartingale structure. In practice, simulating and pricing options using this model involves several challenges. The primary difficulty arises from the singularity of the fractional kernel
| (5) |
at , which impacts the simulation of the Volterra process given by:
| (6) |
Note that this Volterra process is a Riemann-Liouville FBM or Lévy’s definition of FBM up to a multiplicative constant [18]. The deterministic nature of the kernel implies that is a centered, locally -Hölder continuous Gaussian process with . Furthermore, a straightforward calculation shows
where for , the univariate function is given by
indicating that is non-stationary.
Even though the rBergomi model enjoys remarkable calibration capability with the market data, there are many hidden unknown parameters even functions. For example, the Hurst exponent (in a general SDE) is regarded as an unknown function parameterized by a neural network in [21], which is learned using neural SDEs. According to [3], can be any given initial forward variance swap curve consistent with the market price. In view of this fact and the high expressivity of neural SDEs [22, 23, 16, 14, 17, 10, 9], in this work, we propose to parameterize the initial forward variance curve using a feedforward neural network:
| (7) |
where represents the weight parameter vector of the neural network. The training data are generated via a suitable numerical scheme for a given target initial forward variance curve .
Motivated by the implementation in [7], we adopt the Wasserstein metric as the loss function to train the weights . Since the Wasserstein loss is convex and has a unique global minima, any SDE maybe learnt in the infinite data limit [13]. Remarkably, the attained Wasserstein-1 distance during the training is a natural upper bound for the discrepancy between the exact option price and the learned option price given by the neural SDE. This in particular implies that if the approximation of the underlying dynamics of stock price is accurate to some level, then the European option price with this stock as the underlying asset will be accurate to the same level. In this manner, the loss can realize two optimization goals simultaneously.
To generate the training data to learn , we need to jointly simulate the Volterra process and the underlying Brownian motion for the stock price. The non-stationarity feature and the joint simulation requirement make Cholesky factorization [3] the only available exact method. However, it has an complexity for the Cholesky factorization, complexity and storage with being the total number of time steps. Clearly, the method is infeasible for large . The most well known method to reduce the computational complexity and storage cost is the hybrid scheme [4]. The hybrid scheme approximates the kernel by a power function near zero and by a step function elsewhere, which yields an approximation combining the Wiener integrals of the power function with a Riemann sum. Since the fractional kernel is a power function, it is exact near zero. Its computational complexity is and storage cost is .
In this work, we propose an efficient modified summation of exponentials (mSOE) based method (16) to simulate (1)-(2) (to facilitate the training of the neural SDE). Similar approximations have already been considered, e.g. by Bayer and Breneis [2], and Abi Jaber and El Euch [1]. We further enhance the numerical performance by keeping the kernel exact near the singularity, which achieves high accuracy with the fewest number of summation terms. Numerical experiments show that the mSOE scheme considerably improve the prevalent hybrid scheme [4] in terms of accuracy, while having less computational and storage costs. Besides the rBergomi model, the proposed approach is applicable to a wide class of stochastic volatility models, especially the rough volatility models with completely monotone kernels.
In sum, the contributions of this work are three-fold. First, we derive an efficient modified sum-of-exponentials (mSOE) based method (16) to solve (1)-(2) even with very small Hurst parameter . Second, we propose to learn the forward variance curve by the neural SDE using the loss function based on the Wasserstein 1-distance, which can learn the underlying dynamics of the stock price as well as the European option price. Third and last, the mSOE scheme is further utilized to obtain the training data to train our proposed neural SDE model and serves as the solver for the neural SDE, which improves the efficiency significantly.
The remaining of the paper is organized as follows. In Section 2, we introduce an approximation of the singular kernel by the mSOE, and then describe two approaches for obtaining them. Based on the mSOE, we propose a numerical scheme for simulating the rBergomi model (1)-(2). We introduce in Section 3 the neural SDE model and describe the training of the model. We illustrate in Section 4 the numerical performance of the mSOE scheme. Moreover, several numerical experiments on the performance of our neural SDE model are shown for different target initial forward variance curves. Finally, we summarize the main findings in Section 5.
2 Simulation of the rBergomi model
In this section, we develop an mSOE scheme for efficiently simulating the rBergomi model (1)-(2). Throughout, we consider an equidistant temporal grid with a time stepping size and .
2.1 Modified SOE based numerical scheme
The non-Markovian nature of the Gaussian process in (6) poses multiple theoretical and numerical challenges. A tractable and flexible Markovian approximation is highly desirable. By the well-known Bernstein’s theorem [25], a completely monotone function (i.e., functions that satisfy for all and ) can be represented as the Laplace transform of a nonnegative measure. We apply this result to the fractional kernel and obtain
| (8) |
where , with . denotes Euler’s gamma function, defined by for . That is, is an infinite mixture of exponentials.
The stochastic Fubini theorem implies
| (9) |
Note that for any fixed , is an Ornstein-Uhlenbeck process with parameter , solving the SDE starting from the origin. Therefore, is a linear functional of the infinite-dimensional process [6]. We propose to simulate exactly near and apply numerical quadrature to (8) elsewhere to enhance the computational efficiency, and refer the resulting method to as the modified SOE (mSOE) scheme.
Summation of exponentials can be utilized to approximate the completely monotone functions . This assumption covers most non-negative, non-increasing and smooth functions and is less restrictive than the requirement on the hybrid scheme [20].
Remark 1.
For the truncated Brownian semistationary process of the form , the hybrid scheme requires that the kernel to satisfy the following two conditions: (a) There exists an satisfying for any and the derivative satisfying for such that
(b) is differentiable on .
Condition (a) implies that does not allow for strong singularity near the origin such that it can be well approximated by a certain power function. However, the rough fractional kernel with fails to satisfy this assumption.
Common examples of completely monotone functions are the exponential kernel , the rough fractional kernel with and and the shifted power law-kernel with . More flexible kernels can be constructed from these building blocks as complete monotonicity is preserved by summation and products [19, Theorem 1]. The approximation property of the summation of exponentials is guaranteed by the following theorem.
Theorem 2.1 ([5, Theorem 3.4]).
Let be completely monotone and analytic for , and let . Then there exists a uniform approximation on the interval such that
Here, , and , with .
The proposed mSOE scheme relies on replacing the kernel by , which is defined by
| (10) |
for certain non-negative paired sequence , where ’s are the interpolation points (nodes) and ’s are the corresponding weights. This scheme is also referred to as the mSOE- scheme below. By replacing with in (5), we derive the associated approximation for ,
| (11) |
Then the Itô isometry implies
| (12) |
This indicates that we only need to choose non-negative paired sequence which minimize in order to obtain a good approximation of in the sense of pointwise mean square error. Next, we describe two known approaches to obtain the non-negative paired sequence in (10). Both are essentially based on Gauss quadrature.
Summation of exponentials: approach A
Approach A in [2] applies -point Gauss-Jacobi quadrature with weight function to geometrically spaced intervals and uses a Riemann-type approximation on the interval . The resulting approximator with number of summations is given by
where and . Let be the prespecified total number of nodes. The parameters , and are computed based on a set of parameters as follows.
The following lemma gives the approximation error of the above Gaussian quadrature, which is a modification of [2, lemmas 2.8 and 2.9].
Lemma 2.1.
Let be the weights and be the nodes of Gaussian quadrature on the intervals computed on the set of parameters . Then the following error estimates hold
Summation of exponentials: approach B
Approach B in [11] approximates the kernel efficiently on the interval with the desired precision . It applies -point Gauss-Jacobi quadrature on the interval with the weight function where , ; -point Gauss-Legendre quadrature on small intervals , , where , and -point Gauss-Legendre quadrature on large intervals , , where , [11, Theorem 2.1]. The resulting approximation reads,
| (13) |
where the terms could be absorbed into the corresponding s so that the approximation is in the form of (10). There holds . For further optimization, a modified Prony’s method is applied on the interval and standard model reduction method is applied on to reduce the number of exponentials needed.
The approximation error is given below, which is a slight modification of [11, Lemmas 2.2, 2.3 and 2.4].
Lemma 2.2.
Let , and follow the settings in (13). Then the following error estimates hold
We shall compare Approaches A and B in Section 4, the result shows that Approach B outperforms Approach A. We present in Table 1 the parameter pairs for and . See [12, Section 3.4] for further discussions about SOE approximations for the fractional kernel .
| 1 | 0.26118 | 0.47726 | 11 | 1.28121 | 1.92749 |
| 2 | 0.19002 | 0.22777 | 12 | 1.76098 | 40.38675 |
| 3 | 0.13840 | 0.108690 | 13 | 2.42043 | 84.62266 |
| 4 | 0.10717 | 5.11098 | 14 | 3.32681 | 177.31051 |
| 5 | 0.11366 | 1.93668 | 15 | 4.57262 | 371.52005 |
| 6 | 0.14757 | 2.04153 | 16 | 6.28495 | 778.44877 |
| 7 | 0.35898 | 1 | 17 | 8.63850 | 1631.08960 |
| 8 | 0.49341 | 2.09531 | 18 | 11.87339 | 3417.63439 |
| 9 | 0.67818 | 4.390310 | 19 | 16.31967 | 7160.99521 |
| 10 | 0.93214 | 9.19906 | 20 | 22.43096 | 15004.4875 |
2.2 Numerical method based on mSOE scheme
Next we describe a numerical method to simulate for based on the mSOE scheme (11). Recall that the integral (6) can be written into a summation of the local part and the history part
| (14) | ||||
The local part can be simulated exactly. The history part is approximated by replacing the kernel by the mSOE (by approach B):
Then direct computation leads to
Consequently, we obtain the recurrent formula for each history component
| (15) |
This, together with (14), implies that we need to simulate a centered -dimensional Gaussian random vector at ,
Here, denotes the increment. Note that is determined by its covariance matrix , which is defined
for , where refers to the lower incomplete gamma function. We only need to inplement the Cholesky decomposition once since is independent of .
Finally, we present the two-step numerical scheme for for ,
| (16) | ||||
This mSOE-N based simulation scheme (16) only requires offline computation complexity which accounts for the Cholesky decomposition of the covariance matrix , computation complexity and storage.
3 Learning the forward variance curve
This section is concerned with learning the forward variance curve with being the weight parameters from the feedforward neural network (7) by Neural SDE. Without loss of generality, assuming , we can rewrite (1)-(2) as
| (17) |
Upon parameterizing the forward variance curve by (7), the dynamics of the price process and variance process are also parameterized accordingly, which is given by the following neural SDE
| (18) |
where denotes the (Wick) stochastic exponential. Then we propose to use the Wasserstein-1 distance as the loss function to train this neural SDE. That is, the learned weight parameters are given by
| (19) |
Next, we recall the Wasserstein distance. Let be a Radon space. The Wasserstein- distance for between two probability measures and on with finite -moments is defined by
where is the set of all couplings of and . A coupling is a joint probability measure on whose marginals are and on the first and second factors, respectively. If and are real-valued, then their Wasserstein distance can be simply computed by utilising their cumulative distribution functions [24]:
In particular, when , according to the Kantorovich-Robenstein duality [24], Wasserstein-1 distance can be represented by
| (20) |
where denotes the Lipschitz constant of .
In the experiment, we work with the empirical distributions on . If and are two empirical measures with samples and , then the Wasserstein- distance is given by
| (21) |
where is the th smallest value among the samples. With being the price process of the underlying asset after training, the price of a European option with payoff function and expiry is given by
| (22) |
Since the payoff function is clearly Lipschitz-1 continuous, according to (20), Wasserstein-1 distance is a natural upper bound for the pricing error of the rBergomi model. Thus, the choice of the training loss is highly desirable.
Proposition 3.1.
Set the interest rate , the Wasserstein-1 distance is a natural upper bound for the pricing error of the rBergomi model:
| (23) |
4 Numerical tests
In this section, we illustrate the performance of the proposed mSOE scheme (16) for simulating (1)-(2), and demonstrate the learning of the forward variance curve (7) using neural SDE (18).
4.1 Numerical test for mSOE scheme (16)
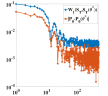
First we compare approaches A and B. They only differ in the choice of nodes and weights . To compare their performance in the simulation of the stochastic Volterra process , one only needs to estimate the discrepancy between and in -norm (12). Thus, as the criterion for comparison, we use . We show in Figure 1(a) the err versus the number of nodes for approaches A and B with . We observe that approach B has a better error decay. This behavior is also observed for other . Thus, we implement approach B in (10), which involves computational cost to obtain the non-negative tuples .


Next we calculate the implied volatility curves using the mSOE- based numerical schemes with using the parameters listed in Table 2. To ensure that the temporal discretization error and the Monte Carlo simulation error are negligible, we take the number of temporal steps and the number of samples . The resulting implied volatility curves are shown in Figure 2, which are solved via the Newton-Raphson method. We compare the proposed mSOE scheme with the exact method, i.e., Cholesky decomposition, and the hybrid scheme. We observe that mSOE-4 scheme can already accurately approximate the implied volatility curves given by the exact method. This clearly shows the high efficiency of the proposed mSOE based scheme for simulating the implied volatility curves.
| 1 | 1.9 | 0.07 | -0.9 |


Next, we depict in Figure 3 the root mean squared error (RMSE) of the first moment and second moment of the following Gaussian random variable using the same set of parameters,
The RMSEs are defined by
| RMSE 1st moment | |||
| RMSE 2nd moment |
where is the approximation of under the mSOE-N scheme or the hybrid scheme. These quantities characterize the fundamental statistical feature of the distribution. We observe that the mSOE- based numerical scheme achieves high accuracy for the number of terms , again clearly showing the high efficiency of the proposed scheme.


4.2 Numerical performance for learning the forward variance curve
Now we validate (23) using three examples of ground truth forward variance curves:
| (24a) | |||
| (24b) | |||
| (24c) | |||
The first example (24a) corresponds to a constant forward variance curve. The second example (24b) takes a scaled sample path of Brownian motion as the forward variance curve, and the third example (24c) utilises a scaled path of fractional Brownian motion as the forward variance curve.
The initial forward variance curve is parameterized by a feed forward neural network, cf. (7), which has 3 hidden layers, width 100, and leaky ReLU activations; see Fig. 4 for a schematic illustration. The weights of each model were carefully initialized in order to prevent gradient vanishing.
To generate the training data, we use the stock price samples generated by the scheme (16). The total number of samples used in the experiments is . Training of the neural network was performed on the first of the dataset and the model’s performance was evaluated on the remaining of the dataset. Each sample is of length 2000, which is the number of discretized time intervals. The batch size was 4096, which was picked as large as possible that the GPU memory allowed for. Each model was trained for 100 epochs. We consider Wasserstein-1 distance as loss metric by applying (21) to the empirical distributions on batches of data at the final time grid of the samples.
The neural SDEs were trained using Adam [15]. The learning rate was taken to be , which was then gradually reduced until a good performance was achieved. The training was performed on a Linux server and a NVIDIA RTX6000 GPU and takes a few hours for each experiment. in (18) was solved by the mSOE scheme to reduce the computational complexity, then was solved using the Euler-Maruyama method. The example code for dataset sampling and network training will be made available at the Github repository https://github.com/evergreen1002/Neural-option-pricing-for-rBergomi-model.
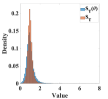
Now we present the numerical results for the learned forward variance curves in Figure 5. These three rows correspond to three different initial forward variance curves defined in (24a), (24b) and (24c) used for neural network training, respectively. The first two columns display the empirical distributions and the corresponding European call option prices for the test set against a number of strikes before training has begun. The next two columns display and after training. It is observed that and closely match the exact one on the test set, thereby showing the high accuracy of learning the rBergomi model. The last column shows the Wasserstein-1 distance at time compared to the maximum error in the option price over each batch during training. These two quantities are precisely the subjects in (23). Only the first iterations were plotted. In all cases, the training loss can be reduced to an acceptable level, so is the error of pricing, clearly indicating the feasibility of learning within the rBergomi model. Finally, we investigate whether the training loss can be further reduced after more iterations for the first example (24a). Figure 1(b) shows the training loss against the number of iterations. Gradient descent is applied with learning rate . We observe that the training loss is oscillating near 0.05 even after 100,000 iterations. Indeed, the oscillation of the loss values aggravates as the iteration further proceeds, indicating the necessity for early stopping of the training process.


5 Conclusion
In this work, we have proposed a novel neural network based SDE model to learn the forward variance curve for the rough Bergomi model. We propose a new modified summation of exponentials (mSOE) scheme to improve the efficiency of generating training data and facilitating the training process. We have utilized the Wasserstein 1-distance as the loss function to calibrate the dynamics of the underlying assets and the price of the European options simultaneously. Furthermore, several numerical experiments are provided to demonstrate their performances, which clearly show the feasibility of neural networks for calibrating these models. Future work includes learning all the unknown functions in the rBergomi model (as well as other rough volatility models) by the proposed approach, using the market data instead of the simulated data as in the present work.
References
- [1] E. Abi Jaber and O. El Euch. Multifactor approximation of rough volatility models. SIAM Journal on Financial Mathematics, 10(2):309–349, 2019.
- [2] C. Bayer and S. Breneis. Markovian approximations of stochastic Volterra equations with the fractional kernel. Quantitative Finance, 23(1):53–70, 2023.
- [3] C. Bayer, P. Friz, and J. Gatheral. Pricing under rough volatility. Quantitative Finance, 16(6):887–904, 2016.
- [4] M. Bennedsen, A. Lunde, and M. S. Pakkanen. Hybrid scheme for Brownian semistationary processes. Finance and Stochastics, 21:931–965, 2017.
- [5] D. Braess. Nonlinear approximation theory. Springer Science & Business Media, 2012.
- [6] L. Coutin and P. Carmona. Fractional Brownian motion and the Markov property. Electronic Communications in Probability, 3:12, 1998.
- [7] T. DeLise. Neural options pricing. Preprint, arXiv:2105.13320, 2021.
- [8] J. Gatheral, T. Jaisson, and M. Rosenbaum. Volatility is rough. In Commodities, pages 659–690. Chapman and Hall/CRC, 2022.
- [9] L. Hodgkinson, C. van der Heide, F. Roosta, and M. W. Mahoney. Stochastic normalizing flows. arXiv preprint arXiv:2002.09547, 2020.
- [10] J. Jia and A. R. Benson. Neural jump stochastic differential equations. In Advances in Neural Information Processing Systems, volume 32, 2019.
- [11] S. Jiang, J. Zhang, Q. Zhang, and Z. Zhang. Fast evaluation of the Caputo fractional derivative and its applications to fractional diffusion equations. Communications in Computational Physics, 21(3):650–678, 2017.
- [12] B. Jin and Z. Zhou. Numerical Treatment and Analysis of Time-Fractional Evolution Equations, volume 214 of Applied Mathematical Sciences. Springer, Cham, 2023.
- [13] P. Kidger, J. Foster, X. Li, and T. J. Lyons. Neural SDEs as infinite-dimensional GANs. In International conference on machine learning, pages 5453–5463. PMLR, 2021.
- [14] P. Kidger, J. Foster, X. C. Li, and T. Lyons. Efficient and accurate gradients for neural SDEs. In Advances in Neural Information Processing Systems, volume 34, pages 18747–18761, 2021.
- [15] D. P. Kingma and J. Ba. Adam: A method for stochastic optimization. In 3rd International Conference for Learning Representations, San Diego, 2015.
- [16] X. Li, T.-K. L. Wong, R. T. Chen, and D. Duvenaud. Scalable gradients for stochastic differential equations. In International Conference on Artificial Intelligence and Statistics, pages 3870–3882. PMLR, 2020.
- [17] X. Liu, T. Xiao, S. Si, Q. Cao, S. Kumar, and C.-J. Hsieh. Neural SDE: Stabilizing neural ODE networks with stochastic noise. arXiv preprint arXiv:1906.02355, 2019.
- [18] B. B. Mandelbrot and J. W. Van Ness. Fractional Brownian motions, fractional noises and applications. SIAM Review, 10(4):422–437, 1968.
- [19] K. S. Miller and S. G. Samko. Completely monotonic functions. Integral Transforms and Special Functions, 12(4):389–402, 2001.
- [20] S. E. Rømer. Hybrid multifactor scheme for stochastic volterra equations with completely monotone kernels. Available at SSRN 3706253, 2022.
- [21] A. Tong, T. Nguyen-Tang, T. Tran, and J. Choi. Learning fractional white noises in neural stochastic differential equations. In Advances in Neural Information Processing Systems, volume 35, pages 37660–37675, 2022.
- [22] B. Tzen and M. Raginsky. Neural stochastic differential equations: Deep latent gaussian models in the diffusion limit. arXiv preprint arXiv:1905.09883, 2019.
- [23] B. Tzen and M. Raginsky. Theoretical guarantees for sampling and inference in generative models with latent diffusions. In Conference on Learning Theory, pages 3084–3114. PMLR, 2019.
- [24] C. Villani. Topics in optimal transportation. American Mathematical Soc., Providence, 2021.
- [25] D. V. Widder. The Laplace Transform, volume vol. 6 of Princeton Mathematical Series. Princeton University Press, Princeton, NJ, 1941.