Multi-wavelength observations of the obscuring wind in the radio-quiet quasar MR 2251-178
Abstract
Obscuring winds driven away from active supermassive black holes are rarely seen due to their transient nature. They have been observed with multi-wavelength observations in a few Seyfert 1 galaxies and one broad absorption line radio-quiet quasar so far. An X-ray obscuration event in MR 2251-178 was caught in late 2020, which triggered multi-wavelength (NIR to X-ray) observations targeting this radio-quiet quasar. In the X-ray band, the obscurer leads to a flux drop in the soft X-ray band from late 2020 to early 2021. X-ray obscuration events might have a quasi-period of two decades considering earlier events in 1980 and 1996. In the UV band, a forest of weak blueshifted absorption features emerged in the blue wing of Ly in late 2020. Our XMM-Newton, NuSTAR, and HST/COS observations are obtained simultaneously, hence, the transient X-ray obscuration event is expected to account for the UV outflow, although they are not necessarily caused by the same part of the wind. Both blueshifted and redshifted absorption features were found for He i , but no previous NIR spectra are available for comparison. The X-ray observational features of MR 2251-178 shared similarities with some other type 1 AGNs with obscuring wind. However, observational features in the UV to NIR bands are distinctly different from those seen in other AGN with obscuring winds. A general understanding of the observational variety and the nature of obscuring wind is still lacking.
1 Introduction
At the center of almost all galaxies, there is a supermassive black hole (Netzer, 2015). Active Galactic Nuclei (AGN) are the observed manifestation of the inflow of matter onto supermassive black holes. The textbook anatomy of an AGN not only includes a supermassive black hole fed by an accretion disk but also clouds in the broad- and narrow-line regions, as well as the dusty torus (Antonucci, 1993). Clouds in the broad- and narrow-line regions account for the broad (with a typical velocity width ) and narrow () emission lines observed in the optical spectra (Padovani et al., 2017).
Ionized winds driven away from black holes have also been observed (Crenshaw et al., 2003; Tombesi et al., 2013; Kaastra et al., 2014), which might be another key element to be included in the textbook anatomy of AGN (Antonucci, 1993). These ionized winds are thought to play an important role in the evolution of black holes and their host galaxies (Laha et al., 2021). In the X-ray band, three types of ionized winds have been observed so far: warm absorbers, ultrafast outflows, and obscurers. The classical warm absorbers are identified with multiple narrow absorption lines with a typical outflow velocity of (Crenshaw et al., 2003). Ultrafast outflows are mainly inferred from the absorption features of highly ionized Fe xxvi and/or Fe xxv in the hard X-ray band (e.g., Reeves et al., 2003; Tombesi et al., 2013; Parker et al., 2017). The outflow velocity of ultrafast outflows can reach up to about a third of the speed of light (). Obscuring winds have outflow velocities up to (Kaastra et al., 2014; Mehdipour et al., 2017), larger than that of the warm absorber but smaller than that of ultrafast outflows. The outflow velocities are currently measured through discrete blueshifted absorption features in the UV band during the soft X-ray obscuration period, where the soft X-ray flux are significantly lowered with no discrete absorption features observable with current instruments (Mao et al., 2022). Furthermore, ultrafast outflows occupy the high column density and ionization parameter () part of the parameter space, while warm absorbers occupy the other side of the parameter space. Obscuring winds are in between, overlapping more with the warm absorber.
In the past few years, transient obscuring winds have been reported with multi-wavelength observations in a few nearby () Seyfert galaxies: NGC 5548 (Kaastra et al., 2014), NGC 985 (Ebrero et al., 2016), NGC 3783 (Mehdipour et al., 2017; Kaastra et al., 2018b), Mrk 335 (Longinotti et al., 2013, 2019), Mrk 817 (Miller et al., 2021; Kara et al., 2021), and NGC 3227 (Mehdipour et al., 2021; Mao et al., 2022). In addition, obscuring winds were also inferred from archival joint X-ray and UV observations of the broad absorption line (BAL) quasar PG 2112+059 at (Saez et al., 2021). The duration of the obscuration varies from hours (e.g., NGC 3227, Wang et al., 2022) to years (e.g., NGC 5548, Mehdipour et al., 2016b). During the obscuration period, the wind properties (e.g., the line-of-sight hydrogen column density, ionization parameter, and covering factor) can also change over time (De Rosa et al., 2015; Mehdipour et al., 2016b; Cappi et al., 2016). In UV grating spectra, the obscurers might leave their fingerprints as blueshifted broad absorption troughs in the blue wing of prominent broad emission lines like Ly and C iv (e.g., Kriss et al., 2019a). For the long-lasting obscurer in NGC 5548, a blueshifted broad absorption trough of He i* was observed in the NIR (Landt et al., 2019; Wildy et al., 2021). The obscurers are also expected to screen photons from the central engine to the distant narrow-line region (Kaastra et al., 2014; Mehdipour et al., 2017). This shielding effect (Proga & Kallman, 2004) can give rise to the emergence of low-ionization narrow absorption lines in the UV and NIR bands (Arav et al., 2015; Kriss et al., 2019a; Wildy et al., 2021).
Obscurers might contribute to the weakening and disappearance of broad emission lines if the obscuration effect is not limited to our line-of-sight. For NGC 5548, a “broad-line holiday” (from April to July 2014) was discovered (Goad et al., 2016), where broad emission lines of highly-ionized species like C iv decorrelate from the variations of the FUV continuum. From the theoretical perspective, Dehghanian et al. (2019a, b) suggest that a dense wind with its base extended down to the accretion disk might provide the physical explanation of the “broad-line holiday”, as well as the aforementioned UV and X-ray spectral features observed in NGC 5548. Moreover, if the wind is adequately dense, even the “changing-look” behavior of some AGN might be explained (Dehghanian et al., 2019b). For Mrk 817, in a period of 55 days in late 2020, when the target was heavily obscured, the UV continuum and the UV broad emission line variability decoupled (Kara et al., 2021).
MR 2251-178 is the X-ray brightest radio-quiet quasar (Cooke et al., 1978; Ricker et al., 1978). It has a black hole mass of (Lira et al., 2011) and is at (Beckmann et al., 2006). By comparing two X-ray spectra observed with the Einstein Observatory in 1979 and 1980, Halpern (1984) noticed an increase in the absorbing column density by a large factor over the yr interval. Using Rossi X-ray Timing Explorer (RXTE) data from 1996 to 2012, Markowitz et al. (2014) also identified a clear obscuration event in 1996. Here, we present another obscuration event in MR 2251-178 in late 2020 caught with multi-wavelength observations, including a Swift monitoring campaign, coordinated observations with Hubble Space Telescope (HST), XMM-Newton, and NuSTAR on 2020-12-16, and NIR and optical spectroscopy using NASA’s Infrared Telescope Facility, Gemini, Keck, and Palomar from September to December 2020.
| Observatory | Date | Note (e.g., ObsIDs and duration) |
|---|---|---|
| Palomar/TriSpec | 2020-12-22 | Å (0.3 ks) |
| NuSTAR | 2020-12-16 | 90601637002 (25 ks) |
| XMM-Newton | 2020-12-16 | 0872390801 (50 ks) |
| HST/COS | 2020-12-16 | LEHV010 (1.2 ks) |
| Palomar/DBSP | 2020-12-11 | Å (0.3 ks) |
| Keck/LRIS | 2020-10-18 | Å + Å (0.3 ks) |
| Gemini/GNIRS | 2020-09-30 | GN-2020B-FT-111, Å (3.6 ks) |
| IRTF/SpeX | 2020-09-06 | Å(7.2 ks) |
| HST/COS | 2011-09-29 | LBGB030 (10.0 ks) |
| XMM-Newton | 2002-05-18 | 0012940101 (65 ks) |
| FUSE | 2001-06-20 | P1111010000 (52 ks) |
| HST/FOS | 1996-08-02 | Y3AI200 (6.8 ks) |
2 Observations and data reduction
Apart from the archival Swift observations from 2014-01-09 to 2021-05-10, NIR to X-ray observations used in the present work are provided in Table 1. In the same table, some archival observations are also included for comparison purposes. Note that MR 2251-178 was put in the spotlight by Chandra (in coordination with HST/COS) and XMM-Newton (about one month after the Chandra observations) in 2011. The high-quality X-ray data were analyzed extensively in Reeves et al. (2013, for Chandra) and Nardini et al. (2014, for XMM-Newton). We do not include these observations in this work because our main focus is the transient obscuring wind observed in late 2020 with multi-wavelength observing facilities. We do not find obscuring winds in the 2011 X-ray (and UV) data, where the broadband continuum level was much higher than those in 2002 and 2020.
2.1 Swift
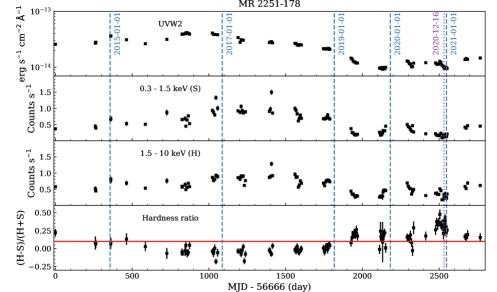
The Neil Gehrels Swift Observatory (Gehrels et al., 2004) provides the most efficient way to track the long-term variation of the X-ray and UV flux of AGN. The X-ray flux was provided by the X-ray telescope (XRT, Burrows et al., 2005) operating in imaging photon counting (PC) mode. The soft ( keV) and hard ( keV) band flux were obtained with the online XRT pipeline (Evans et al., 2009). The UV flux was covered by the UltraViolet and Optical Telescope (UVOT, Roming et al., 2005). The UVW2 (centered around 1928 Å) flux, which historically has shown the strongest UV variability, was used here. The uvotsource tool was used to perform aperture photometry.
The obscurer can absorb a large fraction of the soft X-ray flux, thus, leading to an elevated X-ray hardness ratio. Simultaneous UV and X-ray data enable us to distinguish variability caused by an obscurer from that of the AGN continuum (e.g., Mehdipour et al., 2016b, 2017, 2022b).
For MR 2251-178, archival Swift observations date back to 2014-01-09 (Figure 1). Since the summer of 2020, the Swift X-ray hardness ratio has been gradually increasing (Figure 2). Therefore, we requested multi-wavelength spectroscopic observations of MR 2251-178 with facilities on the ground and in space from September to December 2020, including a coordinated campaign with XMM-Newton, HST/COS, and NuSTAR on 2020-12-16, to confirm the obscuration event and to study the nature of the obscuring material. The Swift X-ray hardness ratio of MR 2251-178 remained at a relatively high level up to 2021-01-05. The target was out of visibility between January and April 2021. In May 2021, the hardness ratios returned to the historical average value.

2.2 XMM-Newton
XMM-Newton (Jansen et al., 2001) observations provide high-quality X-ray spectra in the energy band of keV. The Reflection Grating Spectrometer (RGS, den Herder et al., 2001) provides high-resolution soft X-ray spectra below 2 keV, which can reveal discrete emission and absorption features. The positive-negative junction (pn) CCD (charge-coupled device) camera of the European Photon Imaging Camera (EPIC) instrument can cover hard X-ray spectra in the keV energy band. Adding EPIC/MOS data does not significantly increase the statistics and will complicate the analysis due to cross-calibration among different instruments. We used the XMM-Newton Science Analysis Software (SAS) v19.0 for data reduction following standard procedures. We also include an XMM-Newton observation of MR 2251-178 obtained on 2002-05-18 (observation ID: 0012940101) for comparison purposes. Both Å RGS data and keV EPIC/pn data were used for spectral analysis (Sect. 3). To correct for the cross-calibration between RGS and EPIC-pn spectra, the latter were re-scaled by a factor of 0.950 (2002) and 0.966 (2020) to match the flux level in the Å overlapping wavelength range.
2.3 NuSTAR
NuSTAR (Harrison et al., 2013) complements X-ray spectra obtained with XMM-Newton in the energy band up to keV. Our NuSTAR data were reduced with the NuSTAR Data Analysis Software (NUSTARDAS) and CALDB version 20201101. The FPMA and FPMB source spectra were extracted from a circular region centered on the point source with a radius of 80 arcsec. The background spectra of equivalent extraction radius were extracted from a nearby source-free region. The keV NuSTAR data were used for spectral analysis (Sect. 3). To correct for the cross-calibration among spectra collected by XMM-Newton and NuSTAR, the latter were re-scaled (with respect to RGS) by a factor of 0.962 (FPMA) and 1.045 (FMPB) to match the flux level in the keV overlapping energy range.
2.4 HST/COS
The Cosmic Origin Spectrograph aboard the Hubble Space Telescope (HST/COS, Green et al., 2012) provides high-quality FUV spectra in the wavelength range Å at a resolving power of 15000. We use both the archival observations in 2011 and the new single-orbit observation in 2020. The archival observations used grating G130M with central wavelength settings of 1291 Å, 1300 Å, 1309 Å, and 1318 Å, and G160M with central wavelengths settings of 1589 Å, 1600 Å, 1611 Å, and 1623 Å. In 2020, we used G130M at the 1222 Å central wavelength setting and all four FPPOS locations along with G160M at central wavelengths settings of 1533 Å and 1589 Å. The multiple central wavelengths and FPPOS settings permit our spectra to span the gaps between detector segments and enable us to eliminate detector artifacts and improve the flat-field properties by sampling each wavelength at different detector locations. We retrieved calibrated data from the Mikulski Archive for Space Telescopes (MAST) and reprocessed with COS pipeline version 3.3.10, which incorporates all improvements related to wavelength scales, error propagation, and time-dependent sensitivity. Measurement of the centroids of interstellar absorption features revealed no need for any zero-point corrections to the wavelength scale, which is accurate to 5 (Dashtamirova & Fischer, 2020).
To extend the archival 2011 spectrum to shorter wavelengths, we used FUSE observations from 2001 with optimal reprocessing as described by Kriss (2006), and scaled the flux of the FUSE spectrum to match that of COS in the overlapping wavelength range of Å. An archival HST Faint Object Spectrograph (FOS) observation from 1996 was also used for comparison purposes.
2.5 NIR and optical spectroscopy
We obtained NIR spectroscopy on three occasions. To our knowledge, these data are the first NIR spectra of MR 2251178. On 2020-09-06, we used the SpeX instrument (Rayner et al., 2003) on NASA’s Infrared Telescope Facility (IRTF) equipped with the short cross-dispersed mode (SXD, m) and a slit, which we oriented at the parallactic angle. This setup gives an average spectral resolving power of . The on-source exposure time was s and the weather was photometric with a seeing of arcsec, resulting in a high-quality spectrum with an average continuum . Before the science target, we observed the nearby (in position and airmass) A0 V star HD 218639 and used this standard star to correct our science spectrum for telluric absorption and for flux calibration. We reduced the data using Spextool (version 4.1), an Interactive Data Language (IDL)-based software package developed for SpeX (Cushing et al., 2004) which carries out all the procedures necessary to produce fully reduced spectra.
On 2020-09-30, we obtained a similar cross-dispersed NIR spectrum with the Gemini Near-Infrared Spectrograph (GNIRS; Elias et al., 2006) at Gemini North in queue mode (Program ID: GN-2020B-FT-111). We chose a slit of , which we oriented at the parallactic angle, and obtained an on-source exposure time of s. This setup resulted in a spectrum with an average resolution of and a continuum . We reduced the data using the Gemini/IRAF package (version 1.13) with GNIRS specific tools (Cooke & Rodgers, 2005). We again selected HD 218639 as our standard star for telluric correction and flux calibration.
Then, one week after the coordinated XMM-Newton, HST/COS, and NuSTAR observations, we obtained on 2020-12-23 a final cross-dispersed NIR spectrum, with TripleSpec (Wilson et al., 2004) at the Palomar 5 m. The entrance slit for this instrument is fixed at , which gives a spectral resolving power of . The weather was good and the on-source exposure time of s resulted in a spectrum with a continuum . The somewhat reduced quality of this spectrum relative to those from the IRTF and Gemini is due to a high airmass () and a higher spectral resolution.
We obtained optical spectroscopy on two occasions. On 2020-10-18, we used the Low Resolution Imaging Spectrometer (LRIS; Oke et al., 1995) mounted on the Keck 10 m telescope equipped with the 600/4000 and 400/8500 gratings for the blue and red arms, respectively, and the slit. This setup gives a relatively large spectral coverage of Å, with a very small spectral gap of Å between the two arms. The average spectral resolving power is . The slit was rotated to the parallactic angle, but note that LRIS has an atmospheric dispersion corrector. The on-source exposure time was s at an average airmass of , and resulted in an average continuum . The data were reduced using standard longslit routines from the IRAF software package.
Five days before the coordinated multi-wavelength observations, we obtained on 2020-12-11 an optical spectrum at the Palomar 5 m with the Double Spectrograph (DBSP) instrument(Oke & Gunn, 1982). Similar to LRIS, a dichroic splits the light into separate blue and red channels and we chose for these the 600/4000 and 316/7500 gratings, respectively. We observed through a slit oriented at a parallactic angle for a total exposure time of s. This setup resulted in a spectrum with an average resolving power of and a continuum . The night was not photometric, hence, the entire DBSP spectrum needs to be increased by a factor of 1.7 to match the O [iii] line peak of Keck/LRIS.
3 Spectral analysis
We use SPEX v3.05.00 (Kaastra et al., 1996, 2018a) and -statistics for the X-ray spectral analysis (Kaastra, 2017). Statistical uncertainties are quoted at the 68% confidence level. The protosolar abundances of Lodders & Palme (2009) were used for all the plasma models.
We include model components described as the following to account for continuum, emission, and absorption features simultaneously. For the intrinsic continuum, the NIR to UV data collected in 2020 provide constraints above the Lyman limit ( Å), while the X-ray data provide constraints below the Lyman limit.
3.1 Spectral model components above the Lyman limit
The AGN continuum above the Lyman limit can be described as a disk blackbody model. We use the dbb in SPEX, which is a geometrically thin but optically thick Shakura-Sunyaev accretion disk (Shakura & Sunyaev, 1973). Its normalization and temperature are left free during the fitting. The Milky Way reddening along our line-of-sight is taken into account with frozen parameters (Schlegel et al., 1998) and , as used by Nardini et al. (2014).
We use line-free zones in both the HST/COS spectrum (, , and Å) obtained on 2020-12-16 and the Keck/LRIS spectrum (, , , and Å) obtained on 2020-10-18 to constrain dbb parameters. To account for the host galaxy emission in the Keck spectrum, a template starlight emission from the bulge (Kinney et al., 1996) was included as a file model with its normalization free to vary (Mehdipour et al., 2015). The modeled luminosity of the host galaxy emission is in the Å wavelength range. The dusty torus (NIR excess in Figure 4), Balmer continuum and blended Fe ii emission (the blue bump near UV) are not included in our modeling.

3.2 Spectral model components below the Lyman limit
To model the AGN continuum below the Lyman limit, we use a Comptonized disk component (comt, Titarchuk, 1994), a power-law component, and a neutral reflection component (refl, Magdziarz & Zdziarski, 1995; Życki et al., 1999). The warm Comptonization (comt) is one of the possible interpretations of the soft X-ray excess in AGN (Crummy et al., 2006; Dauser et al., 2010; Done et al., 2012; Petrucci et al., 2013). As shown in our previous works (e.g., Mehdipour et al., 2015, 2017, 2021), it suits our purpose of building a broadband SED for photoionization modeling. The power-law component was cut-off exponentially below the Lyman limit and above 100 keV (Orr et al., 2001). We refer readers to A. Gonzalez et al. (in prep) for a detailed study on the X-ray continuum and its variability over the past two decades. The Galactic absorption in the X-ray band was modeled with a hot model in SPEX. The line-of-sight hydrogen (H i and ) column density was fixed to (Willingale et al., 2013).
The photoionization model pion (Miller et al., 2015; Mehdipour et al., 2016a; Mao et al., 2017) in SPEX was used for both the warm absorber and emitter (e.g., Mao et al., 2018, 2019). Similar to Reeves et al. (2013), three pion absorption components are required with distinct parameters (hydrogen column density, ionization parameter, and kinematics) for the warm absorber. For the warm emitter, two pion emission components are required.
As shown in Figure 3, while the flux in the optical, UV, and hard X-ray bands in 2020 are comparable to those in 2002, the soft X-ray flux was significantly lower due to the presence of the obscurer. The obscurer was modeled as an additional pion absorption component for the 2020 data set.
4 Results
4.1 Broadband AGN SED
After taking into account all the obscuration, absorption, emission, and extinction effects, we derive the best-fit parameters of the broadband SED parameters for both 2002 and 2020 (Table 2). We used relatively simple spectral model components to construct the SED, which is sufficient for the purpose of photoionization modeling. In Figure 4, we illustrate the derived broadband 2020 SED model from NIR to X-ray.
| Obs. date | 2002-05-18 | 2020-12-16 |
|---|---|---|
| Disk blackbody | ||
| Norm () | (f) | (f) |
| (eV) | (f) | (f) |
| Comptonisation | ||
| Norm () | ||
| (eV) | (c) | (c) |
| (keV) | (f) | |
| (f) | (f) | |
| Power-law | ||
| Norm () | ||
| Reflection | ||
| Norm () | (f) | (f) |
| (f) | (f) | |
| 0.0 (f) | 0.0 (f) | |
| scale | ||
| Luminosity | ||
| Statistics | ||
| (total) | 1806.0 | 2902.4 |
| (total) | ||
| d.o.f. (total) | 1676 | 2335 |
| (RGS) | 1614.2/1537 | 1724.3/1587 |
| (pn) | 191.8/189 | 190.1/170 |
| (FPMA) | – – | 544.0/352 |
| (FPMB) | – – | 444.0/352 |

The dbb parameters in Table 2 are obtained with NIR to UV data as described in Section 3.1. They are kept frozen for the X-ray analysis (Section 3.2). The dbb normalization equals to , where is the radius at the inner edge of the disk, and is the inclination angle of the disk. Here we assume equals to the reflection angle measured by Nardini et al. (2014). Following Mehdipour et al. (2021), with our best-fit dbb parameters (Table 2), we obtain ld (or ) and a mass accretion rate of for MR 2251-178.
From our broadband SED modeling, the bolometric luminosity of MR 2251-178 is in 2002 and in 2020. With the black hole mass of (Lira et al., 2011), which is consistent with (Dunn et al., 2008), the Eddington ratio was % in 2002 and % in 2020. In 2011, using the XMM-Newton data (OM, RGS, and EPIC/pn), Nardini et al. (2014) derived a bolometric luminosity of , which corresponds to an Eddington ratio of %111Nardini et al. (2014) adopted a black hole mass of (Dunn et al., 2008), which led them to report an Eddington ratio of %. .
In Figure 5, we show the best fit to the observed X-ray data, as well as the transmission of the Galactic absorption, warm absorber (X-ray), and obscurer (2020 only). The best-fit -statistics (Kaastra, 2017) are given in Table 2, which includes the total -statistics and statistics of individual instruments.

4.2 X-ray warm absorber and emitter
The presence of the obscurer can significantly lower the soft X-ray flux so that the warm absorber features are less prominent. Therefore, the warm absorber parameters are better constrained with the X-ray spectrum obtained in 2002, where no obscurer was present along our line-of-sight. The best-fit parameters of the warm absorber are given in Table 3. These parameters are consistent within the uncertainty of those reported by Reeves et al. (2013).
The hydrogen column density (), microscopic turbulence velocity (), and outflow velocity () of the warm absorber derived from the 2002 X-ray spectrum are kept frozen when analyzing the 2020 X-ray spectrum. The warm absorber is expected to be less ionized in 2020 because photons from the central engine are screened by the obscurer before reaching the warm absorber. Since the warm absorber features are not detectable with the diminished soft X-ray flux, following our previous analysis on NGC 5548 (Kaastra et al., 2014) and NGC 3783 (Mehdipour et al., 2017; Mao et al., 2019), we simply assume that the product of the warm absorber is constant, where is the number density and the distance of the warm absorber to the central engine. For the warm absorber in 2020, the ionization parameter (Tarter et al., 1969; Krolik et al., 1981)
| (1) |
is then calculated with the Rydberg ionizing luminosity. In 2020 (Table 2), 1.96, 0.79, and for components #, respectively. Throughout this paper, the ionization parameter () is given in units of .
| Date | 2002-05-18 |
|---|---|
| Warm absorber #1 | |
| Warm absorber #2 | |
| Warm absorber #3 | |
Two X-ray emission components with distinct velocity broadening are required for the soft X-ray emission lines in the 2002 and 2020 spectra (Figure 6 and Table 4). The warm emitter features are not prominent though, partly due to the relatively short exposure time. To reduce the number of free parameters, based on experience (e.g., Mao et al., 2018, 2019; Grafton-Waters et al., 2021), we fix the emission covering factor , where is the solid angle subtended by the warm emitter with respect to the central engine. The emission covering factors of the two warm emitter components are 0.005 and 0.10, respectively. Both X-ray emission components are slightly (within ) broader and stronger in 2020. Nonetheless, the relatively short exposure for both X-ray spectra (Table 1) do not provide sufficient statistics to draw a firm conclusion.

| Date | 2002-05-18 | 2020-12-16 |
|---|---|---|
| Warm emitter #1 | ||
| 0.005 (f) | 0.005 (f) | |
| Warm emitter #2 | ||
| (f) | ||
| 0.10 (f) | 0.10 (f) | |
4.3 Obscurer
The rising trend of the Swift X-ray hardness ratio since the summer of 2020 suggests an obscuration event, similar to those found in e.g., NGC 5548 (Kaastra et al., 2014) and NGC 3783 (Mehdipour et al., 2017). The apparent lowering of the soft X-ray flux in 2020, in comparison with that in 2002, supports the presence of an obscurer. We aim to constrain the physical properties of the obscurer with X-ray, UV, and NIR data.
4.3.1 X-ray spectra
The best-fit parameters of the obscurer are given in Table 5. The hydrogen column density is , which is comparable (within ) to the hydrogen column density reported by Markowitz et al. (2014). The line-of-sight covering factor is . Hence, only a small fraction of the SED is obscured (Figure 8). That is to say, a large fraction of the X-ray photons leak through the obscurer.
| Date | 2020-12-16 |
|---|---|
| X-ray obscurer | |
With the incident ionizing SED (Figure 4), and the hydrogen column density of the obscurer (Table 5), the ionic column densities can be calculated (Figure 7). For spanning several orders of magnitude, the corresponding ionic column densities of H i, C iv, O vi, and so forth are well above . If the X-ray obscurer intercepts our line-of-sight to (a significant portion of) the UV emitting region, we expect to find absorption features in the HST/COS spectrum.


4.3.2 UV line profiles
In comparison with the archival HST spectra from , new Ly absorption features emerged in the 2020 HST/COS spectrum. These new Ly absorption features are blueshifted by more than , well separated from the relatively slow warm absorber.
A new narrow absorption line was found in the blue wing of Ly with an outflow velocity of and a full-width-half-maximum (FWHM) of (Figure 9). This new absorption feature has an equivalent width of Å. There might be a counterpart in the blue wing of O vi, though the spectrum is noisy. No counterparts were found in lower ionization species (e.g., N v and C iv), which indicates that the ionization parameter of this UV absorber is relatively high.
Assuming and (Table 5), a good fit to the new narrow absorption line of Ly can be achieved with (Figure 10). In this case, turbulent broadening with is required, in addition to thermal broadening, to account for the observed broadening. The hydrogen column density measured in the UV band is more than two orders of magnitude lower than the X-ray measurement in Table 5.


Moreover, a forest of weak absorption features appeared in the blue wing of Ly in 2020, extending all the way down to (Figure 11). The apparent broad absorption feature between and might consist of multiple blended narrow absorption lines, if it is not intrinsically broad. No convincing counterparts are found in the blue wing of C iv.
If the Ly absorption features are all optically thin, then they cannot be the same gas responsible for the X-ray obscuration. Our fit to the strongest feature at shows that it is optically thin, which cannot be a counterpart to the X-ray obscuring gas. However, we have insufficient information to characterize the trough and forest extending to . If these more extended features are optically thick and their weakness reflects low covering fractions, it is possible that this is the same gas as in the X-ray, but simply covering a much larger emitting area in the UV than for the compact X-ray source (as discussed in Sect. 5.4 below). Additional possibilities for linking the UV and X-ray absorbing gas include a UV absorber with the same ionization and covering factor but a significantly lower column density, or UV absorbing gas with no parameters shared with the X-ray, and lying along a completely different line-of-sight.

In addition, a narrow absorption line in the red wing () of Ly was present in the 2011-11-29 HST/COS spectrum but disappeared on 2020-12-16 (Fig. 9). The relatively low velocity shift makes it less likely to be associated with the X-ray obscurer.
Variations of UV warm absorber features () are found e.g., between and ) in the upper panel of Fig. 9. These variations are mainly due to an ionization response of the lower (a factor of 3) flux of the UV and X-ray continuum in 2020 compared to 2011. The contribution from the lower ionizing luminosity caused by the obscurer is minor due to its relatively low covering factor (see also the upper panel of Fig. 8). This might be explained if our line-of-sights towards the X-ray and UV continuum intercept different parts of the obscuring wind.
4.3.3 NIR and optical line profiles
Three NIR spectra of MR 2251-178 were collected in late 2020. While the Pa line shows no absorption, clear, strong absorbers are evident in He i* . In Figure 12, we show the isolated blueshifted He i* absorption in the IRTF and Gemini NIR spectra and find them to be consistent with each other.
Since no previous NIR spectroscopy exists of MR 2251-178 from which we could extract an unabsorbed line profile, we reconstructed it using the strong Pa broad line and [S iii] narrow line profiles from the same spectra. As Landt et al. (2008) showed, the Pa and He i* broad line profiles are very similar. Furthermore, in MR 2251-178 we find that the Pa line lacks a narrow component, making it ideal to model the broad component. Following the approach in Landt et al. (2008), we also used the scaled Pa line to remove the Pa emission line from the blend with He i*.
We note that, in contrast to the broad-line AGN studied by Landt et al. (2008), MR 2251-178 shows a deficit of broad line flux in the red wing of He i* line relative to the Pa profile. This finding is confirmed when comparing the isolated He i* line with the He i* line observed in the Keck optical spectrum, which is not blended with other ionic species on its red wing. The redshifted broad () absorption trough is observed at a velocity of . One of the possible interpretations is that this might be related to inflows fueling the accretion disk, as reported by Zhou et al. (2019) for eight other quasars. Another peculiarity that we find in MR 2251-178 is that all broad-line profiles are consistently blueshifted (by ) and that narrow emission lines from very low-ionisation gas, such as, e.g. [O i], [N ii] and [S ii], are very weak and those from high-ionisation gas, such as, e.g. [O iii], [Ne iii] and [Ne v], are relatively strong.
The new narrow absorption line seen in Ly with was not found in He i*, as expected given the high ionization parameter and low column density of this absorber. We have deblended the IRTF spectrum, which has the best combination of spectral resolution and , with four Gaussian components in the He i* absorption; a broad feature at high velocity (width of , ), a deep feature at low velocity (width of , ) and two barely resolved features ( and ). We note that given the intermediate spectral resolution of the NIR spectrum, all these features could be composed of several narrower features. It is noteworthy the similarity in velocity (and width) between the redshifted absorption trough and the fastest velocity outflow.
It is tempting to associate the fastest velocity He i* outflow with the X-ray obscurer itself, similar to what was observed in NGC 5548 (Wildy et al., 2021). Then, if this is indeed a wind off the accretion disk, as suggested by Dehghanian et al. (2019a, b), the similarity in velocity (and width) between this feature and the redshifted absorption trough indicates that the geometry and viewing angle are such that we see also the far side, the receding part of this structure. This NIR absorber is likely co-located with the warm absorber and it must have only recently arisen due to a lower ionization parameter caused by the obscuration event. This situation is incompatible with the inflow scenario but would then be similar to what was recently observed in NGC 5548 (Wildy et al., 2021) and previously in NGC 4151 (Hutchings et al., 2002; Wildy et al., 2016). This interpretation is supported by the observed hydrogen Balmer line profiles (Figure 13). The four strongest lines in this series show in both optical spectra an absorption profile similar to that of He i* . Notable is also the decreased absorption of the narrow line component as one goes up in the Balmer series (from H to H), indicating that the WA is co-located with that part of the narrow emission line region giving rise to permitted transitions and so of a higher density than the one further out and giving rise to forbidden transitions only.


5 Discussion
While there are more X-ray obscuration events in type 1 AGN in the literature (e.g., Rivers et al., 2015; Gallo et al., 2021; Serafinelli et al., 2021; Armijos-Abendaño et al., 2022), we limit our discussions on the physical properties of the obscurer in quasar MR 2251-178 in comparison with those observed with coordinated multi-wavelength observations. They are one radio-quiet quasar (PG 2112+059, Saez et al., 2021) and six Seyfert galaxies: NGC 5548 (Kaastra et al., 2014; Kriss et al., 2019b), NGC 985 (Ebrero et al., 2016), NGC 3783 (Mehdipour et al., 2017; Kaastra et al., 2018b; Kriss et al., 2019a), Mrk 335 (Longinotti et al., 2013, 2019; Parker et al., 2019), Mrk 817 (Miller et al., 2021; Kara et al., 2021), and NGC 3227 (Mehdipour et al., 2017; Wang et al., 2022; Mao et al., 2022).
5.1 Obscuration duration
The obscuration events in NGC 5548 (Kaastra et al., 2014; Mehdipour et al., 2016b, 2022a) and Mrk 335 (Longinotti et al., 2019; Parker et al., 2019) lasted for years, while relatively shorter and recurrent obscuration events were found in NGC 985 (Ebrero et al., 2016), NGC 3783 (Kaastra et al., 2018b), Mrk 817 (Kara et al., 2021), and NGC 3227 (e.g., Mehdipour et al., 2017; Wang et al., 2022; Mao et al., 2022). For short-lived obscuration events, the duration of the obscuration can be as short as 20 ks (for NGC 3227, Wang et al., 2022).
For MR 2251-178, if we consider the obscurer is present when the Swift X-ray hardness ratio is (Figure 2), the obscuration duration is days. If the threshold is set to , the obscuration duration would be days.
5.2 Obscuration recurrence
Short-lived obscuration events are found to be recurrent for NGC 3783, NGC 985, and NGC 3227. For NGC 3783, the Swift hardness ratios between 2008 and 2017 suggest that there were obscuration events in early 2009 (Kaastra et al., 2018b) and December 2016 (Mehdipour et al., 2017, with joint UV and X-ray observations). Furthermore, archival X-ray spectra obtained with the Advanced Satellite for Cosmology and Astrophysics (ASCA) in 1993 and 1996 also show evidence of obscuration events (Kaastra et al., 2018b). For NGC 985, an obscurer was present with joint X-ray and UV observations in August 2013 and January 2015 (Ebrero et al., 2016). Archival X-ray data suggest that there might have been another obscuration event in July 2003 (Ebrero et al., 2016). For Mrk 817, obscuration has been persistent and variable from November 2020 through March 2021 (Kara et al., 2021), including a 55-day period similar to the “broad-line holiday” observed in NGC 5548. Moreover, an archival NuSTAR spectrum taken on 2015-07-25 suggests an earlier obscuration event, but less prominent than the late 2020 event (Kara et al., 2021). For NGC 3227, X-ray obscuration events were reported in (Lamer et al., 2003; Markowitz et al., 2014), 2002 (Markowitz et al., 2014), 2006 (Wang et al., 2022), 2008 (Beuchert et al., 2015), 2016 (Turner et al., 2018; Wang et al., 2022), and 2019 (Mao et al., 2022).
For PG 2112+059, obscuration events were observed on 2014-12-20 and 2015-08-29, but not on 2002-09-01 (Saez et al., 2021). With no observations between 2014-12-20 and 2015-08-29, it is hard to tell whether it was a continuous obscuration event lasting for eight months or two short-lived events.
For MR 2251-178, X-ray obscuration events might have occurred in 1980 (Halpern, 1984), 1996 (Markowitz et al., 2014), and late 2020 (present work). Compared to the Einstein X-ray spectrum of MR 2215-178 taken on 1979-07-01, the one on 1980-05-19 was significantly absorbed in the soft X-ray band below keV (Halpern, 1984). Markowitz et al. (2014) identified a clear obscuration event in the RXTE observation on 1996-12-09. In the two BeppoSAX observations in June and November 1998, X-ray obscuration had disappeared (Dadina, 2007). No other obscuration events were identified with the RXTE data up to January 2012 (Markowitz et al., 2014) and Swift data between 2014 and mid-2020 (Figure 1). With these X-ray observations and identified obscuration events, if there is a duty cycle, it would range from 16 to 24 years. Some periodic events might trigger the launch of the obscuring wind, or a warped accretion disk might cross our line-of-sight.
5.3 Distance of the obscurer to the black hole
It is not trivial to estimate the distance of the obscurer to the black hole since we cannot directly resolve it via imaging. Lamer et al. (2003) estimated the distance of the obscurer in NGC 3227 assuming it is a spherical cloud orbiting the black hole in a Keplerian orbit. To be more specific, the distance is derived by (1) assuming the radius of the obscurer is ; (2) the obscurer crosses our line-of-sight with a constant velocity in a Keplerian orbit; (3) the crossing time is constrained from the observed duration of the event. We estimate the distance of the 2020 obscurer in MR 2251-178 following the above approach but also discuss alternative scenarios below.
5.3.1 Spherical clouds in Keplerian orbits
For the 1996 obscuration event (with a duration of days) of MR 2251-178, Markowitz et al. (2014) estimated its distance to the black hole to be ld, implying a spherical obscurer with a size scale of ld. They also estimated the H distance ( ld) and the boundary of the dust sublimation zone (Nenkova et al., 2008) ld. For , dust likely does not sublimate, while regions with are dust-free. Thus, they expect the obscurer in 1996 to be dusty.
For the 2020 event, following the same approach, we would obtain ld or and a size scale of ld. According to Nenkova et al. (2008), with (Section 4.1) and a dust temperature K, the boundary of the dust sublimation zone is ld. We can also derive the luminosity-based dust radii following Landt et al. (2019), which yields ld for MR 2251-178. These estimations suggest that the obscurer in 2020 is also likely dusty. With Equation 1, the number density of the obscurer is , which is significantly smaller than the typical number density () of BLR clouds (Peterson, 2006).
5.3.2 Non-spherical clouds in Keplerian orbits
It is possible that the obscurer is not spherical in shape. As discussed in Mao et al. (2022), based on the distance estimate for spherical clouds in Keplerian orbits, we can correct for the non-spherical geometry effect by introducing the azimuthal to radial size ratio . With , we obtain the distance estimation equations used by Lamer et al. (2003) and Markowitz et al. (2014). For larger values, the estimated distance would be closer to the black hole (scaled by ). Since the geometrical shape of the obscurer is unknown, the distance estimates assuming might be under- or over-estimated by more than an order of magnitude if or .
5.3.3 Outflows launched from Keplerian orbits
Here, we estimate the distance that does not rely on the unknown geometrical shape of the obscurer. In the above scenarios (Sect. 5.3.1 and Sect. 5.3.2), the orbiting clouds are expected to have zero velocity in the radial direction. The observed Ly absorption features are blueshifted with outflow velocities ranging from to (Fig. 11), indicating that the obscurer is outflowing in the radial direction.
Given the relatively low outflow velocity in the radial direction (Fig. 11) and short traveling time (Sect. 5.1), the obscurer is expected to be close to its launching radius. Assuming the obscurer was launched from a Keplerian orbit with a period of yr around the black hole (Sect. 5.2), the distance of the obscurer is then ld (or ). This is comparable to the H distance ( ld) given in Markowitz et al. (2014). This is also in accordance with the line-driven disk winds launched at a few radii in numerical simulations (e.g., Nomura et al., 2013; Mizumoto et al., 2021). We can further estimate the number density of the obscurer via Eq. 1, which yields . This value is within the range () of typical number density of BLR clouds (Peterson, 2006).
5.4 X-ray and UV (dis)connection
During the X-ray obscuration period of NGC 5548 (Kaastra et al., 2014; Mehdipour et al., 2016b), NGC 985 (Ebrero et al., 2016), NGC 3783 (Mehdipour et al., 2017; Kaastra et al., 2018b), Mrk 335 (Longinotti et al., 2019; Parker et al., 2019), and Mrk 817 (Kara et al., 2021), prominent blueshifted broad absorption troughs were found in the simultaneous HST/COS spectra. For the best-studied obscurer in NGC 5548, both its column density and covering fraction are variable on timescales of a few ks to a few months (Di Gesu et al., 2015; Mehdipour et al., 2016b; Cappi et al., 2016). The rapid variability and large velocity broadening support the scenario that the obscurer in NGC 5548 originates from the accretion disk (Kaastra et al., 2014). For NGC 3783, an additional high-ionization absorption component was also present in late 2016, leading to Fe xxv and Fe xxvi absorption lines in the Fe K band (Mehdipour et al., 2017). Through a detailed UV analysis, Kriss et al. (2019a) suggest that a collapse of the broad-line region (BLR) clouds triggered the launch of the obscurer. For Mrk 817, the obscurer is located at the inner BLR and partially covers the central source (Kara et al., 2021).
For NGC 3227, we do not find prominent blueshifted broad absorption troughs in the simultaneous HST/COS spectra when the target is obscured in the X-ray band (Mao et al., 2022). The lack of X-ray and UV association might be explained if the X-ray obscurer does not intercept our line-of-sight to (a significant portion of) the UV emitting region. If a compact X-ray obscurer intercepts our line-of-sight to the UV emitting region, it might cover % of the UV emitting region. It is also possible that the X-ray obscurer does not intercept our line-of-sight to the UV emitting region at all, although we cannot well constrain the distance of the obscurer.
For MR 2251-178, following Burke et al. (2021, Eq. S7), the effective UV emitting region radius () can be estimated via
| (2) |
where is the optical continuum luminosity. With , we obtain or ld. This is equivalent to , where the Schwarzschild radius or ld.
Assuming a fiducial X-ray emitting central engine with a size scale of (e.g., Reis & Miller, 2013; Fabian et al., 2015), the UV emitting region would be a factor of larger. With the X-ray obscurer covering % of the X-ray emitting central engine (Table 5), it would then cover merely % of the UV emitting region.
The X-ray covering factor () of MR 2251-178 is comparable to that reported by Ebrero et al. (2016) for the observation episode in NGC 985 observed with XMM-Newton in January 2015. In that case, only one narrow (FHWM) blueshifted () absorption line of Ly was present in the simultaneous HST/COS spectrum. The UV covering factors for the low er-ionization ions C iii*, C iv, and Si iv were and not visible at the signal to noise ratio of the UV spectra.
On one hand, if the obscuring wind barely intercepts the UV continuum region (e.g., the wind projected size is too small compared to the UV emitting region), we might not observe prominent blueshifted absorption lines in the UV band. On the other hand, when a transient obscuring wind is fading, we might not observe prominent blueshifted absorption lines in the UV band. Both might contribute to the lack of prominent UV absorption lines in MR 2251-178.
6 Summary
We present the recent multi-wavelength observations of MR 2251-178, including a set of Swift snapshots in , a coordinated observation with HST/COS, XMM-Newton, and NuSTAR on 2020-12-16, and NIR to optical spectroscopic observations using NASA’s Infrared Telescope Facility, Gemini, Keck, and Palomar from September to December 2020.
We construct a broadband spectral energy distribution of the AGN continuum with the multi-wavelength data. We perform a spectral analysis of the X-ray data, including the photoionization modeling of the newly discovered obscurer and the classical warm absorber in the X-ray band. The observational features in the X-ray band shared similarities with some other type 1 AGNs with obscuring winds. The observational characteristics of the spectral features associated with the obscuring wind in the UV to NIR bands are distinctly different from those seen in other AGN with obscuring outflows. A general understanding of the observational variety of obscuring winds in type 1 AGNs is still lacking. The main results are summarized as follows.
-
1.
In the X-ray band, an obscuration event was present in late 2020, which led to a flux drop in the soft X-ray band without any detectable absorption line features. The obscurer has a hydrogen column density of , a relatively high ionization parameter (), and a relatively low line-of-sight covering factor ().
-
2.
In the UV band, a new blueshifted narrow absorption line of Ly with an outflow velocity of was found in 2020. This new feature is accompanied by a forest of weak absorption features extending to in the blue wing of Ly. No such absorption features are found in the blue wing of C iv. The new weak UV absorption features can only be produced by the same gas obscuring the X-ray if it has a much lower covering fraction relative to the size of the UV-emitting regions.
-
3.
In the NIR band, weak narrow absorption lines are present in the blue wing of He i 1.08 m down to . Although no previous NIR spectroscopy exists for MR 2251-178, we expect the de-ionized warm absorber gives rise to the narrow absorption lines. A redshifted broad absorption trough peaking around with a width of was found for He i . It might be due to an inflow fueling the accretion disk. Alternatively, considering absorption features on both sides of He i, it is possible that we are observing the far (receding) side of the obscurer.
-
4.
According to Swift hardness ratios in , the transient obscurer in MR 2251-178 might last for days. X-ray obscuration events might have a quasi-period of two decades considering earlier events in 1980 and 1996.
-
5.
It is hard to conclude the exact location of the 2020 X-ray obscurer. The inferred distance ranges from the BLR to the dusty torus. However, it is expected to be far beyond the UV emitting region.
Acknowledgements
We thank the referee for providing useful feedback to improve the quality of this work. A reproduction package is available at Zenodo DOI: 10.5072/zenodo.1107961. This package includes data and scripts used to reproduce the fitting results and figures presented here. This work is based on observations obtained with XMM-Newton, an ESA science mission with instruments and contributions directly funded by ESA Member States and the USA (NASA). This work was supported by NASA through a grant for HST program number 16465 from the Space Telescope Science Institute, which is operated by the Association of Universities for Research in Astronomy, Incorporated, under NASA contract NAS5-26555. This research was supported under NASA Contract No. NNG08FD60C, and has made use of data obtained with the NuSTAR mission, a project led by the California Institute of Technology (Caltech), managed by the Jet Propulsion Laboratory (JPL) and funded by NASA. We thank the Swift Science Operations team for approving Swift target-of-opportunity observations in August and December 2020, as well as May 2021. We thank Claus Leitherer for approving the Director’s Discretionary program, Nick Indriolo and Tricia Royle for technical support and executing the HST observation. We thank Norbert Schartel for approving the XMM-Newton directory’s discretionary time observation. We thank Fiona Harrison for approving the NuSTAR Target of Opportunity. We also thank the HST, XMM, and NuSTAR teams for coordinating the observations. SRON is supported financially by NWO, the Netherlands Organization for Scientific Research. JM acknowledges useful discussions with M. S. Brotherton, Pu Du, Dongwei Bao, Zhu Liu, and Shasha Li. HL acknowledges a Daphne Jackson Fellowship sponsored by the Science and Technology Facilities Council (STFC), UK. MMK acknowledges generous support from the David and Lucille Packard Foundation.
References
- Antonucci (1993) Antonucci, R. 1993, ARA&A, 31, 473
- Arav et al. (2015) Arav, N., Chamberlain, C., Kriss, G. A., et al. 2015, A&A, 577, A37
- Armijos-Abendaño et al. (2022) Armijos-Abendaño, J., López, E., Llerena, M., & Logan, C. H. A. 2022, arXiv e-prints, arXiv:2205.10626
- Astropy Collaboration et al. (2013) Astropy Collaboration, Robitaille, T. P., Tollerud, E. J., et al. 2013, A&A, 558, A33
- Beckmann et al. (2006) Beckmann, V., Gehrels, N., Shrader, C. R., & Soldi, S. 2006, ApJ, 638, 642
- Beuchert et al. (2015) Beuchert, T., Markowitz, A. G., Krauß, F., et al. 2015, A&A, 584, A82
- Burke et al. (2021) Burke, C. J., Shen, Y., Blaes, O., et al. 2021, Science, 373, 789
- Burrows et al. (2005) Burrows, D. N., Hill, J. E., Nousek, J. A., et al. 2005, Space Sci. Rev., 120, 165
- Cappi et al. (2016) Cappi, M., De Marco, B., Ponti, G., et al. 2016, A&A, 592, A27
- Cooke & Rodgers (2005) Cooke, A., & Rodgers, B. 2005, in Astronomical Society of the Pacific Conference Series, Vol. 347, Astronomical Data Analysis Software and Systems XIV, ed. P. Shopbell, M. Britton, & R. Ebert, 514
- Cooke et al. (1978) Cooke, B. A., Ricketts, M. J., Maccacaro, T., et al. 1978, MNRAS, 182, 489
- Crenshaw et al. (2003) Crenshaw, D. M., Kraemer, S. B., & George, I. M. 2003, ARA&A, 41, 117
- Crummy et al. (2006) Crummy, J., Fabian, A. C., Gallo, L., & Ross, R. R. 2006, MNRAS, 365, 1067
- Cushing et al. (2004) Cushing, M. C., Vacca, W. D., & Rayner, J. T. 2004, PASP, 116, 362
- Dadina (2007) Dadina, M. 2007, A&A, 461, 1209
- Dashtamirova & Fischer (2020) Dashtamirova, D., & Fischer, W. 2020, Cosmic Origins Spectrograph Instrument Handbook, Version 12.1, Tech. rep., STScI, Baltimore
- Dauser et al. (2010) Dauser, T., Wilms, J., Reynolds, C. S., & Brenneman, L. W. 2010, MNRAS, 409, 1534
- De Rosa et al. (2015) De Rosa, G., Peterson, B. M., Ely, J., et al. 2015, ApJ, 806, 128
- Dehghanian et al. (2019a) Dehghanian, M., Ferland, G. J., Kriss, G. A., et al. 2019a, ApJ, 877, 119
- Dehghanian et al. (2019b) Dehghanian, M., Ferland, G. J., Peterson, B. M., et al. 2019b, ApJ, 882, L30
- den Herder et al. (2001) den Herder, J. W., Brinkman, A. C., Kahn, S. M., et al. 2001, A&A, 365, L7
- Di Gesu et al. (2015) Di Gesu, L., Costantini, E., Ebrero, J., et al. 2015, A&A, 579, A42
- Done et al. (2012) Done, C., Davis, S. W., Jin, C., Blaes, O., & Ward, M. 2012, MNRAS, 420, 1848
- Dunn et al. (2008) Dunn, J. P., Crenshaw, D. M., Kraemer, S. B., & Trippe, M. L. 2008, AJ, 136, 1201
- Ebrero et al. (2016) Ebrero, J., Kriss, G. A., Kaastra, J. S., & Ely, J. C. 2016, A&A, 586, A72
- Elias et al. (2006) Elias, J. H., Joyce, R. R., Liang, M., et al. 2006, in Society of Photo-Optical Instrumentation Engineers (SPIE) Conference Series, Vol. 6269, Society of Photo-Optical Instrumentation Engineers (SPIE) Conference Series
- Evans et al. (2009) Evans, P. A., Beardmore, A. P., Page, K. L., et al. 2009, MNRAS, 397, 1177
- Fabian et al. (2015) Fabian, A. C., Lohfink, A., Kara, E., et al. 2015, MNRAS, 451, 4375
- Ferland et al. (2017) Ferland, G. J., Chatzikos, M., Guzmán, F., et al. 2017, Rev. Mexicana Astron. Astrofis., 53, 385
- Gallo et al. (2021) Gallo, L. C., Gonzalez, A. G., & Miller, J. M. 2021, ApJ, 908, L33
- Gehrels et al. (2004) Gehrels, N., Chincarini, G., Giommi, P., et al. 2004, ApJ, 611, 1005
- Goad et al. (2016) Goad, M. R., Korista, K. T., De Rosa, G., et al. 2016, ApJ, 824, 11
- Grafton-Waters et al. (2021) Grafton-Waters, S., Branduardi-Raymont, G., Mehdipour, M., et al. 2021, A&A, 649, A162
- Green et al. (2012) Green, J. C., Froning, C. S., Osterman, S., et al. 2012, ApJ, 744, 60
- Halpern (1984) Halpern, J. P. 1984, ApJ, 281, 90
- Harrison et al. (2013) Harrison, F. A., Craig, W. W., Christensen, F. E., et al. 2013, ApJ, 770, 103
- Hutchings et al. (2002) Hutchings, J. B., Crenshaw, D. M., Kraemer, S. B., et al. 2002, AJ, 124, 2543
- Jansen et al. (2001) Jansen, F., Lumb, D., Altieri, B., et al. 2001, A&A, 365, L1
- Kaastra (2017) Kaastra, J. S. 2017, A&A, 605, A51
- Kaastra et al. (1996) Kaastra, J. S., Mewe, R., & Nieuwenhuijzen, H. 1996, in UV and X-ray Spectroscopy of Astrophysical and Laboratory Plasmas, 411–414
- Kaastra et al. (2018a) Kaastra, J. S., Raassen, A. J. J., de Plaa, J., & Gu, L. 2018a, SPEX X-ray spectral fitting package, Zenodo, v3.05.00, Zenodo, doi:10.5281/zenodo.2419563
- Kaastra et al. (2014) Kaastra, J. S., Kriss, G. A., Cappi, M., et al. 2014, Science, 345, 64
- Kaastra et al. (2018b) Kaastra, J. S., Mehdipour, M., Behar, E., et al. 2018b, A&A, 619, A112
- Kara et al. (2021) Kara, E., Mehdipour, M., Kriss, G. A., et al. 2021, ApJ, 922, 151
- Kinney et al. (1996) Kinney, A. L., Calzetti, D., Bohlin, R. C., et al. 1996, ApJ, 467, 38
- Kriss (2006) Kriss, G. A. 2006, in Astronomical Society of the Pacific Conference Series, Vol. 348, Astrophysics in the Far Ultraviolet: Five Years of Discovery with FUSE, ed. G. Sonneborn, H. W. Moos, & B. G. Andersson, 499
- Kriss et al. (2019a) Kriss, G. A., Mehdipour, M., Kaastra, J. S., et al. 2019a, A&A, 621, A12
- Kriss et al. (2019b) Kriss, G. A., De Rosa, G., Ely, J., et al. 2019b, ApJ, 881, 153
- Krolik et al. (1981) Krolik, J. H., McKee, C. F., & Tarter, C. B. 1981, ApJ, 249, 422
- Laha et al. (2021) Laha, S., Reynolds, C. S., Reeves, J., et al. 2021, Nature Astronomy, 5, 13
- Lamer et al. (2003) Lamer, G., Uttley, P., & McHardy, I. M. 2003, MNRAS, 342, L41
- Landt et al. (2008) Landt, H., Bentz, M. C., Ward, M. J., et al. 2008, ApJS, 174, 282
- Landt et al. (2019) Landt, H., Ward, M. J., Kynoch, D., et al. 2019, MNRAS, 489, 1572
- Lira et al. (2011) Lira, P., Arévalo, P., Uttley, P., McHardy, I., & Breedt, E. 2011, MNRAS, 415, 1290
- Lodders & Palme (2009) Lodders, K., & Palme, H. 2009, Meteoritics and Planetary Science Supplement, 72, 5154
- Longinotti et al. (2013) Longinotti, A. L., Krongold, Y., Kriss, G. A., et al. 2013, ApJ, 766, 104
- Longinotti et al. (2019) Longinotti, A. L., Kriss, G., Krongold, Y., et al. 2019, ApJ, 875, 150
- Magdziarz & Zdziarski (1995) Magdziarz, P., & Zdziarski, A. A. 1995, MNRAS, 273, 837
- Mao et al. (2017) Mao, J., Kaastra, J. S., Mehdipour, M., et al. 2017, A&A, 607, A100
- Mao et al. (2018) —. 2018, A&A, 612, A18
- Mao et al. (2019) Mao, J., Mehdipour, M., Kaastra, J. S., et al. 2019, A&A, 621, A99
- Mao et al. (2022) Mao, J., Kaastra, J. S., Mehdipour, M., et al. 2022, arXiv e-prints, arXiv:2204.06813
- Markowitz et al. (2014) Markowitz, A. G., Krumpe, M., & Nikutta, R. 2014, MNRAS, 439, 1403
- Mehdipour et al. (2016a) Mehdipour, M., Kaastra, J. S., & Kallman, T. 2016a, A&A, 596, A65
- Mehdipour et al. (2022a) Mehdipour, M., Kriss, G. A., Costantini, E., et al. 2022a, arXiv e-prints, arXiv:2207.09464
- Mehdipour et al. (2015) Mehdipour, M., Kaastra, J. S., Kriss, G. A., et al. 2015, A&A, 575, A22
- Mehdipour et al. (2016b) —. 2016b, A&A, 588, A139
- Mehdipour et al. (2017) —. 2017, A&A, 607, A28
- Mehdipour et al. (2021) Mehdipour, M., Kriss, G. A., Kaastra, J. S., et al. 2021, A&A, 652, A150
- Mehdipour et al. (2022b) Mehdipour, M., Kriss, G. A., Brenneman, L. W., et al. 2022b, ApJ, 925, 84
- Miller et al. (2015) Miller, J. M., Kaastra, J. S., Miller, M. C., et al. 2015, Nature, 526, 542
- Miller et al. (2021) Miller, J. M., Zoghbi, A., Reynolds, M. T., et al. 2021, ApJ, 911, L12
- Mizumoto et al. (2021) Mizumoto, M., Nomura, M., Done, C., Ohsuga, K., & Odaka, H. 2021, MNRAS, 503, 1442
- Nardini et al. (2014) Nardini, E., Reeves, J. N., Porquet, D., et al. 2014, MNRAS, 440, 1200
- Nenkova et al. (2008) Nenkova, M., Sirocky, M. M., Nikutta, R., Ivezić, Ž., & Elitzur, M. 2008, ApJ, 685, 160
- Netzer (2015) Netzer, H. 2015, ARA&A, 53, 365
- Nomura et al. (2013) Nomura, M., Ohsuga, K., Wada, K., Susa, H., & Misawa, T. 2013, PASJ, 65, 40
- Oke & Gunn (1982) Oke, J. B., & Gunn, J. E. 1982, PASP, 94, 586
- Oke et al. (1995) Oke, J. B., Cohen, J. G., Carr, M., et al. 1995, PASP, 107, 375
- Orr et al. (2001) Orr, A., Barr, P., Guainazzi, M., Parmar, A. N., & Young, A. J. 2001, A&A, 376, 413
- Padovani et al. (2017) Padovani, P., Alexander, D. M., Assef, R. J., et al. 2017, A&A Rev., 25, 2
- Parker et al. (2017) Parker, M. L., Pinto, C., Fabian, A. C., et al. 2017, Nature, 543, 83
- Parker et al. (2019) Parker, M. L., Longinotti, A. L., Schartel, N., et al. 2019, MNRAS, 490, 683
- Peterson (2006) Peterson, B. M. 2006, The Broad-Line Region in Active Galactic Nuclei, ed. D. Alloin, Vol. 693, 77
- Petrucci et al. (2013) Petrucci, P. O., Paltani, S., Malzac, J., et al. 2013, A&A, 549, A73
- Proga & Kallman (2004) Proga, D., & Kallman, T. R. 2004, ApJ, 616, 688
- Rayner et al. (2003) Rayner, J. T., Toomey, D. W., Onaka, P. M., et al. 2003, PASP, 115, 362
- Reeves et al. (2003) Reeves, J. N., O’Brien, P. T., & Ward, M. J. 2003, ApJ, 593, L65
- Reeves et al. (2013) Reeves, J. N., Porquet, D., Braito, V., et al. 2013, ApJ, 776, 99
- Reis & Miller (2013) Reis, R. C., & Miller, J. M. 2013, ApJ, 769, L7
- Ricker et al. (1978) Ricker, G. R., Clarke, G. W., Doxsey, R. E., et al. 1978, Nature, 271, 35
- Rivers et al. (2015) Rivers, E., Baloković, M., Arévalo, P., et al. 2015, ApJ, 815, 55
- Roming et al. (2005) Roming, P. W. A., Kennedy, T. E., Mason, K. O., et al. 2005, Space Sci. Rev., 120, 95
- Saez et al. (2021) Saez, C., Brandt, W. N., Bauer, F. E., et al. 2021, MNRAS, 506, 343
- Schlegel et al. (1998) Schlegel, D. J., Finkbeiner, D. P., & Davis, M. 1998, ApJ, 500, 525
- Serafinelli et al. (2021) Serafinelli, R., Braito, V., Severgnini, P., et al. 2021, A&A, 654, A32
- Shakura & Sunyaev (1973) Shakura, N. I., & Sunyaev, R. A. 1973, A&A, 500, 33
- Tarter et al. (1969) Tarter, C. B., Tucker, W. H., & Salpeter, E. E. 1969, ApJ, 156, 943
- Titarchuk (1994) Titarchuk, L. 1994, ApJ, 434, 570
- Tombesi et al. (2013) Tombesi, F., Cappi, M., Reeves, J. N., et al. 2013, MNRAS, 430, 1102
- Turner et al. (2018) Turner, T. J., Reeves, J. N., Braito, V., et al. 2018, MNRAS, 481, 2470
- Wang et al. (2022) Wang, Y., Kaastra, J., Mehdipour, M., et al. 2022, A&A, 657, A77
- Wildy et al. (2016) Wildy, C., Landt, H., Goad, M. R., Ward, M., & Collinson, J. S. 2016, MNRAS, 461, 2085
- Wildy et al. (2021) Wildy, C., Landt, H., Ward, M. J., Czerny, B., & Kynoch, D. 2021, MNRAS, 500, 2063
- Willingale et al. (2013) Willingale, R., Starling, R. L. C., Beardmore, A. P., Tanvir, N. R., & O’Brien, P. T. 2013, MNRAS, 431, 394
- Wilson et al. (2004) Wilson, J. C., Henderson, C. P., Herter, T. L., et al. 2004, in Society of Photo-Optical Instrumentation Engineers (SPIE) Conference Series, Vol. 5492, Ground-based Instrumentation for Astronomy, ed. A. F. M. Moorwood & M. Iye, 1295–1305
- Zhou et al. (2019) Zhou, H., Shi, X., Yuan, W., et al. 2019, Nature, 573, 83
- Życki et al. (1999) Życki, P. T., Done, C., & Smith, D. A. 1999, MNRAS, 309, 561