Multi-objective Optimization in CPU Design Space Exploration: Attention is All You Need
Abstract.
Design space exploration (DSE) enables architects to systematically evaluate various design options, guiding decisions on the most suitable configurations to meet specific objectives such as optimizing performance, power, and area. However, the growing complexity of modern CPUs has dramatically increased the number of micro-architectural parameters and expanded the overall design space, making DSE more challenging and time-consuming. Existing DSE frameworks struggle in large-scale design spaces due to inaccurate models and limited insights into parameter impact, hindering efficient identification of optimal micro-architectures within tight timeframes.
In this work, we introduce AttentionDSE111The code is now available on anonymous GitHub.. Its key idea is to use the attention mechanism to establish a direct mapping of micro-architectural parameters to their contributions to predicted performance. This approach enhances both the prediction accuracy and interpretability of the performance model. Furthermore, the weights are dynamically adjusted, enabling the model to respond to design changes and effectively pinpoint the key micro-architectural parameters/components responsible for performance bottlenecks. Thus, AttentionDSE accurately, purposefully, and rapidly discovers optimal designs. Experiments on SPEC 2017 demonstrate that AttentionDSE significantly reduces exploration time by over 80% and achieves 3.9% improvement in Pareto Hypervolume compared to state-of-the-art DSE frameworks while maintaining superior prediction accuracy and efficiency with an increasing number of parameters.
1. Introduction
Design space exploration (DSE) is an essential phase in CPU design, characterized by an iterative exploration that focuses on balancing performance, power, and area (PPA) (PPA1, ; PPA2, ; PPA3, ; PPA4, ). Typically, the DSE can be formulated as a Bayesian optimization (BO) process to find multi-objective trade-offs. A prevailing DSE framework primarily comprises two components: the surrogate model and the acquisition function. Specifically, the surrogate model predicts the PPA of micro-architectural parameters, bypassing time-consuming simulations (PPA2, ; blackbox2, ; blackbox3, ; BOOMExplorer, ; MoDSE, ), and the acquisition function identifies candidate optimal alternatives for multi-objective optimization, guiding the DSE iterations (nonblackbox1, ; nonblackbox2, ; nonblackbox3, ; nonblackbox4, ; ActBoost, ; bottleneck_analysis1, ).
Concurrently, the growing complexity of modern CPUs (PowerPC_cpu, ; AMD_cpu, ; superscalar_cpu, ) results in an exponential increase in micro-architectural parameters, known as the high-dimensional design space. High-dimensional DSE imposes significant limitations on current DSE frameworks, making it difficult to identify optimal designs within a reasonable timeframe, with some even failing to find optimal solutions altogether. Specifically, it presents three key challenges.
-
First, the effectiveness of DSE frameworks is constrained by the limited accuracy and speed of surrogate models in high-dimensional design spaces. To expedite DSE, various statistical regression methods (ActBoost, ; MoDSE, ; BO1, ; BO2, ; BOOMExplorer, ; Archranker, ) have been proposed as surrogate models to predict the performance metrics of micro-architecture. However, these models suffer from an exponential increase in training and inference time (random_forest, ; GPR, ) and their accuracy decreases with the expanding of the design space (dimgpr, ; dimencurse, ).
-
Second, the effectiveness of DSE frameworks is limited by the inefficiency of acquisition functions in high-dimensional design spaces. Acquisition functions are crucial in the DSE framework, as they identify the candidate optimal design for exploration. However, most acquisition functions depend heavily on expert knowledge to identify the most potential sample in the design space (ActBoost, ; MoDSE, ; BOOMExplorer, ), or on complex feature engineering (ArchExplorer, ) which requires a time-consuming process to identify the bottleneck of the current micro-architecture. Moreover, some of them even depend on exhaustive search (MoDSE, ; BOOMExplorer, ; ActBoost, ), which makes the acquisition functions impractical in high-dimensional design spaces.
-
Third, recent DSE frameworks overlook the impact of individual micro-architectural parameters on final performance metrics, missing valuable insights into their contributions. This issue primarily arises from the surrogate model’s inability to accurately capture the contribution of each parameter to overall performance (MoDSE, ; BOOMExplorer, ; ActBoost, ; PPA1, ; challenge3_3, ). Additionally, the separation of the surrogate model and acquisition function as independent entities in previous efforts further exacerbates this issue, as it impedes the seamless information exchange between them (ArchExplorer, ; MoDSE, ; BOOMExplorer, ; ActBoost, ).
In this work, we introduce AttentionDSE, a novel DSE framework that leverages the attention mechanism to accurately, purposefully, and rapidly identify optimal CPU designs in the high-dimensional design space. The key idea of AttentionDSE lies in its use of attention-based models to establish a direct mapping between micro-architectural parameters and performance metrics. This approach improves both the accuracy and interpretability of the performance model. Additionally, the attention weights are dynamically adjusted throughout the exploration process, allowing the model to adapt efficiently to design changes. This dynamic adjustment enables more effective identification of key micro-architectural parameters responsible for performance bottlenecks. As a result, AttentionDSE not only accelerates the design space exploration process but also ensures more precise and purposeful optimization, enabling rapid discovery of optimal micro-architectural designs.
Overall, our contributions are as follows:
-
We transform the DSE into a sequence prediction problem, introducing AttentionDSE that synergizes the surrogate model and acquisition function and leverages the attention mechanism for high-dimensional DSE on CPU.
-
We introduce a Perception-Driven Attention (PDA) mechanism, which utilizes micro-architectural insights to focus on relevant parameters, minimizing computational overhead of irrelevant parameters to reduce the training and inference time of attention-based performance model.
-
We propose an Attention-aware Bottleneck Analysis (ABA) algorithm, which uses attention weights to purposefully and quickly pinpoint bottlenecks, guiding the exploration.
-
Experimental results show that AttentionDSE reduces exploration time by over 80% and improves Pareto Hypervolume (PHV) by 3.9% compared to state-of-the-art (SOTA) DSE frameworks. Additionally, as the number of micro-architectural parameters increases, AttentionDSE keeps stable prediction accuracy and avoids significant increases in training and inference time.
2. Background
In this section, we introduce the relevant concepts.
2.1. Attention Mechanism
The attention mechanism has become one of the most crucial concepts in deep learning. Inspired by human biological systems, which focus on distinctive and relevant details when processing large amounts of information, attention mechanisms allow models to prioritize important data instead of treating every input equally. This selective focus enhances the efficiency and effectiveness of handling complex data.
A typical attention layer in a neural network dynamically identifies the most relevant parts of the input. The attention score is defined as:
| (1) |
It operates using three key vectors: query (Q), key (K), and value (V). The attention mechanism calculates a score by comparing the query and key vectors, which are normalized via a softmax function to produce attention weights. These weights then compute a weighted sum of the value vectors, emphasizing the most critical information. This process is especially effective in self-attention, where each input element attends to all others, and in multi-head attention, which captures different aspects of the input through multiple attention heads. Attention layers are foundational in models like transformers (transformer, ), enabling flexible and efficient learning of dependencies within sequences.
2.2. Design Space Exploration in CPU Design
DSE is a critical technique in the optimization and design process, primarily used to identify and analyze various design options within CPU design (PPA1, ; PPA2, ; PPA3, ; PPA4, ). Its goal is to systematically explore all possible design alternatives to find the optimal or near-optimal solutions that meet specific design requirements and constraints (ArchExplorer, ; MoDSE, ; BOOMExplorer, ; ActBoost, ; wangduo1, ; wangduo2, ).
To expedite the process, prevailing DSE frameworks adhere to the fundamental principles of BO (MoDSE, ; BOOMExplorer, ; ActBoost, ; Archranker, ). BO leverages a surrogate model that serves as a predictive tool, approximating the underlying objective function (GPR, ; random_forest, ; ensemble_learning, ). Additionally, an acquisition function drives the optimization process in DSE frameworks, efficiently navigating the DSE by identifying promising design points (PPA2, ), which is a set of micro-architectural parameters, for evaluation (ArchExplorer, ). The above two facilitate effective exploration of the design space within a reasonable time (BO1, ; BO2, ).

Fig. 1 illustrates the core workflow of the BO-based DSE framework. Prior to the exploration stage, the framework first trains the surrogate model using sampling methods, such as Plackett-Burman ranking(PBrank, ; MoDSE, ), to generate the training set (①, ②, ③). Once the surrogate models are trained, the exploration stage begins. The acquisition function selects a design point from the design space (❶) and sends it to the surrogate models to evaluate the PPA (❷). The framework then iteratively updates the Pareto-optimal set and repeats this process (❸, ❹).
2.3. Pareto Optimal Set
A key concept in CPU DSE is the Pareto optimal set. A solution is considered as Pareto optimal if there is no other solution that improves some objective without worsening at least one other objective. To formalize the DSE as a multi-objective optimization task, the micro-architectural parameters are serialized as a feature vector referred to as a design point. The collection of all design points forms the design space . Performance Metrics used to evaluate a design point are denoted as . In an n-objective minimization problem, a design point is defined to be dominated by if
| (2) |
This dominance is denoted as the partial order and . Conversely, if does not dominate , it is denoted as and . Among all design points, the set of design points that are not dominated by any other design points is called the Pareto optimal set , formulated as:
| (3) |
The PHV is determined by the Pareto optimal set and a reference point, as shown in Fig.2(a). It is represented by the region of blue points, enclosed by light gray lines, with the reference point labeled as . A larger PHV indicates a better compromise achieved by the solution set across multiple optimization objectives. In Fig.2(b), the new design points and demonstrate superior performance or power compared to the original design points, with both expanding the PHV, illustrated by the red and purple regions, respectively.

3. Related Works
Many efforts (Archranker, ; relative_work2, ; relative_work3, ; relative_work1, ; BOOMExplorer, ; MoDSE, ; ArchExplorer, ; relative_work4, ; ActBoost, ) accomplish the DSE tasks.
For the early work, Mariani et al. (relative_work1, ) use a Kriging model (Kriging, ) with exponential correlation as a surrogate to predict the Pareto nondominated rank distribution. They then iteratively optimize using the Expected Improvement (EI) of non-dominated levels as the acquisition function. CASH (relative_work2, ) compares multiple machine learning models and finds that BO achieves superior exploration results, by using a random forest as the surrogate model and EI as the acquisition function. Wang et al. (relative_work3, ) employ an adaptive component selection and smoothing operator as the surrogate model and the expected Hypervolume Improvement (HVI) of the Pareto frontier as the acquisition function.
For the blackbox DSE framework, ActBoost (ActBoost, ) integrates statistical methods and machine learning to prune the design space and determine the training set. For the surrogate model, ActBoost uses two AdaBoost.RT (AdaBoost.RT, ) models with active learning. For the acquisition function, it calculates the prediction uncertainty of each unsampled design point and selects one with the highest uncertainty. By combining statistical sampling and the boosting technique, ActBoost enables efficient and accurate DSE tasks. BOOMExplorer (BOOMExplorer, ) employs Gaussian Process Regression (GPR) (GPR, ) as the surrogate model and leverages EI (EI, ) as the acquisition function, searching for the next design point by analyzing data distribution characteristics. By embedding prior knowledge, BOOMExplorer achieves superior compared to analytical methods. MoDSE (MoDSE, ) leverages ensemble learning for more accurate prediction. It combines AdaBoost (AdaBoost, ) and Gradient Boosted Regression Trees (GBRT) (GBRT, ) as the surrogate model and uses HVI with a full-space search for the acquisition function. MoDSE introduces a uniformity-aware selection algorithm for efficient multi-objective DSE and a Pareto-rank-based sample weight generation algorithm to train the surrogate model, enhancing the DSE outcomes.
For the DSE frameworks based on bottleneck analysis, ArchExplorer (ArchExplorer, ) adopts the dynamic event-dependence graph (DEG) (DEG, ) for critical path analysis and identifies bottlenecks in the current micro-architecture to guide the design of micro-architecture. It couples this approach with a software simulator (Gem5) (gem5, ) as the surrogate model. ArchExplorer focuses on refining the acquisition function to reduce the need for domain knowledge in mechanistic models. Explainable-DSE (Explainable_DSE, ) is the SOTA framework for DSE tasks in deep neural network (DNN) accelerators. By leveraging the structure and characteristics of neural networks, Explainable-DSE constructs a bottleneck model to identify design bottlenecks. It enables targeted optimizations to mitigate issues such as high latency and power consumption, while also providing explanations for the design adjustments made and their impact on performance. This framework is primarily used for the joint DSE of DNN accelerators and DNN algorithms.
4. Motivation
In this section, we will explain the motivations behind leveraging the attention mechanism in the DSE framework.
4.1. Challenges in Current DSE Studies
Modern CPU design is becoming increasingly complex, with a growing number of micro-architectural parameters. The exploration in such a significantly large design space is known as the high-dimensional DSE. Current DSE frameworks face three primary challenges in high-dimensional tasks.
First, DSE frameworks struggle with effectiveness due to the limited accuracy and efficiency of surrogate models in high-dimensional design spaces. The surrogate models in prevailing DSE frameworks (ActBoost, ; MoDSE, ; BOOMExplorer, ; Archranker, ), which typically use statistical regression methods, are simple while vulnerable. Specifically, prediction accuracy can decline as dimensionality increases. For instance, when the number of parameters exceeds 75, BOOMExplorer struggles to accurately predict and associate micro-architectural parameters with performance metrics.
This issue arises from the sparser feature space in high-dimensional condition (dimencurse, ), indicating the need for more training data to accurately capture the data distribution. However, the training and inference time increases greatly as the size of the training set grows. For instance, with a training set of size , the complexity of training the inverse of the covariance matrix typically reaches and the inference through the inverse of the covariance matrix is . This considerable computational cost renders high-dimensional design spaces impractical.
Second, the performance of DSE frameworks is hindered by the inefficiency of acquisition functions when dealing with high-dimensional design spaces. Acquisition functions are crucial for finding optimal design configurations, but they face challenges in high-dimensional design spaces. Current methods often rely on expert knowledge (ActBoost, ; MoDSE, ; BOOMExplorer, ) or complex feature engineering (ArchExplorer, ) to identify the bottleneck of the current micro-architecture, which can introduce biases, require significant time, and lack scalability. For instance, ArchExplorer only analyses the first hundred thousand of the instructions and achieves the optimal architecture with the number of parameters 21 over 15 days (ArchExplorer, ). Moreover, some methods rely on large-scale or even exhaustive search (MoDSE, ; ActBoost, ; BOOMExplorer, ). In high-dimensional spaces, this exhaustive search becomes computationally prohibitive due to the enlarged design space. For example, MoDSE can only perform with the number of parameters 10 (totaling 36,864 design points) (MoDSE, ). When the number of parameters increases to 30, it may take years. The high computational cost of such searches slows down the DSE process, delaying the identification of high-performance designs. This inefficiency slows down the DSE process, highlighting the need for more advanced and efficient acquisition strategies to handle complex, high-dimensional problems.
Third, conventional DSE frameworks fail to recognize the impact of each parameter on performance metrics. This limitation can cause these frameworks to overlook critical insights into how individual parameters impact the performance metrics, making it difficult to quickly and accurately identify bottlenecks in the current design. This phenomenon can be attributed to two primary reasons. Firstly, existing surrogate models cannot unveil the contributions of each parameter to the performance metrics because they rely on mathematical analysis (ActBoost, ; Archranker, ) or simplistic black-box models (BOOMExplorer, ; MoDSE, ) for prediction. Secondly, prevailing DSE frameworks typically adhere to a two-stage DSE scheme, treating the surrogate model and acquisition function as independent entities. This separation inhibits the exchange of information, preventing a comprehensive understanding of parameter efficacy (BOOMExplorer, ; MoDSE, ; ActBoost, ; ArchExplorer, ). Moreover, the lack of integration between these two components hinders the ability of the acquisition function to adaptively refine the exploration results based on feedback from the surrogate model, resulting in suboptimal performance and less effective DSE.
4.2. Opportunity of Attention in DSE Tasks
DSE is a crucial process in CPU design, often consisting of two important tasks: prediction and bottleneck analysis. Prediction helps estimate the performance of various design configurations, while bottleneck analysis identifies critical constraints that limit system efficiency. Both tasks are essential to guide CPU design effectively.
Recent advances in attention mechanisms offer significant advantages in addressing these challenges, proving to be highly effective for both performance prediction and bottleneck analysis. First, attention has been demonstrated to excel in regression tasks (attention_regression1, ; attention_regression2, ), accurately capturing complex relationships between inputs and outputs. Second, attention mechanisms inherently highlight the importance of different parameters by assigning varying weights, thus enabling a more fine-grained analysis of key design factors. These strengths align directly with the core needs of DSE, where both accurate performance prediction and the identification of critical design parameters are essential for driving effective design exploration.
5. Design of AttentionDSE
In this section, we introduce AttentionDSE, the first DSE framework that adopts the attention mechanism, suitable for high-dimensional DSE.
5.1. Overview of AttentionDSE
Figure 3 provides an overview of AttentionDSE. It comprises three primary components: 1) Predictors, which provide rapid and accurate predictions of performance metrics (e.g., IPC) for given micro-architectures across benchmarks, thereby obviating the need for time-intensive simulations; 2) Micro-architecture Serialization, designed to reduce the computational burden associated with predictions, thereby expediting the performance evaluation process; 3) Bottleneck Analysis and Iterator, which identify the micro-architectural parameters that introduce performance bottlenecks within micro-architecture modules, facilitating the exploration of promising micro-architectural candidates by selectively modifying these parameters. The process of the AttentionDSE consists of a predictor training stage (①, ②, ③, ④) and an architecture exploration stage (❶, ❷, ❸, ❹, ❺).


The training stage is a one-time process, and the sequence of operations is represented by hollow numbers. This stage focuses on training predictors for performance metrics, ensuring that the models accurately capture the relationships between micro-architectural parameters and performance metrics. Unlike other approaches that rely on specialized sampling methods, AttentionDSE adopts a random sampling approach and then converts the design point to the sequence input, generating the training set (①, ②, ③). Next, the deep learning model, integrated with the PDA, functioning as the predictor, is trained to predict performance metrics (④). Benefiting from probabilistic attribute correlation in attention calculation, it’s more convenient to capture the intricate relationship between parameters, which informs exploration hints for the exploration stage.
Once the predictors are trained, AttentionDSE is ready for the exploration stage, which is iterative and aims for efficient multi-objective optimization. The exploration stage begins with a random sampling of design points (❶), followed by the exploration of the Pareto optimal set of these points through the trained predictors (❷). Each design point in the Pareto optimal set is analyzed to determine the contribution of each parameter (❸). The Bottleneck Analysis Iterator then selects the next design point based on the ABA algorithm (❹, ❺). This iterative process continues until the preset performance metrics are met, ensuring efficient and thorough exploration of the design space. Fig. 4 presents a detailed workflow of the exploration stage. All these techniques will be discussed in detail in the following sections.
5.2. Attention-based Prediction Model
A fast and accurate performance predictor can replace traditional simulation methods, serving as the cornerstone of an efficient DSE framework. This approach significantly accelerates design iterations and reduces the overall design cycle. As discussed in Section 4, the attention-based model is a promising option for developing such a predictor. Neural networks possess strong nonlinear fitting capabilities, making them well-suited for learning from high-dimensional data. Additionally, they benefit from robust hardware acceleration and a well-developed GPU-based framework, collectively enhancing training and inference speed.
In this subsection, we propose an attention-based prediction model as the single-objective predictor. We aim to develop a more accurate and scalable predictor that emphasizes efficiency in high-dimensional DSE.
The training procedure of the attention-based prediction model is demonstrated in Algorithm. 1. The prediction model consists of two key components: embedding preprocessing and the attention-based model. For embedding preprocessing, the procedure involves three steps: (a) Embedding, which transforms the discrete and heterogeneous alternatives of each micro-architectural parameter into a continuous numerical representation, simplifying optimization and enhancing the representation of relationships within the micro-architecture; (b) Position Embedding (PE), which assigns positional encoding to each item in the parameter sequence, enabling the model to learn parameter attributes more effectively and constrain the embedding space of each parameter; and (c) Prediction Token (PT), which gathers information from parameter embeddings using the self-attention mechanism and fuses it through multilayer perceptron (MLP), allowing the model to perceive the entire parameter sequence effectively. As for the attention-based model, to ensure the generalizability and versatility of the model, the predictor includes only vanilla self-attention, MLP, and normalization operations, which are the minimal necessary components of the transformer model (transformer, ). This streamlined design aims to maintain the attention mechanism’s inherent advantages. By focusing on these core components, we can leverage the self-attention mechanism’s ability to capture information within the input design point, allowing for the effective handling of complicated relationships between the design point and performance metrics in high-dimensional DSE tasks. The inclusion of MLP layers provides the model with the capacity to learn complex patterns and representations, while normalization operations ensure stable and efficient training by mitigating issues related to internal covariate shifts.
5.3. Perception-driven Attention Mechanism
Although the prediction time is significantly reduced compared to simulation, further reductions are still necessary, especially when handling the large-scale design spaces of CPUs. Fortunately, from a micro-architectural design perspective, not all micro-architectural parameters are strongly correlated with one another, presenting an opportunity to reduce the computational burden of the attention mechanism significantly. For instance, the fetch buffer is closely related to the fetch width and fetch queue but has only a weak relationship with the writeback width. Therefore, in this section, we introduce the PDA mechanism as an alternative to the vanilla self-attention mechanism to alleviate the computational burden. The PDA mechanism includes two aspects: the micro-architecture serialization method and the sliding window attention mechanism.
In previous work (GPR, ; MoDSE, ; ensemble_learning, ; BOOMExplorer, ), the order of parameters is not a concern. Because GPR (GPR, ; BOOMExplorer, ) relies on the distance and similarity between input data rather than their arrangement order in statistical regression methods. Similarly, in ensemble learning (ensemble_learning, ; MoDSE, ), the training process of multiple weak learners introduces randomness, making the order of parameters irrelevant. To address this challenge in the attention-based predictor, we introduce a serialization approach named Perception-driven Serialization (PDS), aimed at preserving architectural information and laying the groundwork for the sliding window attention technique. This technique employs a graph-based method to delineate relationships among all parameters within each pipeline stage.

An example is illustrated in Fig. 5(a). We chose the Rename stage, shown in Fig. 5(b), as an example, where there are four parameters to be serialized including the free list (F), the rename map (R), the scoreboard (S), and the history buffer (H). The PDS first transfers the micro-architecture into a perceptual graph, which is an undirected graph based on the dataflow among these components, as depicted in Fig. 5(c). In a perceptual graph, vertices represent the parameters within each pipeline stage, while edges denote the datapaths between these components. The edges are categorized into two types: red edges, which connect to other pipeline stages and are labeled as external edges, and black edges, which connect to components within the current pipeline stage and are labeled as internal edges. To quantify the perception of each component, we leverage the perception degree of each parameter in the perceptual graph. The perception degree is calculated as follows:
| (4) |
Here, the internal edges represent the intra-stage perception field, while the external edges represent the inter-stage perception field. After calculating the perception degrees, the sequence of the micro-architecture is determined using the insertion sort algorithm. Parameters with the larger perception degree are inserted into the middle of the sequence as shown in Fig. 5(d). After all the pipeline stages have been serialized, the final vector of the micro-architecture is combined according to the order of the pipeline stages.

After the micro-architecture has been serialized, the vanilla self-attention mechanism can be replaced by the sliding window attention mechanism due to the parameter clusters. Fig. 6 shows an example of attention weight calculation compared with vanilla self-attention and PDA. For vanilla self-attention, every parameter must calculate the attention weight with every other parameter, as shown in Fig. 6(a). To optimize this process, we set the window size to the maximum perception degree among all parameters. In this example, the window size is set to five, as illustrated in Fig. 6(b).
In general, with the help of the PDA, each parameter calculates the attention weight only with its relative parameters. In this way, for a parameter vector of length , the computational complexity is reduced from to . Thus, the PDA approach alleviates the limitations posed by number of parameters, enhances scalability, and reduces the training and inference time of the prediction model.
5.4. Attention-aware Bottleneck Analysis
Bottleneck analysis is a critical step in CPU design, enabling architects to identify the key factors that impact system performance. In this subsection, we propose the ABA algorithm, which equips AttentionDSE with the capability to analyze attention weight heatmaps generated by an attention-based predictor. The ABA algorithm, detailed in Algorithm 2, reveals the intricate relationships between micro-architectural parameters and performance metrics, thus guiding the exploration of design space. This approach ensures that the most influential design parameters are prioritized during optimization, leading to more efficient and effective DSE.
In the attention weight heatmap, each row represents how the current parameter is influenced by other parameters, reflecting the correlations between them. For a particular parameter, the sum of all weights in its corresponding column indicates the overall influence of this parameter on others. Therefore, if the total sum of attention weights in the column corresponding to a certain parameter is minimal for IPC or maximal for Power or Area, we infer that this parameter has a significant impact on the current performance metrics. ABA algorithm then updates the Pareto optimal set by updating the design point based on this bottleneck analysis, ensuring continuous improvement and exploration of the design space.

To clarify the execution process of the ABA algorithm, Fig. 7 illustrates a toy example that demonstrates how the ABA algorithm updates micro-architectural parameters step by step to enhance performance (IPC). Initially, AttentionDSE randomly samples a design point and sends the parameters to the predictor. Based on the attention weight heatmap from the self-attention layer, the ABA algorithm sums all the columns and selects the parameter with the minimal sum as the current performance bottleneck, which in this example is the integer ALUs. The ABA algorithm then increases the number of ALUs from six to eight, improving performance. In the subsequent iteration, the ABA algorithm identifies the instruction queue size as the current bottleneck using the same process. The ABA algorithm increases the queue size from 64 to 80. By strategically adjusting the instruction queue size, the pipeline is provided with a sufficient flow of instructions, further optimizing performance.
6. Experimental Setup
In this section, we introduce the experimental setup used to assess the performance of AttentionDSE.
Simulation. We utilize GEM5 (gem5, ) as the timing-accurate simulator and McPAT (mcpat, ) as the power and area modeling tool. We extend GEM5 using Python to generate different CPU cores with varying configurations. To bolster the credibility of our experiments, we employ SPEC CPU2017 (SPEC2017, ) as the evaluation benchmark. For identifying resource utilization status, we utilize Simpoints (simpoints, ) for each workload evaluation. Each workload is divided into at most 30 clusters, with each cluster containing ten million instructions.
Baselines. Our baselines include the ActBoost (ActBoost, ), the BOOMExplorer (BOOMExplorer, ), and the MoDSE (MoDSE, ). Additionally, we implement ArchExplorer (ArchExplorer, ) for comparison with our ABA algorithm. The baselines represent recent SOTA work. All experiments are conducted on the Out-of-Order (OoO) CPU implemented by Gem5. The design space of the OoO processor is listed in Table 1. The values in the third column are formatted as “start number: end number: stride”. A two-level cache hierarchy with an 8192MB DRAM main memory configuration is employed. The size of the design space exceeds , making exhaustive search impractical.
| Parameters | Description |
|
||||
| Core Frequency |
|
|
||||
| Pipeline Width |
|
1:12:1 | ||||
| Fetch Buffer |
|
16/32/64 | ||||
| Fetch Queue |
|
8:48:4 | ||||
| Branch Predictor | predictor type |
|
||||
| Choice Predictor | choice predictor size | 2048/4096/8192 | ||||
| Global Predictor | global predictor size | 2048/4096/8192 | ||||
| RAS Size | return address stack size | 16:40:2 | ||||
| BTB Size | branch target buffer size | 1024/2048/4096 | ||||
| ROB Size | reorder buffer entries | 32:256:16 | ||||
| Int RF Number |
|
64:256:8 | ||||
| Fp RF Number |
|
64:256:8 | ||||
| Inst Queue |
|
16:80:8 | ||||
| Load Queue |
|
20:48:4 | ||||
| Store Queue |
|
20:48:4 | ||||
| IntALU | number of integer ALUs | 3:8:1 | ||||
| IntMultDiv |
|
1:4:1 | ||||
| FpALU |
|
1:4:1 | ||||
| FpMultDiv |
|
1:4:1 | ||||
| Cacheline | cacheline size | 32/64 | ||||
| L1 ICache Size | size of ICache in KB | 16/32/64 | ||||
| L1 ICache Assoc. |
|
2/4 | ||||
| L1 DCache Size | size of DCache in KB | 16/32/64 | ||||
| L1 DCache Assoc. |
|
2/4 | ||||
| L2 Cache Size | size of L2 Cache in KB | 128/256 | ||||
| L2 Cache Assoc. |
|
2/4 | ||||
| Total size | ||||||
Evaluation Metrics. A DSE framework is evaluated mainly by the accuracy of the predictor and the quality of the final Pareto optimal set.
The accuracy is mainly measured by Mean Absolute Percentage Error (MAPE), which calculates the average absolute percentage difference between real and predicted values. The formula for MAPE is:
| (5) |
where is the number of predicted design points, is the prediction objective value, i.e., IPC, power, or area in corresponding models, and is the real value; MAPE expresses the prediction error as a percentage of the actual values. A lower MAPE indicates better accuracy.
The PHV metric assesses the quality of the Pareto optimal set by quantifying the volume of the objective space dominated by non-dominated solutions. The PHV can be formulated as:
| (6) |
Where is the indicator function, which outputs one if its argument is true and zero otherwise, specifically, if is the newly discovered design that is not dominated by other design points, then the PHV increases. An example is illustrated in Fig.2.
7. Experiment Results
7.1. Overall Analysis
We evaluate the AttentionDSE framework using SPEC CPU 2017 workloads.
7.1.1. Comparison on Pareto Optimal Set Exploration


Fig. 8 provides a more detailed comparison of the Pareto optimal set exploration through different DSE frameworks. Compared to SOTA DSE frameworks, AttentionDSE achieves an average improvement in PHV of 8.3%, 4.1%, and 3.9% across all workloads over ActBoost, BOOMExplorer, and MoDSE, respectively. ArchExplorer employs a similar concept to AttentionDSE, analyzing program bottlenecks and addressing them accordingly. It uses DEG to identify micro-architecture bottlenecks, a process that can take several days. AttentionDSE outperforms ArchExplorer with a 1.3% improvement in PHV. This superiority is due to two main factors: First, AttentionDSE uses an attention mechanism for design point updates and bottleneck identification, accurately pinpointing issues in the architecture. Second, ArchExplorer’s bottleneck analysis is limited by complexity constraints, as it only examines the first hundred thousand lines of code. This partial analysis fails to provide a comprehensive understanding of the program, leading to reduced performance. Note that MoDSE’s exploration using the HVI approach, which searches the entire set to find the next design point, is feasible only in small design spaces. In this experiment, we use a random sampling method for design point search in MoDSE.
|
PHV |
|
|
||||||
|---|---|---|---|---|---|---|---|---|---|
| BOOMExplorer | 36.94 | 64 | 47 (9.4) | ||||||
| MoDSE | 37.04 | 87 | 16 (3.2) | ||||||
| ArchExplorer | 38.57 | \ | 828 (165.6) | ||||||
| AttentionDSE | 39.41 | 15 | 5 (1) |
Note: The experimental results are obtained from IPC-Power optimization on the 600.perlbench_s dataset.
Table 2 shows the exploration results on the 600.perlbench_s dataset across the SOTA DSE frameworks. The “Time” represents the total exploration time of the DSE task. All DSE frameworks, except ArchExplorer, perform a hundred iterations for the Pareto optimal set search. The “Up to 99% PHV Iteration” metric indicates the convergence time of the search, where lower values are better. Experimental results demonstrate that AttentionDSE is 166 faster than ArchExplorer, owing to ArchExplorer’s time-consuming instruction analysis method. Compared to regression-based models, AttentionDSE completes the exploration roughly 10 faster than BOOMExplorer. Even with MoDSE’s use of random sampling, AttentionDSE achieves exploration speeds approximately 3 faster. Additionally, AttentionDSE converges in fewer iterations, reducing iterations by 75% compared to BOOMExplorer and 83% compared to MoDSE, highlighting the efficiency of the ABA algorithm.
Overall, the results demonstrate that AttentionDSE provides significant improvements over existing work, validating the effectiveness of its novel methodologies in DSE.

7.1.2. Comparison on Best Balanced Designs
To study how high-performance designs balance PPA effectively, we select the designs with the highest performance for comparison. The metric we used for this evaluation is , which assesses how well each design balances performance with resource constraints. Fig. 9 gives the results for SPEC CPU 2017, comparing frameworks such as ActBoost, BOOMExplorer, MoDSE, ArchExplorer, and AttentionDSE, with the last bar representing the geometric mean.
Across all metrics, AttentionDSE achieves, on average, the highest performance while maintaining the lowest energy consumption and area overhead, demonstrating the superiority of our methodology. Specifically, as shown in Fig. 9(a), AttentionDSE outperforms the other methods by an average of 13.8%, 6.9%, 7.8%, and 5.6%. Although AttentionDSE does not achieve the highest performance for every workload, as shown in Fig. 9(b), it consistently maintains multi-objective optimality, as shown in Fig. 9(c) and Fig. 9(d), leading to overall optimality across the design space.
7.1.3. Comparison on Single-objective Predictor
An accurate predictor is fundamental to an effective DSE framework. Fig. 10 illustrates the comparison of the prediction models with the SOTA DSE frameworks. Fig. 10(a), (b), and (c) present the MAPE of AttentionDSE compared with three DSE frameworks. For example, AttentionDSE outperforms all workloads, achieving 37.1%, 33.4%, and 31.6% on average for IPC, Power, and Area prediction on MAPE, respectively, compared to the SOTA DSE framework (MoDSE). These results highlight the superiority of AttentionDSE over statistical regression methods. We also conduct experiments using an MLP regression model, as shown in Table 3, to demonstrate the superiority of the attention mechanism.
| Methods \Metrics | MLP | AttentionDSE | ||||
| IPC | Power | Area | IPC | Power | Area | |
| MAPE | 0.0722 | 0.0399 | 0.0274 | 0.034 | 0.028 | 0.017 |
| 0.8755 | 0.9689 | 0.9868 | 0.97 | 0.98 | 0.99 | |
| MSE | 0.0042 | 0.0009 | 0.2510 | 0.00022 | 0.0017 | 0.12 |
Note: The experimental results are obtained on the 600.perlbench_s dataset.
To better demonstrate support for high-dimensional DSE, we carry on additional experiments on the prediction models using the 600.perlbench_s dataset with an increasing number of parameters and varying training set sizes, as shown in Fig. 10(d) and (e). In Fig. 10(d), the bar chart represents the comparison of MAPE, while the line chart indicates the inference time. BOOMExplorer, which uses GPR as the prediction model, struggles to capture effective models in high-dimensional design spaces, resulting in poor generalization performance. When the number of parameters increases to 75, BOOMExplorer fails to capture the relationship between parameters and performance metrics, resulting in a MAPE of 1. On the other hand, although MoDSE shows an acceptable range of MAPE changes, its inference time increases sharply with the number of parameters, making it impractical for high-dimensional DSE. Fig. 10(e) illustrates the training time of each prediction model as it changes with the increase in training set size. High-dimensional design spaces need more training data to capture the relationship between micro-architecture and performance metrics. However, prevailing DSE frameworks face a significant and unacceptable increase in training time as the amount of training data grows. For AttentionDSE, the training time remains stable due to several aspects: first, the predictor in AttentionDSE consists of the minimal necessary components for an attention-based model, ensuring lower training time through its lightweight design; second, AttentionDSE adopts the PDA mechanism, further decreasing computational complexity.
7.2. Optimization Effect Analysis
We further conduct an ablation experiment to demonstrate the effectiveness of the optimizations. We select 600.perlbench_s as the representative dataset, and the results are consistent across other datasets.
7.2.1. Efficiency of Perception-driven Attention Mechanism
To demonstrate the benefits of the PDA mechanism, we conduct experiments to evaluate the training time and memory footprint with varying numbers of parameters, highlighting the PDA mechanism’s superiority in high-dimensional DSE tasks. We set the model depth to ten and observe the impact on both training time and memory usage.
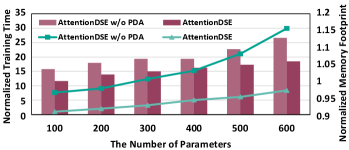
Fig. 11 shows the experiment results, the line chart illustrates the normalized training time, while the bar chart depicts the memory footprint. The training time for models without the PDA mechanism increases exponentially with the size of the design space. For example, when the design space expands sixfold, the training time increases by 30. In contrast, AttentionDSE with the PDA mechanism exhibits relatively stable memory usage as the number of parameters grows. This stability extends to large design spaces because the PDA mechanism only calculates within clusters that contain the most relevant parameters. Regarding memory footprint, in smaller design spaces, memory usage is primarily influenced by fixed data occupation during training. However, attention weights and other learnable parameters in larger design spaces gradually dominate memory usage.

Fig. 12 shows the difference in MAPE introduced by the PDA mechanism. Due to the PDA mechanism clustering the relevant parameters, captured by the sliding window attention technique, the predictive accuracy does not decrease and may even slightly increase. This improvement is primarily due to the enhanced understanding of local information within the pipeline stage provided by PDA. By focusing on parameter interactions within a defined window, PDA captures intricate relationships between parameters, resulting in more accurate predictions.
7.2.2. Analysis on Attention-aware Bottleneck Analysis Algorithm
The superiority of AttentionDSE derives from both its high-accuracy prediction model and the ABA algorithm. To more effectively illustrate the impact of the ABA algorithm and avoid interference from the inaccurate prediction model, we conduct experiments on AttentionDSE by substituting the ABA algorithm with other design point search methods. Due to the large design space in our experiment, exhaustive search methods like MoDSE become impractical. Additionally, methods similar to BOOMExplorer can only be applied to the GPR model. Therefore, we select the random sample search method as the baseline for comparison with the ABA algorithm. Fig. 13 visualizes the PHV curves and ADRS curves across iterations, comparing them with the random sample search method.

Regarding PHV convergence, the ABA algorithm notably achieves a higher PHV early on, consistently surpassing the random sample search method throughout various simulation iterations. Specifically, the ABA algorithm reaches a PHV of 38.2 within one hundred iterations, while the random sample search method requires more than 5 as many iterations to achieve similar levels. This efficiency results from the ABA algorithm’s effective analysis of parameter interactions and their impact on performance metrics, significantly reducing exploration time by 80% and guiding optimal parameter updates for enhanced performance.
Concerning ADRS convergence, it serves to evaluate the quality of estimated Pareto optimal sets in multi-objective optimization by comparing them against the true Pareto set, reflecting the distribution of searched Pareto optimal design points. The ABA algorithm exhibits smoother curves, indicating a more uniform distribution of design points that cover diverse design requirements. In contrast, the random sample search method faces challenges in promptly reaching optimal intervals due to insufficient information on defects in current design points and challenges in selecting subsequent design points based on data distribution.
8. Conclusion
In this paper, we introduced AttentionDSE, a comprehensive DSE framework tailored for high-dimensional design spaces. AttentionDSE seamlessly synergizes the surrogate model with the acquisition function by incorporating the attention mechanism. The innovative PDA mechanism enhances prediction efficiency, while the ABA algorithm offers detailed insights into individual micro-architectural parameter contributions. These advancements improve the design process’s interpretability and minimize the need for expert knowledge. AttentionDSE represents the first attempt to apply attention mechanisms to DSE tasks, showcasing the potential of this approach in optimizing complex design spaces.
References
- [1] Omid Azizi, Aqeel Mahesri, Benjamin C Lee, Sanjay J Patel, and Mark Horowitz. Energy-performance tradeoffs in processor architecture and circuit design: a marginal cost analysis. ACM SIGARCH Computer Architecture News, 38(3):26–36, 2010.
- [2] Chen Bai, Jiayi Huang, Xuechao Wei, Yuzhe Ma, Sicheng Li, Hongzhong Zheng, Bei Yu, and Yuan Xie. Archexplorer: Microarchitecture exploration via bottleneck analysis. In Proceedings of the 56th Annual IEEE/ACM International Symposium on Microarchitecture, pages 268–282, 2023.
- [3] Chen Bai, Qi Sun, Jianwang Zhai, Yuzhe Ma, Bei Yu, and Martin DF Wong. Boom-explorer: Risc-v boom microarchitecture design space exploration framework. In 2021 IEEE/ACM International Conference On Computer Aided Design (ICCAD), pages 1–9. IEEE, 2021.
- [4] Nathan Binkert, Bradford Beckmann, Gabriel Black, Steven K. Reinhardt, Ali Saidi, Arkaprava Basu, Joel Hestness, Derek R. Hower, Tushar Krishna, Somayeh Sardashti, Rathijit Sen, Korey Sewell, Muhammad Shoaib, Nilay Vaish, Mark D. Hill, and David A. Wood. The gem5 simulator. SIGARCH Comput. Archit. News, 39(2):1–7, aug 2011.
- [5] Jannis Born and Matteo Manica. Regression transformer enables concurrent sequence regression and generation for molecular language modelling. Nature Machine Intelligence, 5(4):432–444, 2023.
- [6] Leo Breiman. Random forests. Machine learning, 45:5–32, 2001.
- [7] David Brooks, Pradip Bose, Viji Srinivasan, Michael K Gschwind, Philip G Emma, and Michael G Rosenfield. New methodology for early-stage, microarchitecture-level power-performance analysis of microprocessors. IBM Journal of Research and Development, 47(5.6):653–670, 2003.
- [8] Gecheng Chen and Rui Tuo. Projection pursuit gaussian process regression. IISE Transactions, 55(9):901–911, 2023.
- [9] Tianshi Chen, Qi Guo, Ke Tang, Olivier Temam, Zhiwei Xu, Zhi-Hua Zhou, and Yunji Chen. Archranker: A ranking approach to design space exploration. ACM SIGARCH Computer Architecture News, 42(3):85–96, 2014.
- [10] Tianshi Chen, Qi Guo, Ke Tang, Olivier Temam, Zhiwei Xu, Zhi-Hua Zhou, and Yunji Chen. Archranker: A ranking approach to design space exploration. ACM SIGARCH Computer Architecture News, 42(3):85–96, 2014.
- [11] Shail Dave, Tony Nowatzki, and Aviral Shrivastava. Explainable-dse: An agile and explainable exploration of efficient hw/sw codesigns of deep learning accelerators using bottleneck analysis. In Proceedings of the 28th ACM International Conference on Architectural Support for Programming Languages and Operating Systems, Volume 4, ASPLOS ’23, page 87–107, New York, NY, USA, 2024. Association for Computing Machinery.
- [12] Aryan Deshwal, Syrine Belakaria, Ganapati Bhat, Janardhan Rao Doppa, and Partha Pratim Pande. Learning pareto-frontier resource management policies for heterogeneous socs: An information-theoretic approach. In 2021 58th ACM/IEEE Design Automation Conference (DAC), pages 607–612. IEEE, 2021.
- [13] Xibin Dong, Zhiwen Yu, Wenming Cao, Yifan Shi, and Qianli Ma. A survey on ensemble learning. Frontiers of Computer Science, 14:241–258, 2020.
- [14] David L Donoho. High-dimensional data analysis: The curses and blessings of dimensionality. AMS math challenges lecture, 1(2000):32, 2000.
- [15] Brian Fields, Shai Rubin, and Rastislav Bodik. Focusing processor policies via critical-path prediction. In Proceedings of the 28th annual international symposium on Computer architecture, pages 74–85, 2001.
- [16] Peter I Frazier. A tutorial on bayesian optimization. arXiv preprint arXiv:1807.02811, 2018.
- [17] Junyu Gao, Qi Wang, and Yuan Yuan. Scar: Spatial-/channel-wise attention regression networks for crowd counting. Neurocomputing, 363:1–8, 2019.
- [18] Greg Hamerly, Erez Perelman, Jeremy Lau, and Brad Calder. Simpoint 3.0: Faster and more flexible program phase analysis. Journal of Instruction Level Parallelism, 7(4):1–28, 2005.
- [19] Mark D Hill and Alan Jay Smith. Evaluating associativity in cpu caches. IEEE Transactions on Computers, 38(12):1612–1630, 1989.
- [20] MS Hrishikesh, Doug Burger, Norman P Jouppi, Stephen W Keckler, Keith I Farkas, and Premkishore Shivakumar. The optimal logic depth per pipeline stage is 6 to 8 fo4 inverter delays. ACM SIGARCH Computer Architecture News, 30(2):14–24, 2002.
- [21] Tejas S Karkhanis and James E Smith. Automated design of application specific superscalar processors: an analytical approach. In Proceedings of the 34th annual international symposium on computer architecture, pages 402–411, 2007.
- [22] Benjamin C Lee and David M Brooks. Illustrative design space studies with microarchitectural regression models. In 2007 IEEE 13th International Symposium on High Performance Computer Architecture, pages 340–351. IEEE, 2007.
- [23] Dandan Li, Shuzhen Yao, Yu-Hang Liu, Senzhang Wang, and Xian-He Sun. Efficient design space exploration via statistical sampling and adaboost learning. In Proceedings of the 53rd Annual Design Automation Conference, pages 1–6, 2016.
- [24] Sheng Li, Jung Ho Ahn, Richard D Strong, Jay B Brockman, Dean M Tullsen, and Norman P Jouppi. Mcpat: An integrated power, area, and timing modeling framework for multicore and manycore architectures. In Proceedings of the 42nd annual ieee/acm international symposium on microarchitecture, pages 469–480, 2009.
- [25] Giovanni Mariani, Aleksandar Brankovic, Gianluca Palermo, Jovana Jovic, Vittorio Zaccaria, and Cristina Silvano. A correlation-based design space exploration methodology for multi-processor systems-on-chip. In Proceedings of the 47th Design Automation Conference, DAC ’10, page 120–125, New York, NY, USA, 2010. Association for Computing Machinery.
- [26] Giovanni Mariani, Gianluca Palermo, Vittorio Zaccaria, and Cristina Silvano. Oscar: An optimization methodology exploiting spatial correlation in multicore design spaces. IEEE Transactions on Computer-Aided Design of Integrated Circuits and Systems, 31(5):740–753, 2012.
- [27] Mayan Moudgill, J-D Wellman, and Jaime H Moreno. Environment for powerpc microarchitecture exploration. IEEE Micro, 19(3):15–25, 1999.
- [28] Samuel Naffziger, Noah Beck, Thomas Burd, Kevin Lepak, Gabriel H Loh, Mahesh Subramony, and Sean White. Pioneering chiplet technology and design for the amd epyc™ and ryzen™ processor families: Industrial product. In 2021 ACM/IEEE 48th Annual International Symposium on Computer Architecture (ISCA), pages 57–70. IEEE, 2021.
- [29] Sandeep Navada, Niket K. Choudhary, and Eric Rotenberg. Criticality-driven superscalar design space exploration. In 2010 19th International Conference on Parallel Architectures and Compilation Techniques (PACT), pages 261–272, 2010.
- [30] Chris H Perleberg and Alan Jay Smith. Branch target buffer design and optimization. IEEE transactions on computers, 42(4):396–412, 1993.
- [31] Peter Prettenhofer and Gilles Louppe. Gradient boosted regression trees in scikit-learn. In PyData 2014, 2014.
- [32] Martin Rapp, Hussam Amrouch, Yibo Lin, Bei Yu, David Z Pan, Marilyn Wolf, and Jörg Henkel. Mlcad: A survey of research in machine learning for cad keynote paper. IEEE Transactions on Computer-Aided Design of Integrated Circuits and Systems, 41(10):3162–3181, 2021.
- [33] Thomas J Santner, Brian J Williams, William I Notz, and Brain J Williams. The design and analysis of computer experiments, volume 1. Springer, 2003.
- [34] Robert E Schapire. Explaining adaboost. In Empirical inference: festschrift in honor of vladimir N. Vapnik, pages 37–52. Springer, 2013.
- [35] Bobak Shahriari, Kevin Swersky, Ziyu Wang, Ryan P Adams, and Nando De Freitas. Taking the human out of the loop: A review of bayesian optimization. Proceedings of the IEEE, 104(1):148–175, 2015.
- [36] Hamed Sheidaeian and Omid Fatemi. Toward a general framework for jointly processor-workload empirical modeling. The Journal of Supercomputing, 77:5319–5353, 2021.
- [37] Dimitri P Solomatine and Durga L Shrestha. Adaboost. rt: a boosting algorithm for regression problems. In 2004 IEEE international joint conference on neural networks (IEEE Cat. No. 04CH37541), volume 2, pages 1163–1168. IEEE, 2004.
- [38] Standard Performance Evaluation Corporation. Spec cpu 2017. https://www.spec.org/cpu2017/, 2022.
- [39] Guangyu Sun, Christopher J Hughes, Changkyu Kim, Jishen Zhao, Cong Xu, Yuan Xie, and Yen-Kuang Chen. Moguls: a model to explore the memory hierarchy for bandwidth improvements. Acm Sigarch Computer Architecture News, 39(3):377–388, 2011.
- [40] K Vanaja and RH Shobha Rani. Design of experiments: concept and applications of plackett burman design. Clinical research and regulatory affairs, 24(1):1–23, 2007.
- [41] Ashish Vaswani, Noam Shazeer, Niki Parmar, Jakob Uszkoreit, Llion Jones, Aidan N Gomez, Łukasz Kaiser, and Illia Polosukhin. Attention is all you need. Advances in neural information processing systems, 30, 2017.
- [42] Duo Wang, Mingyu Yan, Yihan Teng, Dengke Han, Haoran Dang, Xiaochun Ye, and Dongrui Fan. A transfer learning framework for high-accurate cross-workload design space exploration of cpu. In 2023 IEEE/ACM International Conference on Computer Aided Design (ICCAD), pages 1–9, 2023.
- [43] Duo Wang, Mingyu Yan, Yihan Teng, Dengke Han, Xin Liu, Wenming Li, Xiaochun Ye, and Dongrui Fan. Modse: A high-accurate multi-objective design space exploration framework for cpu microarchitectures. IEEE Transactions on Computer-Aided Design of Integrated Circuits and Systems, 2023.
- [44] Duo Wang, Mingyu Yan, Yihan Teng, Dengke Han, Xiaochun Ye, and Dongrui Fan. A high-accurate multi-objective ensemble exploration framework for design space of cpu microarchitecture. In Proceedings of the Great Lakes Symposium on VLSI 2023, GLSVLSI ’23, page 379–383, New York, NY, USA, 2023. Association for Computing Machinery.
- [45] Hongwei Wang, Jinglin Shi, and Ziyuan Zhu. An expected hypervolume improvement algorithm for architectural exploration of embedded processors. In Proceedings of the 53rd Annual Design Automation Conference, pages 1–6, 2016.
- [46] Christopher Williams and Carl Rasmussen. Gaussian processes for regression. Advances in neural information processing systems, 8, 1995.
- [47] Kai Yu, Jinbo Bi, and Volker Tresp. Active learning via transductive experimental design. In Proceedings of the 23rd international conference on Machine learning, pages 1081–1088, 2006.
- [48] Dawei Zhan and Huanlai Xing. Expected improvement for expensive optimization: a review. Journal of Global Optimization, 78(3):507–544, 2020.