figure \MakeSortedtable
Multi Anchor Point Shrinkage for the Sample Covariance Matrix (Extended Version)
Abstract
Portfolio managers faced with limited sample sizes must use factor models to estimate the covariance matrix of a high-dimensional returns vector. For the simplest one-factor market model, success rests on the quality of the estimated leading eigenvector “beta”.
When only the returns themselves are observed, the practitioner has available the “PCA” estimate equal to the leading eigenvector of the sample covariance matrix. This estimator performs poorly in various ways. To address this problem in the high-dimension, limited sample size asymptotic regime and in the context of estimating the minimum variance portfolio, Goldberg, Papanicolau, and Shkolnik (Goldberg et al., [2021]) developed a shrinkage method (the “GPS estimator”) that improves the PCA estimator of beta by shrinking it toward the target unit vector .
In this paper we continue their work to develop a more general framework of shrinkage targets that allows the practitioner to make use of further information to improve the estimator. Examples include sector separation of stock betas, and recent information from prior estimates. We prove some precise statements and illustrate the resulting improvements over the GPS estimator with some numerical experiments.
Acknowledgement: The authors thank Lisa Goldberg and Alex Shkolnik for helpful conversations. Any remaining errors are our own.
Last revision: September 9, 2021
1 Introduction
This paper is about the problem of estimating covariance matrices for large random vectors, when the data for estimation is a relatively small sample. We discuss a shrinkage approach to reducing the sampling error asymptotically in the high dimensional, bounded sample size regime, denoted HL. We note at the outset that this context differs from that of the more well-known random matrix theory of the asymptotic “HH regime” in which the sample size grows in proportion to the dimension (e.g. El Karoui, [2008]). See Hall et al., [2005] for earlier discussion of the HL regime, and Fan et al., [2008] for a discussion of the estimation problem for factor models in high dimension.
Our interest in the HL asymptotic regime comes from the problem of portfolio optimization in financial markets. There, a portfolio manager is likely to confront a large number of assets, like stocks, in a universe of hundreds or thousands of individual issues. However, typical return periods of days, weeks, or months, combined with the irrelevance of the distant past, mean that the useful length of data time series is usually much shorter than the dimension of the returns vectors being estimated.
In this paper we extend the successful shrinkage approach introduced in Goldberg et al., [2021] (GPS) to a framework that allows the user to incorporate additional information into the shrinkage target and improve results. Our “multi anchor point shrinkage” (MAPS) approach includes the GPS method as a special case, but improves results when some a priori order information about the betas is known.
The problem of sampling error for portfolio optimization has been widely studied ever since Markowitz, [1952] introduced the approach of mean-variance optimization. That paper immediately gave rise to the importance of estimating the covariance matrix of asset returns, as the risk, measured by variance of returns, is given by , where is the vector of weights defining the portfolio.
For a survey of various approaches over the years, see Goldberg et al., [2021] and references therein. Reducing the number of parameters via factor models has long been standard; see for example Rosenberg, [1974] and Ross, [1976]. Vasicek, [1973] and Frost and Savarino, [1986] initiated a Bayesian approach to portfolio estimation and the efficient frontier. Vasicek used a prior cross-sectional distribution for betas to produce an empirical Bayes estimator for beta that amounts to shrinking the least-squares estimator toward the prior in an optimal way. This is one of a number of “shrinkage” approaches in which initial sample estimates of the covariance matrix are “shrunk” toward a prior e.g. Lai and Xing, [2008], Bickel and Levina, [2008], Ledoit and Wolf, [2003], Ledoit and Wolf, [2004], Fan et al., [2013]. Ledoit and Wolf, [2017] describes a nonlinear shrinkage of the covariance matrix focused on correcting the eigenvalues, set in the HH asymptotic regime.
The key insight of Goldberg et al., [2021] was to identify the PCA leading eigenvector of the sample covariance matrix as the primary culprit contributing to sampling error for the minimum variance portfolio problem in the HL asymptotic regime. Their approach to eigenvector shrinkage is not explicitly Bayesian, but can be viewed in that spirit. This is the starting point for the present work.
1.1 Mathematical setting and background
Next we describe the mathematical setting, motivation, and results in more detail. We restrict attention to a familiar and well-studied baseline model for financial returns: the one-factor, or “market”, model
| (1) |
where is a -dimensional random vector of asset (excess) returns in a universe of assets, is an unobserved non-zero vector of parameters to be estimated, is an unobserved random variable representing the common factor return, and is an unobserved random vector of residual returns.
With the assumption that the components of are uncorrelated with and each other, the returns of different assets are correlated only through , and therefore the covariance matrix of is
where denotes the variance of , and is the diagonal covariance matrix of .
Under the further simplifying model assumption111The assumption of homogeneous residual variance is a mathematical convenience. If the diagonal covariance matrix of residual returns can be reasonably estimated, then the problem can be rescaled as , which has covariance matrix , where . that each component of has a common variance (also not observed), we obtain the covariance matrix of returns
| (2) |
where denotes the identity matrix.
This means that , or its normalization , is the leading eigenvector of , corresponding to the largest eigenvalue . As estimating becomes the most significant part of the estimation problem for , a natural approach is to take as an estimate the first principal component (leading unit eigenvector) of the sample covariance of returns data generated by the model. This principal component analysis (PCA) estimate is our starting point.
Consider the optimization problem
where , the vector of all ones.
The solution, the “minimum variance portfolio”, is the unique fully invested portfolio minimizing the variance of returns. Of course the true covariance matrix is not observable and must be estimated from data. Denote an estimate by
| (3) |
corresponding to estimated parameters , , and .
Let denote the solution of the optimization problem
It is interesting to compare the estimated minimum variance
with the actual variance of :
and consider the variance forecast ratio as one measure of the error made in the estimation of minimum variance, hence of the covariance matrix .
The remarkable fact proved in Goldberg et al., [2021] is that, asymptotically as tends to infinity, the true variance of the estimated portfolio doesn’t depend on , , or , but only on the unit eigenvector . Under some mild assumptions stated later, they show the following.
Definition 1.1.
For a -vector , define the mean and dispersion of by
| (4) |
We use the notation for normalized vectors
Proposition 1.1 (Goldberg et al., [2021]).
The true variance of the estimated portfolio is given by
where is defined by
and where the remainder is such that for some constants , for all sufficiently large.
In addition, the variance forecast ratio is asymptotically equal to .
Goldberg, Papanicolaou and Shkolnik call the quantity the optimization bias associated to an estimate of the true vector . They note that the optimization bias is asymptotically bounded above zero almost surely, and hence the variance forecast ratio explodes as .
With this background, the estimation problem becomes focused on finding a better estimate of from an observed time series of returns. GPS Goldberg et al., [2021] introduces a shrinkage estimate for – the GPS estimator – obtained by “shrinking” the PCA eigenvector along the unit sphere toward , to reduce excess dispersion. That is, is obtained by moving a specified distance (computed only from observed data) toward along the spherical geodesic connecting and . “Shrinkage” refers to the reduced geodesic distance to the “shrinkage target” .
The GPS estimator is a significant improvement on . First, tends to zero with , and in fact is bounded (proved in Gurdogan, [2021]). In Goldberg et al., [2021] it is conjectured, with numerical support, that is bounded in , and hence the expected variance forecast ratio remains bounded. Moreover, asymptotically is closer than to the true value in the norm; and it yields a portfolio with better tracking error against the true minimum variance portfolio.
1.2 Our contributions
The purpose of this paper is to generalize the GPS estimator by introducing a way to use additional information about beta to adjust the shrinkage target in order to improve the estimate.
We can consider the space of all possible shrinkage targets as determined by the family of all nontrivial proper linear subspaces of as follows. Given (assumed not orthogonal to ), let the unit vector be the normalized projection of onto . is then a shrinkage target for determined by (and ). We will describe such a subspace as the linear span of a set of unit vectors called “anchor points”. In the case of a single anchor point , note that , so this case corresponds to the GPS shrinkage target.
The “MAPS” estimator is a shrinkage estimator with a shrinkage target defined by an arbitrary collection of anchor points, usually including . When is the only anchor point, the MAPS estimator reduces to the GPS estimator. We can therefore think of the MAPS approach as allowing for the incorporation of additional anchor points when this provides additional information.
In Theorem 2.2, we show that expanding by adding additional anchor points at random asymptotically does no harm, but makes no improvement.
In Theorem 2.3, we show that if the user has certain mild a priori rank ordering information about groups of components of , even with no information about magnitudes, an appropriately constructed MAPS estimator converges exactly to the true vector in the asymptotic limit.
Theorem 2.4 shows that if the betas have positive serial correlation over recent history, then adding the prior PCA estimator as an anchor point improves the error in comparison with the GPS estimator, even if the GPS estimator is computed with the same total data history.
The benefit of improving the error in addition to the optimization bias is that it also allows us to reduce the tracking error of the estimated minimum variance fully invested portfolio, discussed in Section 3 and Theorem 3.1.
2 Main Theorems
2.1 Assumptions and Definitions
We consider a simple random sample history generated from the basic model (1). The sample data can be summarized as
| (5) |
where holds the observed individual (excess) returns of assets for a time window that is set by consecutive observations. We may consider the observables to be generated by non-observable random variables , and .
The entries of are the market factor returns for each observation time; the entries of are the specific returns for each asset at each time; the entries of are the exposure of each asset to the market factor, and we interpret as random but fixed at the start of the observation window of times and remaining constant throughout the window. Only is observable.
In this paper we are interested in asymptotic results as tends to infinity with fixed. Therefore we consider equation (5) as defining an infinite sequence of models, one for each .
To specify the relationship between models with different values of , we need a more precise notation. We’ll let refer to an infinite sequence , and the vector obtained by truncation after entries. When the value is understood or implied, we will frequently drop the superscript and write for .
Similarly, is a vector of sequences (the columns), and is obtained by truncating the sequences at .
With this setup, passing from to amounts to simply adding an additional asset to the model without changing the existing assets. The th model is denoted
but for convenience we will often drop the superscript in our notation when there is no ambiguity, in favor of equation (5).
Let and denote the mean and dispersion of , given by
| (6) |
We make the following assumptions regarding , and :
-
A1.
(Regularity of beta) The entries of are uniformly bounded, independent random variables, fixed at time 1. The mean and dispersion converge to limits and .
-
A2.
(Independence of beta, X, Z) , and are jointly independent of each other.
-
A3.
(Regularity of X) The entries of are iid random variables with mean zero, variance .
-
A4.
(Regularity of Z) The entries of have mean zero, finite variance , and uniformly bounded fourth moment. In addition, the -dimensional rows of are mutually independent, and within each row the entries are pairwise uncorrelated.222Note we do not assume , or are Normal or belong to any specific family of distributions.
We carry out our analysis with the projection of the vectors on the unit sphere . To that end we define
| (7) |
where , and denotes the usual Euclidean norm. With the given assumptions the covariance matrix of , conditional on , is
| (8) |
Since stays constant over the observations, the sample covariance matrix converges to almost surely if is taken to , and is the maximum likelihood estimator of .
Since is a leading eigenvector of (corresponding to the largest eigenvalue), then the PCA estimator (the unit leading eigenvector of the sample covariance matrix ) is a natural estimator of . (We always select the choice of unit eigenvector such that .)
Since and only appear in the model as a product, there is a scale ambiguity that we can resolve by combining their scales into a single parameter :
It is easy to verify that
and therefore by our assumptions tends to a positive, finite limit as .
Our covariance matrix becomes
| (9) |
where we drop the superscript when convenient. The scalars and the unit vector are to be estimated by , , and . As described above, asymptotically only the estimate of will be significant. Improving this estimate is the main technical goal of this paper.
In Goldberg et al., [2021] the PCA estimate is replaced by an estimate that is “data driven”, meaning that it is computable solely from the observed data . We henceforth use the notation , for a reason that will be clear shortly. As an intermediate step we also consider a non-observable “oracle” version , defined as the orthogonal projection in of onto the geodesic joining to . The oracle version is not data driven because it requires knowledge of the unobserved vector that we are trying to estimate, but it is a useful concept in the definition and analysis of the data driven version. Both the data driven estimate and the oracle estimate can be thought of as obtained from the eigenvector via “shrinkage” along the geodesic connecting to the anchor point, .
The GPS data-driven estimator is successful in improving the variance forecast ratio, and in arriving at a better estimate of the true variance of the minimum variance portfolio. In this paper we have the additional goal of reducing the error of the estimator, which, for example, is helpful in reducing tracking error. To that end, we introduce the following new data driven estimator, denoted .
Let denote a nontrivial proper linear subspace of . We will sometimes drop the dimension from the notation. Denote by the dimension of , with .
Let denote the normalized leading eigenvector of , its largest eigenvalue, and the average of the remaining eigenvalues. Then we define the data driven “MAPS” (Multi Anchor Point Shrinkage) estimator by
| (10) |
and
| (11) |
is the relative gap between and .
Lemma 2.1 (Goldberg et al., [2021]).
The limits
exist almost surely, and
When is the one-dimensional subspace spanned by the vector , then is precisely the GPS estimator , located along the spherical geodesic connecting to . The phrase “multi anchor point” comes from thinking of as an “anchor point” shrinkage target in the GPS paper, and as a subspace spanned one or more anchor points. The new shrinkage target determined by is the normalized orthogonal projection of onto . When is the one-dimensional subspace spanned by , the normalized projection of onto is just itself. In the event that is orthogonal to , the MAPS estimator reverts to itself.
2.2 The MAPS estimator with random extra anchor points
Does adding anchor points to create a MAPS estimator from a higher-dimensional subspace improve the estimation? The answer depends on whether there is any relevant information in the added anchor points.
We need the concept of a random linear subspace of . Let be a positive integer such that . Let be an -valued random variable, where denotes the orthogonal group in . Let denote the standard Cartesian basis of .
We say that is a random linear subspace of with dimension if, for some as above,
where denotes the linear span of a set of vectors in .
We say is independent of a random variable if the generator is independent of . Moreover, we say is a Haar random subspace of if it is a random linear subspace as above, and the random variable induces the (uniform) Haar measure on .
Definition 2.1.
A non-decreasing sequence of positive integers is square root dominated if
For example, any non-decreasing sequence satisfying for is square root dominated.
Theorem 2.2.
Let the assumptions 1,2,3 and 4 hold. Suppose, for each , is a random linear subspace and is a Haar random subspace of . Suppose also that and are independent of and , and the sequences and are square root dominated.
Let and .
Then, almost surely,
| (12) | |||||
| (13) | |||||
| (14) |
Theorem 2.2 says adding random anchor points to form a MAPS estimator does no harm, but also makes no improvement asymptotically. Equation (13) says that the GPS estimator is neither improved nor harmed by adding extra anchor points uniformly at random. Therefore the goal will be to find useful anchor points that take advantage of additional information that might be available.
2.3 The MAPS estimator with rank order information about the entries of beta
As with stocks grouped by sector, it may be that the betas can be separated into ordered groups, where the rank ordering of the groups is known, but not the ordering within groups. This turns out to be enough information for the MAPS estimator to converge asymptotically to the true value almost surely.
Definition 2.2.
For any , let be a partition of the index set (i.e. a collection of pairwise disjoint non-empty subsets, called atoms, whose union is ). The number of atoms of is denoted by .
We say the sequence of partitions is semi-uniform if there exists such that for all ,
| (15) |
In other words, no atom is larger than a multiple of the average atom size.
Given , we say is -ordered if, for each distinct , either or .
Definition 2.3.
For any define a unit vector by
| (16) |
where denotes the indicator function of . We may then define, for any partition , an induced linear subspace of by
| (17) |
Theorem 2.3.
Let the assumptions 1,2,3 and 4 hold. Consider a semi-uniform sequence of -ordered partitions such that the sequence tends to infinity and is square root dominated. Then
| (18) |
Theorem 2.3 says that if we have certain prior information about the ordering of the elements in the sense of finding an ordered partition (but with no prior information about the magnitudes of the elements or their ordering within partition atoms), then asymptotically we can estimate exactly.
Having in hand a genuine ordered partition a priori is likely only approximately possible in the real world. Theorem 2.3 is suggestive that even partial grouped order information about the betas can be helpful in strictly improving the GPS estimate. This is confirmed empirically in section 4.
The next theorem shows that even with no a priori information beyond the observed time series of returns, we can still use MAPS to improve the GPS estimator.
2.4 A data-driven dynamic MAPS estimator
In the analysis above we have treated as a constant throughout the sampling period, but in reality we expect to vary slowly over time. To capture this in a simple way, let’s now assume that we have access to returns observations for assets over a fixed number of periods. The first periods we call the first (or previous) time block, and the second periods the second (or current) time block. We then have returns matrices corresponding to the two time blocks, and the full returns matrix over the full set of observation times.
Define the sample covariance matrices as , , and , respectively. Let denote the respective (normalized) leading eigenvectors (PCA estimators) of . (Of the two choices of eigenvector, we always select the one having non-negative inner product with .)
Instead of a single for the entire observation period, we suppose there are random vectors and that enter the model during the first and second time blocks, respectively, and are fixed during their respective blocks. We assume both and satisfy assumptions (1) and (2) above, and denote by and the corresponding normalized vectors. The vectors and should not be too dissimilar in the mild sense that .
Definition 2.4.
Define the co-dispersion and pointwise correlation of and by
and
The Cauchy-Schwartz inequality shows . Furthermore, it is straightforward to verify that
| (19) |
and hence , and have limits , and as .
Our motivation for this model is the intuition that the betas for different time periods are noisy representations of a fundamental beta, and that the beta from a recent time block provides some useful information about beta in the current time block. To make this precise in support of the following theorem, we make the following additional assumptions.
-
A5.
[Relation between and ] Almost surely, , , , and exists.
Theorem 2.4.
Assume , , satisfy assumptions 1-5. Denote by and the GPS estimators for and , respectively, i.e. the current (single) and previous plus current (double) time blocks. Let and be the PCA estimators for and , respectively.
Let and define a MAPS estimator for the current time block as
| (20) |
Then, almost surely,
-
(a)
(21) -
(b)
If almost surely,
(22)
Theorem 2.4 says that the MAPS estimator obtained by adding the PCA estimator from the previous time block as a second anchor point outperforms the GPS estimator asymptotically, as measured by error, even if the latter estimated with the full (double) data set. This works when the previous time block carries some information about the current beta (non-zero correlation). In the case of perfect correlation the two betas are equal, and we then return to the GPS setting where beta is assumed constant, so no improved performance is expected.
The cost of implementing this “dynamic MAPS” estimator is comparable to that of the GPS estimator, so should generally be preferred when no rank order information is available for beta.
3 Tracking Error
Our task has been to estimate the covariance matrix of returns for a large number of assets but a short time series of returns observations.
Recall that for the returns model (1), under the given assumptions, we have the true covariance matrix
where and are positive constants and is a unit -vector, and we are interested in corresponding estimates , , and that define an estimator
The theorems above are about finding an estimator of that asymptotically controls the error . We are ignoring and because of Proposition 1.1, showing that the true variance of the estimated minimum variance portfolio , and the variance forecast ratio, are asymptotically controlled by via the optimization bias
We now turn to another important measure of portfolio estimation quality: the tracking error.
Recall that denotes the true minimum variance portfolio using , and is the minimum variance portfolio using the estimated covariance matrix .
Definition 3.1.
The (true) tracking error associated to is defined by
| (23) |
Definition 3.2.
Given the notation above, define the eigenvector bias associated to a unit leading eigenvector estimate as
Theorem 3.1.
Let be an estimator of such that as (such as a GPS or MAPS estimator). Then the tracking error of is asymptotically (neglecting terms of higher order in ) given by
| (24) |
where
and is a constant depending only on , , and .
We consider what this theorem means for various estimators . For the PCA estimate, it was already shown in Goldberg et al., [2021] that is asymptotically bounded below, and hence so is the tracking error.
On the other hand, tends to zero as . In addition Goldberg et al., [2021] shows that
almost surely, while Gurdogan, [2021] shows
and we conjecture the same is true for the more general estimator .
This implies the leading terms, asymptotically, are
Note here the estimated parameters and have dropped out, with the tracking error asymptotically controlled by the eigenvector estimate alone.
Theorem 3.1 helps justify our interest in the error results of Theorems 2.3 and 2.4. Reducing the error of the estimate controls the second term of the asymptotic estimate for tracking error. We therefore expect to see improved total tracking error when we are able to make an informed choice of additional anchor points in forming the MAPS estimator. This is borne out in our numerical experiments described in Section 4.
Proof of Theorem 3.1
Lemma 3.2.
There exists , depending only on , , and , such that for any sufficiently large, and any linear subspace of that contains ,
where is the MAPS estimator determined by .
The Lemma follows from the fact that , and is proved for the case using the definitions and the known limits
| (25) | |||||
| (26) | |||||
| (27) |
From the Lemma and equation (26), we may assume without loss of generality that is an asymptotic lower bound for both and .
Next, we recall it is straightforward to find explicit formulas for the minimum variance portfolios and :
and
We may use these expressions to obtain an explicit formula for the tracking error:
We now estimate the two terms on the right hand side separately.
(1) For the first term , it is convenient to introduce the notation
and since
both and are of order .
A straightforward computation verifies that
| (28) | |||||
| (29) |
We then obtain
| (30) | |||||
| (31) |
where .
Since asymptotically is bounded below and , the third term is of order and can be dropped. We thus obtain the asymptotic estimate
Multiplying by and using the bounds on and the limit of , we obtain
where is the constant defined in the statement of the theorem.
(2) We now turn to the second term .
Using the definitions of and and the fact that , are of order , after a calculation we obtain, to lowest order in ,
| (32) |
Since , we may neglect the second term, and putting (1) and (2) together yields
4 Simulation Experiments
To illustrate the previous theorems, we present the results of numerical experiments showing the improvement that MAPS estimators can bring in estimating the covariance matrix. To approximate the asymptotic regime, in these experiments we use stocks.
The Python code used to run these experiments and create the figures is available at
https://github.com/hugurdog/MAPS_NumericalExperiments.
4.1 Simulated betas with correlation
First we set up a test bed consisting of a double block of data where we can control the beta correlation. Set . We generate observations for , according to the market model of Equation (1):
| (33) |
for unobserved market returns and unobserved asset specific returns for each time window of data.
Here the matrices and represent the previous and current block of consecutive excess returns, respectively, and are obtained from Equation (33) by randomly generating , and :
-
•
the market returns are an iid random sample drawn from a normal distribution with mean 0 and variance ,
-
•
the asset specific returns and are i.i.d. normal with mean and variance , and
-
•
the -vectors and are drawn independently of and from a normal distribution with mean and variance and with pointwise correlation for a range of values of specified below.333exact recipe for here.
The true covariance matrix of the most recent returns is
| (34) |
which we wish to estimate by
| (35) |
Following the lead of Goldberg et al., [2021], we fix
| (36) |
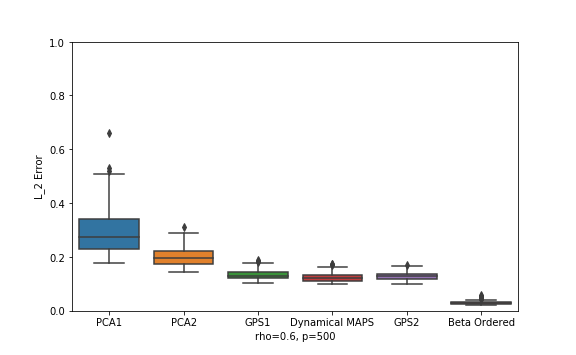
and vary only the estimator of . In our numerical experiments we compare performance for the following choices of :
-
1.
the PCA estimator on the single block (PCA1)
-
2.
the PCA estimator on the double block (PCA2)
-
3.
, the GPS estimator on the single block (GPS1)
-
4.
the dynamical MAPS estimator defined on the double block of data by the equation (18).(Dynamical MAPS)
-
5.
, the GPS estimator on the double block (GPS2)
-
6.
is the MAPS estimator on single block where is a beta ordered uniform partition constructed by using the ordering of the entries of and where the number of atoms in each partition is set to 8, which is approximately .444The largest 479 beta values are partitioned into 7 groups of 71, and the three lowest values form the eighth partition atom. (Beta Ordered MAPS)
We report the performance of each of these estimators according to the following two metrics:
-
•
The error between the true normalized beta of the current data block and the estimated version .
-
•
The tracking error between the true and estimated minimum variance portfolios and
(37)
Results of the comparison are displayed below for values of the pointwise correlation selected from . For each choice of , the experiment was run 100 times, resulting in 100 and tracking error values each. These values are summarized using standard box-and-whisker plots generated in Python using the package matplotlib.pyplot.boxplot.
Figure 1 shows the error for different estimators (in the same order, left to right, as listed above) for the case . The worst performer is the single block PCA. (It is independent of since it doesn’t see the earlier data at all.) Double block PCA is a little better, but the other estimators are far better. Since GPS effectively assumes that the betas have perfect serial correlation, it’s not surprising that the double block GPS does slightly worse than the single block in this case. The best estimator is the MAPS estimator with prior information about group ordering. Assuming no such information is available, the GPS2 and Dynamical MAPS estimators are about tied for best.
Figure 2 shows the results for in smaller size for visual comparison. Throughout the range, the dynamical MAPS estimator outperforms all the other purely data-driven estimators, but the beta-ordered MAPS estimator remains in the lead.
Figure 3 presents the results for tracking error, reported as . Results are similar to the error, but stronger. Again, the dynamical MAPS estimator does best among all methods that don’t use order information, and the beta ordered MAPS estimator is significantly better than all others. Figure 4 displays tracking error outcomes for a range of correlation values .
We conclude from these experiments the dynamical MAPS estimator is best when the only the returns are available, and the beta ordered MAPS estimator is preferred when rank order information on the betas is available.


4.2 Simulations with historical betas
In this section we use historical betas rather than randomly generated ones to test the quality of some MAPS estimators. We use 24 historical monthly CAPM betas for each of the S&P 500 firms provided by WRDS555Wharton Research Data Services, wrds-www.wharton.upenn.edu between the dates 01/01/2018 and 11/30/2020. We denote these betas as . We will have two different mechanism of generating observations of the market model for the single and double data block test beds.
4.2.1 Single Data Block
The WRDS beta suite estimates beta each month from the prior 12 monthly returns. Hence we generate sequential observations of the market model for each beta separately,
| (38) |
with the unobserved market return and the asset specific return generated using the same settings as in the previous section.
For each this produces a returns matrix from which we can derive the following four estimators of :
-
1.
, the PCA estimator of . (PCA)
-
2.
the GPS estimator of . (GPS)
-
3.
, the MAPS estimator of , where is a sector partitioning of the indices in which each atom in the partition contains the indices of one of the 11 sectors in the market666The 11 sectors of the Global Industry Classification Standard are: Information Technology, Health Care, Financials, Consumer Discretionary, Communication Services, Industrials, Consumer Staples, Enery, Utilities, Real Estate, and Materials.. This is one possible data-driven proxy for the beta-ordered uniform partition. (Sector Separated)
-
4.
, the MAPS estimator of where is a beta ordered uniform partition with 11 atoms constructed by using the true ordering of the entries of . (Beta Ordered)
For each of these four choices of estimator , we examine three different measures of error: the squared error , the scaled squared tracking error , and the scaled optimization bias .
Since we are interested in expected outcomes, we repeat the above experiment 100 times, and take the average of the errors as a monte carlo estimate of the expectations
once for each . We then display box plots for the resulting distribution of 24 expected errors of each type, corresponding to the 24 historical betas.
Figure 5 shows a similar story for all three error measures. The GPS estimator significantly outperforms the PCA estimator, and the Beta Ordered estimator, which assumes the ability to rank order partition the betas, is significantly the best.
The result of more interest is that a sector partition approximates a beta ordered partition well enough to improve on the GPS estimate. This approach takes advantage of the fact that betas of stocks in a common sector tend on average to be closer to each other than to betas in other sectors. The Sector Separated MAPS estimator does not require any information not easily available to the practitioner, and so represents a costless improvement on the GPS estimation method.


4.2.2 Double Data Block
In order to test the dynamical MAPS estimator that is designed to take advantage of serial correlation in the betas, we will generate a test bed of double data blocks of simulated market observations using the 24 WRDS historical betas for the same time period as before.
For each , we generate 12 simulated monthly market returns for and according to
| (39) |
| (40) |
were and are generated independently as before.
This provides, for each , two “single block” returns matrices and each covering 12 months, and a combined “double block” returns matrix containing 24 consecutive monthly returns of the stocks.
The estimation problem, given observation of the double block of data , is to estimate the normalized beta vector corresponding to the most recent 12 months. This estimate then implies an estimated covariance matrix for that 12 month period according to equations (35) and (36), and allows us to measure the estimation error as before.
We compare the following estimators:
-
•
, the PCA estimator of .
-
•
, the PCA estimator of the double block .
-
•
the GPS estimator of .
-
•
the GPS estimator of .
-
•
the dynamical MAPS estimator defined on the double block by Equation (20).
We will report our results using the same three error metrics as before: , , for each of the five estimators. To obtain estimated expectations, we repeat the experiments 100 times and compute the average. The box plots summarize the distribution of the 12 overlapping double block expected errors.
The experiment shows that the Dynamical MAPS estimator outperforms the others, and illustrates the promise of Theorem 2.4, which is based on the hypothesis that betas exhibit some serial correlation. Another benefit of the Dynamical MAPS approach is to relieve the practitioner from the burden of choosing whether to use a GPS1 or GPS2 estimator when a double block of data is available.


5 Proofs of the Main Theorems
The proofs of the main theorems proceed by means of some intermediate results involving an “oracle estimator”, defined in terms of the unobservable but equal to the MAPS estimator in the asymptotic limit (Theorem 5.1 below). Several technical supporting propositions and lemmas are needed and postponed to Section 6.
5.1 Oracle Theorems
A key tool in the proofs is the oracle estimator , which is a version of but defined in terms of , our estimation target.
Given a subspace of , we define
| (41) |
Here denotes the span of and , and note that if we get , the PCA estimator. A nontrivial example for the selection would be , which generates , the oracle version of the GPS estimator in Goldberg et al., [2021]. The following theorem says that asymptotically the oracle estimator (41) converges to the MAPS estimator (10).
Theorem 5.1.
Let the assumptions 1,2,3 and 4 hold. Suppose be any sequence of random linear subspaces that is independent of the entries of , such that is a square root dominated sequence. Then
| (42) |
Proposition 5.2.
Under the assumptions of Theorem 5.1, let be the PCA estimator, equal to the unit leading eigenvector of the sample covariance matrix. Then, almost surely:
-
1.
,
-
2.
, and
-
3.
In particular, converges asymptotically to .
Proof of the Theorem 5.1:.
Recall from (10) that,
By Lemma 2.1, has an almost sure limit , and hence is bounded in almost surely.
Let be the almost sure set for which the conclusions of Proposition 5.2 hold. Define the notation
and
The proof will follow steps 1-4 below:
-
1.
For every and sub-sequence satisfying
we prove
and
-
2.
For every and sub-sequence satisfying
we use step 1 to prove =0
-
3.
Set . Fix and prove using step 2 that
-
4.
Finish the proof by applying step 2 for all when is set to .
Step 1: Since we have the following immediate implications of Proposition 5.2,
| (43) |
| (44) |
Using the assumption , we update (43) and (44) as,
| (45) |
| (46) |
for the given . We can use (45) on the numerator of to show,
That together with the fact that the denominator of has a limit in implies,
| (47) |
Similarly we can use (46) on the numerator of as,
| (48) |
Also (45) can be used on the denominator of as,
| (49) |
| (50) |
for the given . This completes the step 1.
Step 2: We have the following initial observation,
| (51) |
and using that we get
Given that, in order to show , it suffices to show converges to a scalar multiple of since that scalar clears after normalizing the vectors. To motivate that lets re-write as,
| (52) | ||||
| (53) |
We also have,
| (54) |
Since we have and satisfying (47) and (50) respectively, we have the equations (53) and (54) well defined asymptotically, which is sufficient for our purpose. Hence, from the above argument it is sufficient to show the convergence of to . That is equivalent to showing converges to . We can re-write the associated quantity as,
| (55) |
Using Proposition 5.2 part 3 in (55), it is equivalent to prove
converges to . We re-write it as
| (56) |
Using parts (1) and (2) of Proposition 5.2 and the fact that converges to shows that (56) converges to for the given . This completes step 2.
Step 3: Fix . To show that , it suffices to show that for any sub-sequence there exist a further sub-sequence such that . Let be a subsequence. We have one of the following cases,
or
If it is strictly less than , then we get from the step 2 that . In that case we take the further sub-sequence of equal to .
If it is equal to , then we get a further sub-sequence s.t
. Using this and Proposition 5.2 we get the following,
which implies . Using this on the definition of and the equation (52) we get,
| (57) |
We can now decompose into familiar components via the triangle inequality as follows,
Using (57), we know that the first and the second terms on the right hand side converge to for the given . Since we have and , proving the third term on the right hand side converges to is equivalent to proving
which is true by Proposition 5.2. This completes the step 3.
Step 4: In step 3 we proved the theorem for every . Replacing in step 2 by the whole sequence of indices , we get the theorem for every . These together shows that we have,
which completes the proof of Theorem 5.1. ∎
5.2 Proof of Theorem 2.2
Proof of the Theorem 2.2(a):.
From the definitions of and , and as long as , we have
and therefore
since for all . Applying Theorem 5.1 gives
∎
To prove the remainder of Theorem 2.2 we need the following intermediate result concerning Haar random subspaces, proved in Section 6.
Proposition 5.3.
Suppose, for each , is a (possibly random) point in and is a Haar random subspace of that is independent of . Assume the sequence is square root dominated.
Then
Proof of the Theorem 2.2(b,c):.
Theorem 5.1 is applicable. Hence, it suffices to prove the results for the oracle version of the MAPS estimator.
Since the scalars clear after normalization, it suffices to prove the following assertions,
| (58) |
and
| (59) |
We first consider (58), rewriting the left hand side as
| (60) |
The first term of (60) converges to by setting in Proposition 5.3. Moreover, Propositions 5.3 and 5.2 imply converges to the origin in the norm. Hence we have is converging to in norm. That implies the second term in (60) converges to 0, which in turn proves (58).
Next, rewrite the expression in the assertion (59) as,
| (61) |
Similarly the first term of (61) converges to by Proposition 5.3. Note that 5.3 also applies when we set , and hence converges to the origin in the norm. Hence the basis elements of converge to the basis elements of , which implies the second term of (61) converges to as well. That completes the proof. ∎
5.3 Proof of Theorem 2.3
We need the following lemma.
Lemma 5.4.
Let be a sequence of uniform -ordered partitions such that . Then for we have,
| (62) |
almost surely.
Proof.
To be more precise about , set and denote the defining basis of the corresponding subspace by the orthonormal set .
Then
| (63) |
Now define the random variables , for all . Without loss of generality, . Since the sequence is uniform, there exists such that
| (64) |
Then
| (65) | ||||
| (66) |
The term appearing in (66) is uniformly bounded since the ’s are uniformly bounded. Also, is finite and away from zero asymptotically. Using those together with the fact that we get the limit in (66) equal to for any realization of the random variables . Note that this is stronger than almost sure convergence. ∎
5.4 Proof of Theorem 2.4(a)
The proof of Theorem 2.4 requires the following proposition, from which part (a) of the theorem easily follows. The proof of the proposition, along with the more difficult proof of the the strict inequality of 2.4 (b), appear in Section 6.
Recall that and are the PCA leading eigenvectors of the sample covariance matrices of the returns and , respectively.
Proposition 5.5.
For each there is a vector in the linear subspace generated by and such that almost surely.
Proof of Theorem 2.4(a).
Since and is independent of the asset specific portion of the current block, Theorem 2.1 implies that converges to almost surely in norm. Hence it suffices to establish the result for the oracle versions of the MAPS and the GPS estimators.
6 Supplemental Proofs
This section is devoted to four tasks: proving Proposition 5.2, Proposition 5.3, Proposition 5.5, and part (b) of Theorem 2.4.
6.1 Proof of Proposition 5.2
The following is equation (33) from Goldberg et al., [2021]:
| (73) |
where is the eigenvalue corresponding to and is the right singular vector of . For notational convenience we set
Lemma 6.1 (Goldberg et al., [2021]).
Under the assumptions 1,2,3 and 4 we have
-
1.
,
-
2.
, and
-
3.
almost surely.
We need one more lemma to prepare for the proof of Proposition 5.2. Let denote the th column of . From our assumptions we know
-
•
for each , is an independent set of mean zero random variables, and
-
•
there exists such that for every .
Lemma 6.2.
Let and let be a random unit vector of dimension and independent of . Then
| (74) |
Proof.
For notational convenience set .
Let where . For that, define . Define similarly. We have,
| (75) |
Since ’s are independent and have mean and are independent of ’s, if vector contains an entry equals to , we would get the corresponding term vanish. Hence we continue from the sum in (75) as,
| (76) |
The last inequality in (76) follows by the assumption and an application of the Cauchy-Shawardz inequality
We can continue from (76) withd
| (77) |
completing the proof of Lemma 6.2. ∎
Lemma 6.3.
For each , let be a (possibly random) linear subspace of , with dimension , that is independent of . Assume the sequence is square root dominated. Let denote the th column of .
Then, for any ,
| (78) |
almost surely.
Proof.
Note first that, for any where we have so without loss of generality we can assume for all . Under that assumption, there exist an orthonormal basis of that is independent of . Then we can rewrite the expression in (78) as
| (79) |
Set and observe that depends on the selection of the orthonormal basis but does not. Now see that the lemma 6.2 implies
| (80) |
for each . Using that together with an application of the Cauchy-Shawardz inequality shows,
| (81) |
for any . Reading 81 together with 80, we see that the 81 is true for any and combination including the case . We want to prove,
| (82) |
| (83) |
Note that the event does not depend on the selection of the orthonormal basis. Since is square root dominated, we get
| (84) |
Since the was arbitrary, an application of Borel-Cantelli lemma yields,
∎
Proof of Proposition 5.2:.
Consider and let be an orthonormal basis of . Using (73) and setting , we obtain
| (85) |
We can relate the third term in (85) to Lemma 6.3 as follows,
| (86) |
Using the Cauchy-Schwarz inequality yields
| (87) |
Moreover, since Lemma 6.3 applies to each column of we get,
| (88) |
for any and . By Lemma 6.1, is bounded below, so has a finite limit supremum as goes to infinity. Also, since the vector is orthonormal and is of finite dimension, we obtain
| (89) |
almost surely.
Now we are ready to prove the first part of the proposition 5.2,
| (90) | |||
| (91) | |||
| (92) | |||
| (93) |
Note that we used the Cauchy-Schwarz and Bessel’s inequalities for the transitions from (91) to (92), and (92) to (93), respectively. Using (89) and Lemma 6.1, the right hand side of the inequality (93) converges to zero almost surely.
For the second part of the Propostion, a similar argument shows that
converges to zero almost surely.
6.2 Proof of Proposition 5.3
Two preliminary lemmas are useful.
Lemma 6.4.
Fix an , and positive integers with . For , define the linear subspace of . Let be a fixed vector, and define
Similarly, for a fixed subspace of dimension , we define
For any choice of the nonrandom vector and the nonrandom subspace we have , where denotes Haar measure on .
The lemma asserts that, under the Haar measure, the event that involves the projection of a fixed point on onto a random linear subspace is equivalent to the event that involves the projection of a random point on to a fixed linear subspace.
The proof of this lemma makes use of the fact that Haar measure is invariant under left and right translations, and is omitted.
Lemma 6.5.
For and any linear subspace of dimension , define, as before,
Then we have the following bound depending only on , , and :
where and are the beta function and the incomplete beta function, respectively. Moreover, if is of order for , the bound satisfies
We omit the purely geometric proof, which uses an analysis of volumes of spherical caps and properties of the beta functions.
Proof of the Theorem 5.3..
For the random linear subspace
where is an -valued random variable inducing the Haar measure on , we would like to show
It suffices to show, for any that
| (94) |
Fix an , and define the set
Now consider the event . Since
if we show
then an application of the Borel-Cantelli lemma will establish (94).
To that end, note
| (95) |
For any define the (nonrandom) function . Since is independent of , we have for any
and therefore
On the other hand we have , using the notation of Lemmas 6.4 and 6.5. By the use of those lemmas we obtain a bound on that does not depend on . Hence, using (95), we have
and by an application of Lemma 6.5 we get
∎
6.3 Proof of Proposition 5.5
From now on we will use the shorthand for the quantity .
Also, recall assumption (5): and a.s. Therefore
| (96) |
and
| (97) |
For the proof of Proposition 5.5 we will need three intermediate lemmas.
Lemma 6.6.
For set and impose . Recall and define the following functions:
| (98) |
| (99) |
Then converges to uniformly almost surely as tends to .
Proof.
Notice
| (100) |
By using the proof of Lemma 6.14 on each summand, the first term in the bracket converges to
| (101) |
uniformly almost surely. Hence it suffices to prove that the remaining term converges to uniformly almost surely. We can re-write it as follows,
| (102) |
The first and second term converges to zero uniformly almost surely by an application of Lemma 6.13 and by the fact that the terms and can be uniformly bounded by and , respectively. Also note the third term converges to the desired limit uniformly almost surely. Hence it is left to prove that the fourth term converges to 0 uniformly almost surely. We can re-write it as,
| (103) |
Lets now fix and set . Since the entries and belong to the same row of , they are uncorrelated by the assumption 4. Moreover, is a sequence of independent random variables by the assumption 4 as well. Using that and an application of Cauchy-Shawardz inequality along with the 4th moment condition on the entries of we get,
From here we can apply the Kolmogorov strong law of large numbers to conclude
| (104) |
which is true for all . We are now ready to complete the argument.
The final limit is since number of possible pairs of and is and we have (104). ∎
The proof of the following Lemmas is a straightforward computation.
Lemma 6.7.
Let
The maximum of the function defined in Lemma 6.6 is attained at
| (105) |
where
|
and the maximum value is
| (106) |
Lemma 6.8.
Proof.
Define by . The definitions of , and are such that
| (107) |
Since is the largest eigenvalue we get
| (108) |
By Lemma 6.6, we have the uniform almost sure convergence of to . Hence the supremum and limits are interchangeable:
| (109) |
By (109) along with the Lemma 6.7,
| (110) |
This proves the first part of the Lemma. On the other hand, the following almost sure convergence also follows from Lemma 6.6:
| (111) |
Combining (109) and (111) we obtain,
| (112) |
Expanding equation 107 yields
| (113) |
By an application of Lemma 6.13, it is straightforward to show that the last two terms vanish almost surely. Hence we have,
| (114) |
Note that the sequence of points lie on a closed and bounded set . Hence for any sub-sequence, a further sub-sequence converges. Since we have (112) and is continuous, those sub-sequence of vectors must converge to either or .
By (114) the fact that , , and , there must be a further sub-sequence that converges to
Hence
| (115) |
∎
Now we are ready at last to prove Proposition 5.5.
Proof of Proposition 5.5:.
Let and be the leading eigenpairs for the sample covariance matrices and respectively. Also let and be the right singular vectors of and that are associated with and respectively. Hence we can write
| (116) |
| (117) |
| (118) |
Now define
| (119) |
Clearly, resides in the span of and . By Lemma 6.14 we have and almost surely. We have,
| (120) |
By Lemmas 6.6 and 6.14, both terms and converge to almost surely. Since we have from the proof of 6.6, a few applications of strong law of large numbers shows that the Frobenious norm terms remain finite in the asymptotic regime. This completes the proof. ∎
6.4 Proof of Theorem 2.4(b)
We first need to tackle the following technical propositions.
Proposition 6.9.
Under assumptions 1-5,
-
1.
almost surely if and only if almost surely,
-
2.
almost surely if and only if almost surely, and
-
3.
almost surely if and only if almost surely.
Proof.
From the definitions of , and it follows that
| (121) |
| (122) |
Now using (121) and the assumption (5) we can prove the first part of the proposition as,
| (123) |
Next, using equations (121), (122) and the assumption (5) we can re-write as,
| (124) |
From there it is easy to see
| (125) |
which proves the second assertion. Finally, using the equations (121), (122) and the assumption (5) we can rewrite as,
| (126) |
Therefore
| (127) |
which proves the third part of the proposition. ∎
Proposition 6.10.
Given the modeling assumptions and we have
Proof.
First re-write it as
| (128) |
where . From (128) it is sufficient to prove,
| (129) |
With some computation and Proposition 5.2 one can verify that
| (130) |
By Lemma 6.14, we have . By part (1) of Proposition 6.9 we have almost surely. These all together prove
| (131) |
which implies . This finishes the proof.
∎
Proposition 6.11.
Proof.
Rewrite the definition of as
| (133) |
where we set and . We will use the notation and for the limits of and respectively. From the definition of and we have and are nonzero as long as . From the statement of Lemma 6.7 and a use of lemma 6.8 it is easy to recover the following implications of the sub-cases of ,
-
(a)
If and then ,
-
(b)
if and then , ,
-
(c)
if and then , .
For the sub-case (b) we get . Hence the assertion of the proposition for this sub-case is same with the assertion of Proposition 6.10. Therefore the untreated cases are the sub-cases (a), (c) and the case . For all of them and hence . For that reason we can re-write (132) as follows,
| (134) |
where we set , and which is by definition orthogonal to the linear subspace generated by and . Continuing from (134), it is sufficient to show
Lemma 6.12.
where
The proof of Lemma 6.12 requires some algebraic computations and is omitted here, but complete details appear in Gurdogan, [2021].
Now we will prove , , and in an orderly fashion. We will use the following implications of the second and the third part of Proposition 6.9,
| (135) |
Lets start with proving . Using Lemmas 6.7, 6.8 and Lemma 6.14 one can derive the following,
| (136) |
From the definition of in Lemma 6.7, we can immediately infer that
By the assumptions (1), (4) the remaining terms on the numerator at 136 are positive. Hence we get almost surely.
In regards to , we have the terms , non-negative by their definition. Also, the terms , are positive by Lemma 6.14. We have positive by a straight forward implication of the modeling assumption (1). Lastly by (135). These all together proves that .
Now, lets see that all terms involve in are positive. The terms and are positive by 135. Also the terms and are positive by Lemma 6.14. Finally, the term for the remaining case/sub-cases being treated. These all-together shows .
Having , and and on (6.12) proves that,
| (137) |
almost surely. This finishes the proof. ∎
Proof of Theorem 2.4(b).
Using Theorem 2.2 it suffices to prove
| (138) |
Recalling the definition of and we can re-write it as
| (139) |
and
| (140) |
almost surely. Recall from Proposition 5.5 that converges to almost surely in the norm. Using this we can update (140) with the following equivalent version,
| (141) |
and
| (142) |
almost surely. Propositions (6.10) and (6.11) finish the proof. ∎
6.5 Two Lemmas
For the reader’s convenience, we state two lemmas from Goldberg et al., [2021] that are used above. The reader may consult that paper for proofs.
Lemma 6.13 (Lemma A.1).
Let be a real sequence with satisfying
Let be a sequence of mean zero, pairwise independent and identically distributed real random variables with finite variance.
Then
almost surely as , where
With the notation and assumptions of our theorems, define a non-degenerate random variable by
and recall: is the leading eigenvalue of the sample covariance matrix , is the average of the remaining eigenvalues, and is the normalized right singular vector of corresponding to the singular value .
Lemma 6.14 (Lemma A.2).
Almost surely as ,
References
- Bickel and Levina, [2008] Bickel, P. J. and Levina, E. (2008). Covariance regularization by thresholding. The Annals of Statistics, pages 2577–2604.
- El Karoui, [2008] El Karoui, N. E. (2008). Spectrum estimation for large dimensional covariance matrices using random matrix theory. The Annals of Statistics, pages 2757–2790.
- Fan et al., [2008] Fan, J., Fan, Y., and Lv, J. (2008). High dimensional covariance matrix estimation using a factor model. Journal of Econometrics, 147(1):186–197.
- Fan et al., [2013] Fan, J., Liao, Y., and Mincheva, M. (2013). Large covariance estimation by thresholding principal orthogonal complements. Journal of the Royal Statistical Society: Series B (Statistical Methodology), 75(4):603–680.
- Frost and Savarino, [1986] Frost, P. A. and Savarino, J. E. (1986). An empirical bayes approach to efficient portfolio selection. Journal of Financial and Quantitative Analysis, 21(3):293–305.
- Goldberg et al., [2021] Goldberg, L., Papanicolaou, A., and Shkolnik, A. (2021). The dispersion bias. CDAR working paper https://cdar.berkeley.edu/publications/dispersion-bias.
- Gurdogan, [2021] Gurdogan, H. (2021). Eigenvector Shrinkage for Estimating Covariance Matrices. PhD thesis, Florida State University.
- Hall et al., [2005] Hall, P., Marron, J. S., and Neeman, A. (2005). Geometric representation of high dimension, low sample size data. Journal of the Royal Statistical Society: Series B (Statistical Methodology), 67(3):427–444.
- Lai and Xing, [2008] Lai, T. L. and Xing, H. (2008). Statistical models and methods for financial markets. Springer.
- Ledoit and Wolf, [2003] Ledoit, O. and Wolf, M. (2003). Improved estimation of the covariance matrix of stock returns with an application to portfolio selection. Journal of empirical finance, 10(5):603–621.
- Ledoit and Wolf, [2004] Ledoit, O. and Wolf, M. (2004). Honey, I shrunk the sample covariance matrix. The Journal of Portfolio Management, 30:110–119.
- Ledoit and Wolf, [2017] Ledoit, O. and Wolf, M. (2017). Nonlinear shrinkage of the covariance matrix for portfolio selection: Markowitz meets goldilocks. The Review of Financial Studies, 30(12):4349–4388.
- Markowitz, [1952] Markowitz, H. (1952). Portfolio selection. The Journal of Finance, 7(1):77–91.
- Rosenberg, [1974] Rosenberg, B. (1974). Extra-market components of covariance in security returns. Journal of Financial and Quantitative Analysis, 9(2):263–274.
- Ross, [1976] Ross, S. A. (1976). The arbitrage theory of capital asset pricing. Journal of economic theory, 13(3):341–360.
- Vasicek, [1973] Vasicek, O. A. (1973). A note on using cross-sectional information in bayesian estimation of security betas. The Journal of Finance, 28(5):1233–1239.