Molecules with ALMA at Planet-forming Scales (MAPS) VI:
Distribution of the small organics HCN, C2H, and H2CO
Abstract
Small organic molecules, such as C2H, HCN, and H2CO, are tracers of the C, N, and O budget in protoplanetary disks. We present high angular resolution ( au) observations of C2H, HCN, and H2CO lines in five protoplanetary disks from the Molecules with ALMA at Planet-forming Scales (MAPS) ALMA Large Program. We derive column density and excitation temperature profiles for HCN and C2H, and find that the HCN emission arises in a temperate ( K) layer in the disk, while C2H is present in relatively warmer ( K) layers. In the case of HD 163296, we find a decrease in column density for HCN and C2H inside one of the dust gaps near au, where a planet has been proposed to be located. We derive H2CO column density profiles assuming temperatures between 20 and 50 K, and find slightly higher column densities in the colder disks around T Tauri stars than around Herbig Ae stars. The H2CO column densities rise near the location of the CO snowline and/or millimeter dust edge, suggesting an efficient release of H2CO ices in the outer disk. Finally, we find that the inner au of these disks are rich in organic species, with abundances relative to water that are similar to cometary values. Comets could therefore deliver water and key organics to future planets in these disks, similar to what might have happened here on Earth. This paper is part of the MAPS special issue of the Astrophysical Journal Supplement.
1 Introduction
Young stars have flattened disks of gas and dust rotating around them, a natural outcome of the star formation process. The material available in these protoplanetary disks will eventually be accreted onto the star, blown out by winds, or be incorporated into planets (see reviews by Williams & Cieza, 2011; Andrews, 2020; Öberg & Bergin, 2021). The chemical composition of nascent planets is therefore directly linked to the chemical reservoir of disks. Small organics are some of the main carriers of C, N, and O in protoplanetary disks. However, the ability of planets to access these organic reservoirs depends on the distribution of this material, particularly in the inner few tens of au where rocky planets are expected to form.
Although the main carrier of N in disks is expected to be N2, this molecule has no observable lines in cold gas. HCN is a secondary N carrier, but its rotational lines in the millimeter are readily detected in disks (Öberg et al., 2011; Chapillon et al., 2012; Bergner et al., 2019). In addition, observations of mid-infrared HCN lines have shown that it is abundant in the inner au of disks (Salyk et al., 2011; Najita et al., 2013, 2018). HCN is therefore one of our best tracers of the N budget in disks and allows us to characterize the spatial distribution of N. Moreover, HCN is thought to be a crucial molecule to the emergence of life, as it is the starting point in the chemistry leading to proteins and RNA (Powner et al., 2009; Patel et al., 2015; Becker et al., 2019).
In addition to revealing the distribution of the organic and elemental reservoir, molecular lines provide us key information on the physical and chemical conditions prevailing in disks. The distribution of HCN and C2H has been shown to depend on the UV radiation field and on the abundances of C and O (Du et al., 2015; Bergin et al., 2016; Cleeves et al., 2018). The distribution of these small organics are also potentially sensitive to density and temperature variations. For example, HCN has been proposed to be a useful tool to study the formation of giant planets in disks, as they will heat up the surrounding gas and result in enhanced HCN emission around the forming planet (Cleeves et al., 2015).
H2CO is a third commonly observed small organic in disks that is connected to the oxygen cycle. It is an important precursor of O-bearing Complex Organic Molecules (COMs), which as methanol, acetaldehyde, ethylene glycol, and formamide (Watanabe & Kouchi, 2002; Chuang et al., 2017). It is hypothesised that O-bearing COMs are preferentially locked in ices and removed from the gas phase as the dust grows and settles to the midplane (e.g, Bergin et al., 2010; Hogerheijde et al., 2011; Du et al., 2017). This would explain why O-bearing COMs have been more difficult to detect in disks compared to nitriles or hydrocarbons (e.g., Chapillon et al., 2012; Öberg et al., 2015; Walsh et al., 2016; Bergner et al., 2018; Favre et al., 2018; Loomis et al., 2018; Carney et al., 2019). H2CO lines, however, are much brighter in disks than lines from more complex O-bearing species because H2CO has a simpler molecular structure and therefore the internal energy is distributed in fewer molecular lines (Aikawa et al., 2003; Pegues et al., 2020). Observations of H2CO therefore provide a view of the spatial distribution of the O-bearing molecules in disks.
While rich substructure has been observed in dust continuum emission of numerous disks (e.g., Andrews et al., 2018; Long et al., 2018; Pérez et al., 2020), the chemical structure of these disks has been less explored at high angular resolution. The combination of sensitivity and spatial resolution needed to spatially resolve molecular line emission on planet-forming scales has been the main limitation so far in characterizing the distribution of most key organic molecules. However, sensitive observations at moderate angular resolution have demonstrated the presence of a rich substructure in the emission of various molecular lines (e.g., Henning & Semenov, 2008; Mathews et al., 2013; Öberg et al., 2015; Bergin et al., 2016; Huang et al., 2017; Öberg et al., 2017; Salinas et al., 2017; Cazzoletti et al., 2018; Kastner et al., 2018; Miotello et al., 2019; Pegues et al., 2020; Teague & Loomis, 2020).
In this paper, we present observations from the Molecules with ALMA at Planet-forming Scales (MAPS) ALMA Large Program. Here, we focus on molecular line emission from the small organic molecules HCN, C2H, and H2CO in five nearby and otherwise well-studied protoplanetary disks. HCN, C2H, and H2CO have been previously observed in these disks, but at lower angular resolution (05). In particular, Bergner et al. (2019) presented observations of HCN and C2H toward four of these disks, and Pegues et al. (2020) presented observations of H2CO toward the five disks. The MAPS data presented in this paper provide a combination of high angular resolution with excellent brightness sensitivity, which enables us to identify substructure in the line emission of these small organics. The observations are briefly described in Section 2. In Section 3, we present the spatial distribution of the emission. In Section 4, we retrieve the column density and excitation temperature profiles. We discuss the results in Section 5 and summarize our conclusions in Section 6.
| Source | Spectral | Distance | Incl | PA | |
|---|---|---|---|---|---|
| Type | (pc) | (∘) | (∘) | () | |
| IM Lup | K5 | 158 | 47.5 | 144.5 | 1.1 |
| GM Aur | K6 | 159 | 53.2 | 57.2 | 1.1 |
| AS 209 | K5 | 121 | 35.0 | 85.8 | 1.2 |
| HD 162396 | A1 | 101 | 46.7 | 133.3 | 2.0 |
| MWC 480 | A5 | 162 | 37.0 | 148.0 | 2.1 |
Reproduced from Öberg & MAPS team (2021), where additional source characteristics and a list of references are provided.
| Molecule | Transition | Eu | ||||||
| (GHz) | () | () | (K) | () | ||||
| HCN | , | 88.630415 | 8.91247 | 4.2 | 3 | 4.8 | 0.600 | |
| , | 88.631847 | 14.85197 | 4.2 | 5 | 0.0 | 1.000 | ||
| , | 88.633935 | 2.97073 | 4.2 | 1 | 0.200 | |||
| , | 265.884891 | 2.97015 | 25.5 | 7 | 0.086 | |||
| , | 265.886188 | 16.03887 | 25.5 | 5 | 0.467 | |||
| , | 265.886433 | 23.76144 | 25.5 | 7 | 0.691 | |||
| , | 265.886499 | 34.36945 | 25.5 | 9 | 1.000 | |||
| , | 265.886979 | 0.08487 | 25.5 | 5 | 0.002 | |||
| , | 265.888522 | 2.97075 | 25.5 | 5 | 0.086 | |||
| C2H | , , | 87.316925 | 1.42458 | 4.2 | 5 | 0.0 | 1.000 | |
| , , | 87.328624 | 0.70952 | 4.2 | 3 | 0.498 | |||
| , , | 262.004226 | 3.29692 | 25.1 | 9 | 0.0 | 1.000 | ||
| , , | 262.006403 | 2.46660 | 25.1 | 7 | 0.748 | |||
| , , | 262.064843 | 2.35407 | 25.2 | 7 | 0.714 | |||
| , , | 262.067331 | 1.53855 | 25.2 | 5 | 0.467 | |||
| , , | 262.078935 | 0.20691 | 25.2 | 5 | 0.063 | |||
| H2CO | 218.222192 | 16.29674 | 20.95640 | 7 | 0 | 1.000 |
The spectroscopic constants are taken from the CDMS database (Müller et al., 2001, 2005) for HCN, and from the JPL database (Pickett et al., 1998) for C2H and H2CO. Measurements are provided by Ahrens et al. (2002) for HCN, by Sastry et al. (1981) and Padovani et al. (2009) for C2H, and by Bocquet et al. (1996) for H2CO.
2 Observations
The observations are part of the MAPS ALMA Large Program (2018.1.01055.L), where a large number of molecular lines were observed at high spatial resolution to search for links between chemistry and planet formation in protoplanetary disks. See Öberg & MAPS team (2021) for a detailed description of the scope and aims of MAPS. The MAPS sample includes disks around both T Tauri (IM Lup, GM Aur, and AS 209) and Herbig Ae (HD 163296 and MWC 480) stars, with a wide variety of dust substructures (e.g., rings, gaps, and spirals). A detailed description of the sources can be found in Öberg & MAPS team (2021), and a brief summary is given in Table 1.
Four spectral settings, two in Band 6 and two in Band 3, were observed between 2019 and 2020. The Band 6 setting covered the HCN , C2H , and the H2CO lines. The Band 3 setting covered the HCN lines and the C2H ladder. See Table 2 for a full list of QNs or transitions observed. We subsequently just refer to these lines as and for simplicity. The data include observations using two different array configurations, to provide sufficient dynamic range in baseline length to recover both large-scale and small-scale emission.
The data were first calibrated by the ALMA staff using standard routines, and then self-calibrated by the MAPS team to improve the signal-to-noise ratio of the data. A detailed description of the observations and calibration process can be found in Öberg & MAPS team (2021).
The imaging of the observed visibilities was done with the tclean task of the CASA 6 software. A Keplerian mask was created during the CLEANing process, by selecting regions in each channel where line emission is expected given the Keplerian rotation of each disk. Novel techniques were applied to improve the image quality, in particular the scaling of the CLEAN residual map, which can affect substantially the data quality when combining data from different configuration arrays. We encourage the reader to read a more detailed description of the imaging strategy in Czekala & MAPS team (2021).
We make use of the fiducial MAPS images, which have a circular beam of 015 (corresponding to linear spatial scales of au) for the lines, and a circular beam of 03 (corresponding to linear spatial scales of au) for the lines. In addition to these fiducial images, we used a second set of images for the lines, that were produced by applying a taper to match the resolution of the lines (see Section 6.2 in Czekala & MAPS team, 2021 for a detailed description of how these images were produced). This set of maps are available on the MAPS project homepage (https://www.alma-maps.info). The H2CO line is weaker per beam than that of the other small organics, resulting in images with low S/N at high angular (015) resolution. GM Aur is an exception here, as it presents bright H2CO emission that is well-detected in the 015 resolution image. For consistency, here we use the tapered version of the H2CO images (with 03 resolution) for all sources, which are more sensitive to low surface brightness and extended features. Disk integrated line fluxes for each line can be found in Table A.1.
3 Spatial distribution of the emission
3.1 Zeroth-moment maps
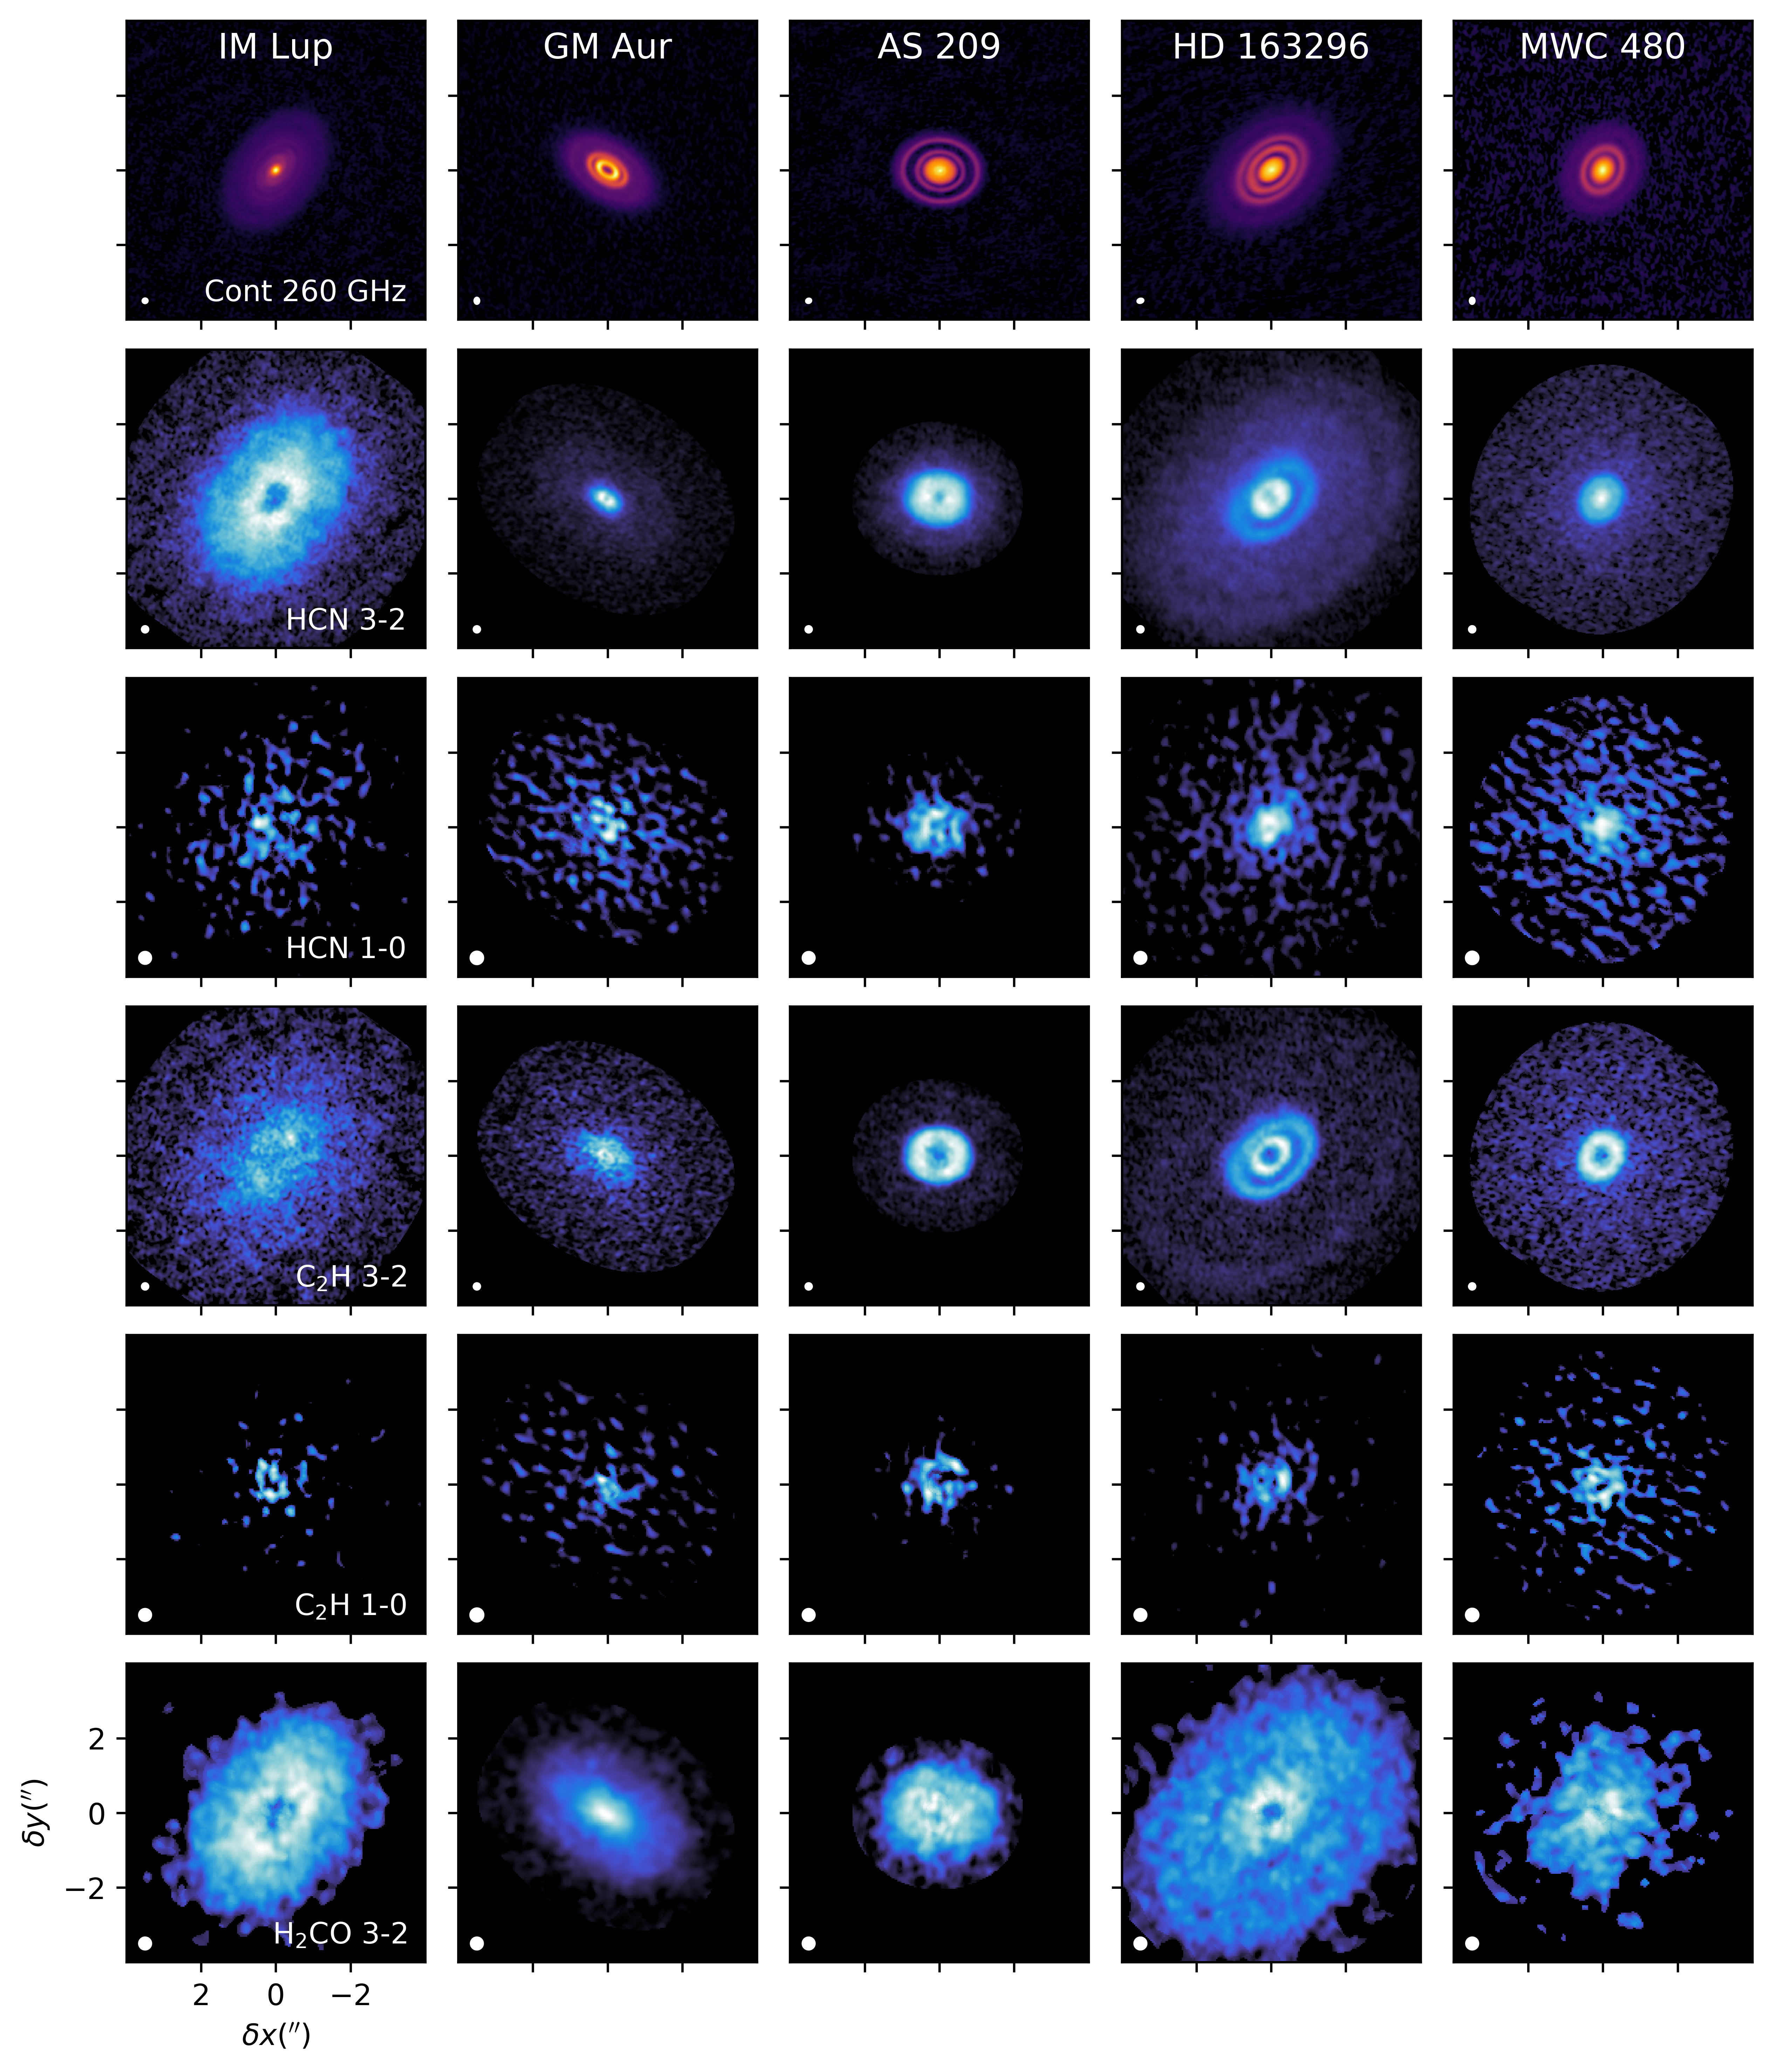
The velocity-integrated emission, or “zeroth moment”, maps of the HCN, C2H, and H2CO and lines are shown in Fig. 1, the dust continuum emission at 260 GHz (with 01 angular resolution) is shown in the upper row for comparison. A description of the continuum emission images can be found in Sierra & MAPS team (2021). For HCN and , all hyperfine lines were included to generate the zeroth-moment maps, while for C2H only the two brightest (and blended) lines are included in the line, and the first and brightest component in the line. For more details on the zeroth-moment map generation process, see Law & MAPS team (2021a).

The lines have higher fluxes than the lower-energy lines for all disks. HCN is strongly detected in all disks, and presents a variety of substructures, including central holes, single, and multiple rings. HCN presents similar spatial distributions to the line in AS 209, HD 163296, and MWC 480. Several rings are seen toward HD 163296, including a faint ring in the outer disk (centered at au), far beyond the dust continuum edge. Toward IM Lup, the HCN line emission is fainter and more extended than in the other disks, resulting in a lower-S/N zeroth-moment map. Toward GM Aur, the HCN line is mostly detected in the central regions of the disk, although an outer diffuse ring is seen in the radial profile (see also Law & MAPS team, 2021a).
The C2H and lines have spatial distributions and radial extents similar to HCN in AS 209, HD 163296, and MWC 480. Toward IM Lup and GM Aur, the line is fainter than in the other disks, resulting in lower-S/N zeroth-moment maps, and the line is mostly detected in the central regions of the disks, similar to HCN.
Fewer substructures are observed for H2CO compared to HCN and C2H, although a few ring-like structures are seen, in particular in HD 163296. The H2CO line emission is more extended than HCN and C2H, and presents a central hole of varying depths in all the disks except GM Aur and MWC 480, where only a tentative dip is observed. GM Aur presents exceptionally bright emission compared to the other disks.
Normally, for molecules other than 12CO and 13CO, it is not possible to derive the height of the emission directly from the spatially resolved image cubes (e.g., Rosenfeld et al., 2013; Pinte et al., 2018a). This is because other lines are typically fainter and arise in less elevated disk layers. However, thanks to the higher inclination and relative proximity of the HD 163296 disk, and the high angular resolution and sensitivity of the MAPS data, we can distinguish emission arising in a flat disk from emission arising in the elevated layers above the disk midplane. Indeed, the HCN and C2H lines observed toward HD 163296 show a clear asymmetry along the disk minor axis that cannot be explained with emission from a flat disk. Part of the asymmetry, also seen as projected ellipses that look shifted to the south with respect to the disk center, is due to the fact that we are observing the emission from the near cone that is facing us. This effect is clearly seen in the zeroth-moment map, and corresponds to the heights estimated in Law & MAPS team (2021b), i.e., . See Law & MAPS team (2021b) for a detailed description of the emission surfaces for HCN and C2H in the MAPS disk sample.
3.2 Radial profiles
To better characterize the spatial distribution of the emission we used the radial_profile function of the Python package GoFish (Teague, 2019) to produce deprojected radial intensity profiles from the zeroth-moment maps, considering the disk inclination and position angle (see Table 1). Although it is possible to take into account the vertical height of the emission to derive the radial intensity profiles (Law & MAPS team, 2021a), here we assume a flat disk but produce the deprojected profiles by averaging the emission within a wedge along the disk major axis. The C2H lines were not detected at sufficiently high S/N toward IM Lup and GM Aur, so we averaged the emission azimuthally to produce the deprojected radial profiles. For additional details on the deprojected radial profiles, see Law & MAPS team (2021a). The resulting profiles for the (solid) and (dashed) lines are shown in Fig. 2. For comparison, the profiles of the 260 GHz and 90 GHz dust continuum emission are shown in the first row.
In general, the HCN and C2H emission is more compact than that of H2CO — their radial extents are smaller by a factor . Moreover, their radial extents are similar to that of the dust continuum emission, although faint HCN and C2H emission is observed up to au in HD 163296. IM Lup is an exception, as it presents similar radial extents in all molecular lines. One possibility to explain the lack of HCN and C2H emission in the outermost disk regions where H2CO is observed is that the H2 gas density is not high enough to excite the lines. Indeed, for gas temperatures between 10 and 50 K, the HCN line has a critical density of , while the H2CO line has a critical density that is 10 times lower (Shirley, 2015). However, models of these disks find that gas densities are in the outer disk midplanes, enough to excite these lines (e.g., Zhang & MAPS team, 2021). This suggests that the abundance of HCN and C2H decreases in the outermost disk regions where H2CO is still abundant. We note that no additional emission arises in the outermost disk regions in the lower-resolution (03) images that have better S/N.
The radial profiles are consistent with profiles previously observed at lower angular resolution (05) for HCN and C2H in IM Lup, AS 209, HD 163296, and MWC 480 (Bergner et al., 2019), and for H2CO in all sources (Pegues et al., 2020). However, our higher angular resolution observations reveal additional radial substructures, in particular for HCN and C2H. We focus on the lines which show more structure than the lines, due to the higher signal-to-noise ratios and angular resolution (see Law & MAPS team, 2021a for additional substructure analysis).
3.2.1 HCN
HCN shows a central hole in four of five disks, the exception being MWC 480 where the emission is centrally peaked. A main ring of emission is seen for IM Lup, GM Aur, and AS 209, although the rings are not Gaussian but present one or more emission shoulders that could result from blended ring components not resolved in the MAPS data. IM Lup shows an unusually broad, almost plateau-like ring. Two bright rings are seen for HD 163296, centered at and au, and a fainter plateau that extends up to au. In addition, a shallow gap is seen at au along with a faint ring centered at au (Law & MAPS team, 2021a). The ring is better seen in the zeroth-moment map (see Fig.1). GM Aur and AS 209 also present faint HCN emission in the outer disk. In addition to the central emission component, MWC 480 shows an emission shoulder at au, and a partially blended ring at au (see also Law & MAPS team, 2021a). HCN radial profiles observed at similar linear spatial resolution toward other disks around T Tauri stars generally show centrally peaked emission profiles with emission bumps in the outer disk (e.g., Hily-Blant et al., 2019; Kastner et al., 2018).
3.2.2 C2H
C2H shows a central hole for all disks, which is generally larger than the hole seen for HCN. Several unresolved ring components are seen toward IM Lup and GM Aur, similar to what is observed in HCN. AS 209 presents a single ring of C2H emission, very similar in size to the ring seen in HCN. Two rings are seen toward HD 163296, centered roughly at the same locations of the HCN rings. The two faint HCN rings seen in the outer disk are also observed for C2H in the zeroth-moment map (see Fig. 1), but are harder to see in the radial profiles. The presence of these faint C2H outer rings is confirmed with the tapered (03 resolution) image, which has higher S/N (Law & MAPS team, 2021a). Toward MWC 480, a single C2H ring is observed centered at the same location of the outermost HCN ring. Interestingly, the innermost C2H ring seen in HD 163296 and the rings seen in AS 209 and MWC 480 are all located near a gap in the dust continuum emission. Similar ring-like structures with large central cavities have been observed for C2H toward other disks, like TW Hya (Bergin et al., 2016) and V4046 Sgr (Kastner et al., 2018).
3.2.3 H2CO
H2CO radial profiles present more complicated substructure, such as broad ring-like emission components with several shoulders and/or local maxima. In the inner disk, IM Lup, AS 209, and HD 163296 present a central depression in H2CO emission, while GM Aur and MWC 480 show centrally peaked emission profiles. In the outer disks ( au), the slope at which the H2CO intensity decreases is much more shallow compared to HCN and C2H, in particular for the disks around HD 163296 and MWC 480.
The radial profiles show spatial links between H2CO substructures, namely line emission peaks, and the outer edge of the millimeter continuum disk. H2CO peaks are aligned with the outer edge of the continuum in IM Lup and HD 163296. Additionally, the higher-resolution (015) images of AS 209, as noted in Law & MAPS team (2021a), also show the presence of an additional H2CO ring that is radially coincident with the dust edge. Toward HD 163296, a spatial link between a H2CO line emission peak and outer dust edge was seen in lower-resolution data from Carney et al. (2017). Spatial links between millimeter dust edges and H2CO line emission have also been observed toward other disks, like TW Hya (Öberg et al., 2017), and V4046 Sgr (Kastner et al., 2018), as well as in four out of a sample of 15 disks in the survey presented by Pegues et al. (2020). All MAPS disks were included in those surveyed by Pegues et al. (2020), but a close association between an outer H2CO ring and millimeter dust edge in the MAPS disks, as reported here, was not clearly seen in Pegues et al. (2020), due to these outer H2CO rings not being clearly spatially resolved. Thus, when considering these previous survey results with the new MAPS observations, this suggests that at least 50% of disks may show some spatial links between H2CO substructures and the outer edge of the continuum disk.
In summary, we find some similarities between the HCN and C2H radial profiles. Furthermore, several of the H2CO peaks spatially coincide with the HCN and C2H peaks, for example the first H2CO peak seen toward AS 209. However, most of the H2CO features do not have direct counterparts in HCN or C2H, and the H2CO radial extents are larger.
4 Column densities
To derive column density profiles, we first produce deprojected spectra at different radii using the radial_spectra function of GoFish. The radial bins are set to 1/4 of the beam major axis, and the disk is assumed to be vertically flat. Before averaging the spectra in each radial bin, the velocity is shifted according to the Keplerian rotation of the disk, so that all the spectra are aligned. The stellar masses needed to compute the Keplerian velocities are taken from Öberg & MAPS team (2021) and are estimated from gas dynamics in Teague & MAPS team (2021). The spectra are azimuthally averaged in those disks with low S/N (C2H for IM Lup and GM Aur, and H2CO for all sources), and averaged within a wedge along the disk major axis for the others. The main motivation for using a wedge when possible is to avoid the uncertainty of the emission surface height, which strongly influences the spatial location of emission near the minor axis.
4.1 Column density retrieval
To derive the column densities, we assume that the emission is in local thermal equilibrium (LTE) and that the emission fills the beam. The LTE assumption is reasonable, considering the high densities present in protoplanetary disks. Cataldi & MAPS team (2021) performed a non-LTE fit to the HCN lines and found similar column densities, suggesting our LTE assumption is a good approximation, at least for HCN. The line intensity is computed as
| (1) |
where is the Planck function, is the excitation temperature, is the background temperature, and is the line optical depth. The background temperature is fixed to the maximum of the continuum brightness temperature or the cosmic microwave background (CMB) temperature (2.73 K).
At the line center, the optical depth is given by
| (2) |
where is the Einstein coefficient, is the frequency of the line, is the Gaussian line width and Nu is the upper-level column density,
| (3) |
Here, Ntot corresponds to the total column density of the molecule, is the upper-level degeneracy, is the upper-level energy, and is the partition function. The spectroscopic constants and partition functions were taken from the CDMS and JPL catalogs and are listed in Table 2.
The free parameters in the fit are the total column density Ntot, the FWHM , and the excitation temperature in the case of HCN and C2H, as their lines present hyperfine structure. For H2CO, the excitation temperature is fixed because only a single line is available. We also allow for a small offset from the source velocity , constrained between 0.25 and 0.25. We explore the parameter space using the emcee package (Foreman-Mackey et al., 2013). The best fit is taken as the 50th percentile of the samples in the marginalized distributions, and the associated errors are computed from the 16th and 84th percentiles.
4.2 HCN and C2H fitting method


We follow a method similar to the one implemented in Bergner et al. (2019). The HCN and C2H lines present hyperfine structure that is spectrally resolved. We fit the observed spectra assuming that all the hyperfine lines have the same excitation temperature. Each hyperfine line is assumed to be a Gaussian, such that the total line opacity is given by
| (4) |
where is the line center opacity of the ith component, is the relative velocity of each component with respect to the brightest line, and is the source velocity. The relative intensities as well as the relative velocities are listed in Table 2.
The width of spectral lines is dominated by thermal broadening, which depends on the gas temperature:
| (5) |
where is the molecule’s mass. Under the assumption of LTE, . However, we find that the observed line widths for HCN and C2H are broader than their thermal widths would imply. This is most likely produced by beam smearing, where line emission from different radii in the disk that have different velocities are combined in a single beam. In addition to beam smearing, it is possible that emission from both the back and front sides of the flared disk, which have slightly different projected velocities, are being combined in the observed spectra. The inner disk is particularly affected by these issues, which makes it difficult to fit the lines without artificially decreasing the line opacity or increasing the excitation temperature. A way to alleviate this problem is to first compute the line intensity assuming a purely thermal line width, then compute the total flux, and finally redistribute this flux in the line but now for the observed and broader line width. With this method, the fit to the lines is better, and the inferred line opacity—and hence the column density—is more realistic. The same solution was applied to fit the CN and DCN lines in the MAPS disks (Bergner & MAPS team, 2021; Cataldi & MAPS team, 2021).
The fit to the observed spectra was done in two steps. First, we fit the and lines simultaneously to obtain a better constraint on the excitation temperature. The tapered (03) versions of the line cubes were used for this step, to match the resolution of the line cubes. We included priors on the excitation temperature informed by the gas temperature traced by the optically thick 12CO 2–1 line. Law & MAPS team (2021b) found that the HCN and C2H emission arises from relatively flat surfaces in AS 209, HD 163296, and MWC 480, while the CO isotopologues arise in more elevated disk layers. We thus restrict the rotational temperature between 10 K and the gas temperature inferred from the peak brightness temperature of the optically thick 12CO 2–1 line, (12CO) (Law & MAPS team, 2021b), for both HCN and C2H. The results for the simultaneous fit to the and lines are shown in Appendix B. The resulting excitation temperature and column density profiles are shown in Fig. B.1, and the gray curves show the (12CO) profiles for each disk. HCN presents rotational temperatures between 15 and 40 K, while C2H presents higher values of K. The column densities are on the order of for both molecules. Despite the lower angular resolution of 03 of the data used in these analyses, two column density rings are resolved in both HCN and C2H for HD 163296, and a single ring or central component for the other sources.
In the second step, and to obtain a better-resolved column density profile, we fit the high angular resolution lines only. We used the excitation temperature found in the previous step (Tex,0) as an initial parameter, and constrain K K for both HCN and C2H. Figure 3 shows a selection of observed spectra and fit for each species and disk. Note that the radial extent is different for each disk. The lines are fit well in most of the disk, but poorly fit in the inner disk, where the lines are substantially broader, resulting in the individual hyperfine components being completely blended. For this reason, we used the 12CO or 13CO temperature as the excitation temperature in regions where the fit does not work properly. For C2H, the (12CO) was used for all sources. For HCN, the (12CO) was used for IM Lup, GM Aur, and AS 209. For the two disks around Herbig Ae stars, however, the (13CO) was used instead, since the (12CO) produced a large discontinuity in the column density profile.
An independent retrieval of the HCN column density and excitation temperature is presented in Bergner & MAPS team (2021) and Cataldi & MAPS team (2021), using a method similar to the one presented here but with different constraints on the excitation temperature. A comparison between the HCN column densities presented in these three papers is shown in Appendix C. The resulting column density profiles and excitation temperatures are consistent with the ones presented here (see Fig. C.1).

4.3 H2CO fitting method
For H2CO, we fit a single Gaussian to the line in each radial bin. In order to constrain the H2CO excitation temperature, a combination of lines with different upper level energies is needed. Since we only observed one line, the excitation temperature is fixed and the column density was computed for a range of excitation temperatures between 20 and 50 K so that we are not a priori assuming the vertical location of the H2CO emitting layer. The range of temperatures is based on previous estimates. For example, Pegues et al. (2020) recently showed that the bulk H2CO emission in four Class II disks arises in K gas, using multi-line H2CO observations with similar energy ranges ( K). In particular, for MWC 480 they found a low excitation temperature of K. Similarly, toward HD 163296 the disk-averaged H2CO excitation temperature has been estimated to be K (Carney et al., 2017; Guzmán et al., 2018). Finally, toward the older ( Myr; Sokal et al., 2018) TW Hya disk, Terwisscha van Scheltinga et al. (2021) recently found that H2CO emits mostly from a K layer, corresponding to an elevated disk layer of .
We found that the column density is not very sensitive to ; the difference in column density is only a factor for this range of temperatures. The observed spectra with the best-fit overlaid are shown in the bottom panels in Fig. 3. As was found for HCN and C2H, the lines are fit well in most of the disk, but poorly fit in the inner au, especially in HD 163296 and MWC 480. This is probably due to contamination from the back side of the disk.
4.4 HCN, C2H, and H2CO column density profiles
The resulting column density profiles for HCN, C2H, and H2CO are shown in Fig. 4. Two profiles are shown for H2CO, corresponding to of 20 and 50 K. The gray shaded area marks the inner regions where (12CO) or (13CO) was used as the excitation temperature in the fit. The horizontal bars show the spatial resolution of the profiles for each molecule and disk.
The HCN and C2H column densities range from to , although the HCN column density may reach in the inner au of GM Aur, HD 163296, and MWC 480. Overall, HCN and C2H present similar column density profiles, except for that HCN has a central component in GM Aur, HD 163296, and MWC 480, while the inner disk seems to be depleted of C2H in all sources but toward GM Aur. GM Aur presents a central dust cavity (see Fig. 2), which could result in enhanced C2H abundance in the inner disk. However, there is evidence that the total H2 gas is also depleted inside the dust cavity (Dutrey et al., 2008; Huang et al., 2020; Bosman & MAPS team, 2021b). Another difference between HCN and C2H is in the outer au disk. The HCN column density seems to reach a plateau of a few times , which is not present for C2H.

The H2CO column density profiles are consistent with the ones derived by Pegues et al. (2020) for all sources using different H2CO transitions and at lower angular resolution. H2CO is present at higher column density at larger disk radii compared to HCN and C2H. Although the spatial resolution for the H2CO column density profiles is lower than for the smaller organics, a few distinct rings can be seen in the profiles. GM Aur and AS 209 present less structure, while at least two rings or local maxima are seen for HD 163296 and MWC 480. The H2CO column density varies between the sources, ranging between and in the inner 200 au. The largest column densities are seen toward GM Aur and IM Lup, which together with AS 209 are the coldest disks in the sample if we consider their stellar mass and the large disk masses that have been estimated (Cleeves et al., 2016; McClure et al., 2016).
4.5 HCN and C2H excitation temperatures
Figure 5 shows the excitation temperature profiles inferred for HCN and C2H from fitting the higher angular resolution lines only, informed by the obtained from the simultaneous fit to the and lines. The (12CO) and (13CO) profiles are shown in gray. At least for 3/5 sources, the C2H excitation temperatures are higher than those derived for HCN. HCN temperatures range from 20 to 30 K, while C2H temperatures range from 20 to 60 K. The C2H excitation temperatures in the outer disk regions ( au) of AS 209, HD 163296, and MWC 480 are consistent with the temperatures derived by Bergner et al. (2019) at lower angular resolution. Excitation temperatures for HCN do not vary substantially within the disk sample. However, the inferred values for C2H are higher for HD 163296 and MWC 480 than for the other three disks. This is consistent with disks around Herbig Ae stars being warmer than disks around lower-mass T Tauri stars, and suggest that C2H arises in warmer elevated disk layers compared to HCN.
The inferred excitation temperatures are low ( K) for both HCN and C2H in IM Lup and GM Aur, and do not vary substantially across the disks. Toward AS 209, the C2H excitation temperature profile shows a ring-like distribution similar to the column density ring seen in Fig. 4, reaching a peak K in one of the dust gaps. HCN, on the other hand, shows a decreasing profile with radius. Toward HD 163296, the C2H and HCN excitation temperatures show two rings, similar to the distribution of the column densities, although the rings are more pronounced for C2H than for HCN. Toward MWC 480, the of HCN and C2H decrease with radius in a smoother profile compared to HD 163296. Finally, in AS 209 and HD 163296, the peaks of C2H spatially coincide with the column density peaks. We do not find the same correlation for the other sources or for HCN.
5 Discussion

5.1 Location of the HCN and C2H emission surfaces
Chemical models predict HCN and C2H emission arises in elevated disk layers where UV photons drive the gas to temperatures of K and dominate the chemistry (Bergin et al., 2016; Cleeves et al., 2018). However, a recent analysis of observations toward a sample of 16 disks at lower (05) angular resolution resulted in low excitation temperatures of K and K for HCN and C2H, respectively (Bergner et al., 2019). Bergner et al. (2019) suggested that the origin of the lower-than-expected excitation temperatures could be due to subthermal emission or beam dilution due to unresolved chemical substructure. The higher angular resolution MAPS data reveals these substructures across a sample of disks for the first time. In addition, the line observations now allow us to better constrain the molecular excitation temperature. While we do find HCN excitation temperatures that are higher than inferred by Bergner et al. (2019) toward these disks, they remain relatively low ( K). For C2H, on the other hand, we find higher excitation temperatures that are more consistent with the gas temperature at the expected height of the emission, in particular for the warmer disks HD 163296 and MWC 480, which are also disks that present the most substructure in their emission.
The inferred excitation temperatures for HD 163296 are consistent with the brightness temperature distributions of the HCN and C2H lines found by Law & MAPS team (2021b). These brightness temperatures provide a lower limit to the gas temperature because these lines are partly optically thin. These results, combined with the emission heights estimated by Law & MAPS team (2021b) of , suggest that the HCN emission arises in vertically deeper and colder layers than C2H.
For IM Lup and GM Aur, the of C2H and HCN are very similar, which suggests that their emission arises from similar disk layers. However, given our uncertainties, we cannot rule out a vertical stratification. Indeed, detailed chemical models of IM Lup suggest that HCN arises in deeper layers compared to C2H. (Cleeves et al., 2018). Finally, it is worth mentioning that the C2H excitation temperature is lower for the colder disks around T Tauri stars, which show fewer substructures compared to the disks around Herbig Ae stars. This could be due to intrinsic lower gas temperatures or to small-scale substructure not resolved in our observations.
5.2 Comparison to CO column densities
CO is widely used to trace the gas in disks because H2 does not have strong transitions in the low temperature range that characterizes disks. Thus, we compare the column density profiles of the small organics with that of CO. Figure 6 shows the normalized column density profiles of HCN, C2H, and H2CO, as well as the CO column densities derived from the C18O 2–1 line by Zhang & MAPS team (2021). In general, the HCN and CO column densities tend to be more centrally peaked than that of C2H, suggestive of an active warm cyanide chemistry in the inner disk. In the outer disk, HCN and C2H show similar radial distributions up to au, where the C2H column density starts to drop faster than HCN and CO. There is notably good spatial correlation between the profiles toward HD 163296 between au.
In general, the HCN and CO column densities correlate well, except in AS 209, where significant differences are observed. In particular, an anticorrelation is observed between CO and both HCN and C2H. Alarcón & MAPS team (2021) used chemical models to investigate the gas structure in AS 209, and showed that this anticorrelation can be explained by CO chemical processing, which produces a decrease in the CO abundance and an elevated C/O ratio () in the gas that boosts the formation of C2H. Bosman & MAPS team (2021a) also found that elevated C/O ratios () are needed to explain the observed C2H column densities for AS 209, MWC 480, and HD 163296. C2H is therefore very sensitive to the gas-phase C/O abundance ratio in the disk atmosphere (Bergin et al., 2016; Cleeves et al., 2018; Miotello et al., 2019).
5.3 Photochemistry of HCN and C2H
If the formation of HCN and C2H is the result of a UV-dominated chemistry, we might expect to see enhanced column densities inside the dust gaps. The depletion of millimeter dust at these locations should allow the deeper penetration of UV photons, and thus efficient formation of C2H and HCN. However, the penetration of UV photons will also depend on the geometry of the source (for example, the flaring of the disk). It is nevertheless worth comparing the structures observed in mm dust and molecular emission. The position of the dust continuum gaps, as measured by Law & MAPS team (2021a ; but see references therein), are marked by the gray dashed vertical lines in Fig. 6. We only include the gaps that are resolved at resolution. However, several other gaps are seen in higher angular resolution observations of the dust continuum emission (Huang et al., 2018, 2020). The peak of the C2H column density seen toward IM Lup, AS 209, MWC 480, and the first peak seen toward HD 163296, coincides with the location of the innermost dust gaps, although the C2H structures are generally broad compared to the dust gaps. The second column density peak seen at au toward HD 163296 does not spatially coincide with any of the dust gaps, revealing that there is not a universal connection between dust depletion and C2H or HCN formation. The weak correlation between dust structures and HCN and C2H chemical substructures could be due to the HCN and C2H emission arising in disk elevated layers, which are not always impacted by the dust millimeter substructure that trace the midplane. Moreover, recent studies have shown that the H2 density seems to be much less altered than the dust inside the dust gaps, and chemical effects play a more important role in setting molecular abundances (e.g., Teague et al., 2018b; Alarcón & MAPS team, 2021; Zhang & MAPS team, 2021).
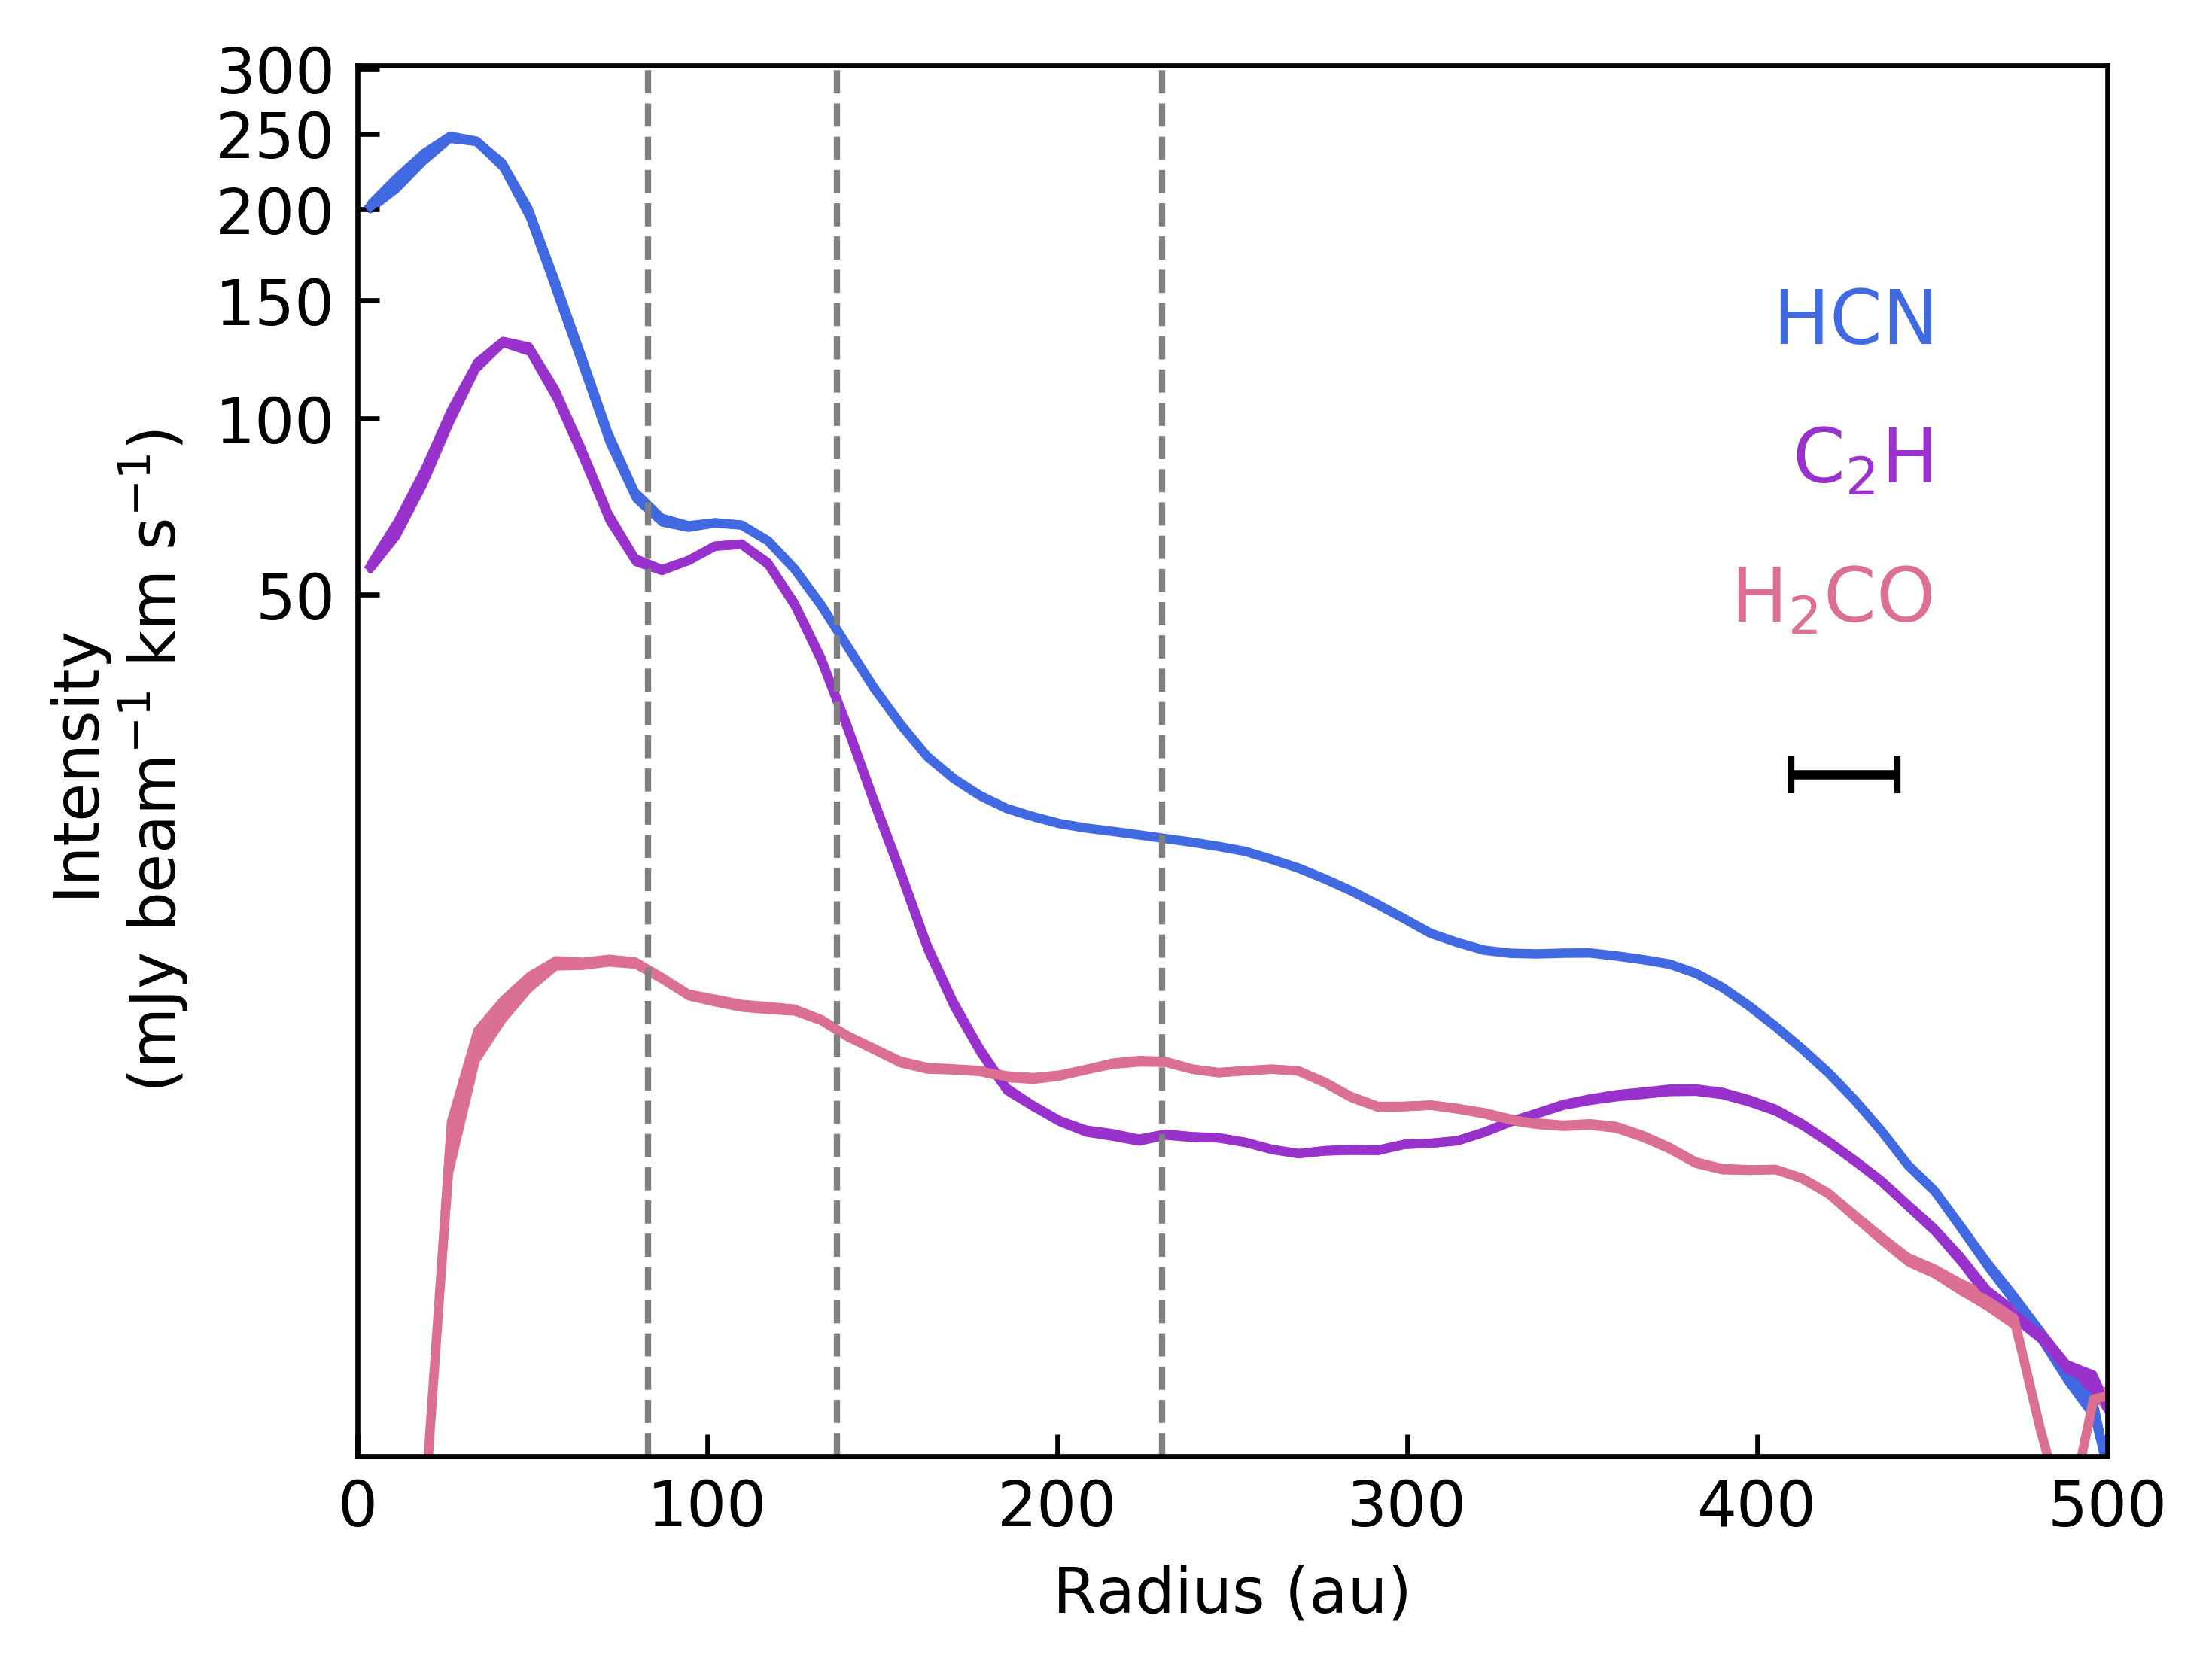
If photochemistry drives the formation of HCN and C2H, we could also expect to see enhanced emission in the outer disk where the gas density starts to drop allowing UV photons to penetrate the disk. The flaring of the outer disk could also help to capture more UV photons from the star. Although the HCN and C2H emission is compact compared to H2CO, some faint emission is indeed detected at large radii, far beyond the dust millimeter edge in IM Lup, GM Aur, and HD 163296. As an example, Fig. 7 shows radial structures seen in the tapered images for HD 163296, the disk that presents the most substructure in molecular line emission. A power-law stretch was used in the y-axis, to enhance the low-S/N structure seen in the outer disk. A faint ring that is seen in both HCN and C2H near 400 au is also seen in CN (Bergner & MAPS team, 2021). The ring is not clearly seen in H2CO in the radial profile, but a ring structure is visible at large radii in the zeroth-moment map, in particular along the disk minor axis (see Fig. 1). No millimeter dust grains are present at these larger radii, but small dust grains are present, as suggested by scattered light images (e.g., Monnier et al., 2017; Avenhaus et al., 2018; Rich et al., 2020). A small dust grain population is also present in the disk elevated layers where HCN and C2H emission seems to arise. This small grain population is likely regulating the HCN and C2H chemistry. An increased amount of UV photons will also contribute to enhanced HCN destruction in the outer disk. Indeed, Bergner & MAPS team (2021) find an increasing CN/HCN profile with radius, indicative of increased HCN photodissociation relative to CN in the lower-density outer disk (see also Guzmán et al., 2015). All this suggests that an active photochemistry is at play in the outer disk beyond the millimeter dust emission around HD 163296. Even so, as mentioned in the previous section, the C/O ratio in the gas may still be more important than UV exposure for the formation of HCN and C2H in the outer disk.
5.4 Links to planet formation
Several efforts have been made in recent years to find planets forming in protoplanetary disks. The presence of several planets has been proposed to explain the gaps seen in the dust continuum emission and the deviation from Keplerian rotation in CO observed in a few disks, including HD 163296 (Teague et al., 2018a; Pinte et al., 2018b, 2020; Teague & MAPS team, 2021) and MWC 480 (Teague & MAPS team, 2021). While dust depletion in the midplane can be inferred from the millimeter dust continuum observations, it has been harder to infer the gaps are also depleted in gas, since all millimeter lines, including CO isotopologues, may reflect chemistry variations rather than true gas density variations. Indeed, chemistry has a nonlinear response to gas density. See Rab et al. (2020) for detailed thermochemical modeling of HD 163296 in particular. Here, we compare the locations of the planets proposed for HD 163296 and MWC 480 with the structures observed in HCN, C2H, and H2CO.
In Fig. 7, we compare the emission of HCN, C2H, and H2CO with the locations of the putative planets in HD 163296 (dashed vertical lines). Besides the two bright rings seen in the inner 150 au, two fainter rings are resolved in the outer disk for both HCN and C2H (see also Law & MAPS team, 2021a). The planet predicted at 83 au by Teague et al. (2018a) and Isella et al. (2016) is located inside a dust millimeter gap, which coincides with the gap seen in HCN and C2H. This gap is also recovered in the column density profiles (Fig. 4). The correlation between the planet location and a decrease in the C2H column density was previously hinted by Bergner et al. (2019). Although the gaps seen for HCN and C2H are much shallower than what is observed for the millimeter dust, these observations suggest the gap is also depleted of gas.
Toward MWC 480, Teague & MAPS team (2021) proposed that a planet near 245 au could explain the observed CO deviations from Keplerian rotation. However, HCN and C2H are not detected at these large radii. At smaller radii ( au), no perturbations could be confirmed in the CO gas kinematics. However, a gap is seen in HCN at around 70 au, which roughly corresponds to the location of a millimeter dust gap. The gap is not seen in C2H. Hydrodynamical simulations suggest that a MJ planet located at an orbital radius of au could produce the observed dust gap (Liu et al., 2019). If there is a corresponding gas gap, then this suggests that HCN may be more sensitive to gas density perturbations than C2H, and could potentially be used as a diagnostic to identify massive planets in protoplanetary disks.
| Gas Mass | Gasice mass w.r.t. H2O ice${}^{\dagger}$${}^{\dagger}$footnotemark: | |||||
|---|---|---|---|---|---|---|
| Source | HCN | C2H | H2CO | HCN | C2H | H2CO |
| ( g) | ( g) | ( g) | (% H2O) | (% H2O) | (% H2O) | |
| IM Lup | 0.03 | 0.05 | 0.20 | 0.001 | ||
| GM Aur | 19.63 | 2.04 | 0.79 | 0.56 | 0.06 | 0.02 |
| AS 209 | 1.99 | 3.27 | 0.15 | 1.09 | 1.80 | 0.08 |
| HD 163296 | 46.36 | 6.03 | 0.24 | 0.68 | 0.09 | 0.004 |
| MWC 480 | 59.92 | 2.17 | 1.21 | 0.45 | 0.02 | 0.01 |
† Assuming an ice-to-gas ratio of 1000
5.5 Origin of the H2CO emission
H2CO could be a better tracer of the colder gas in the outer disk than HCN and C2H, which seem to trace warmer elevated layers in the disks. The use of H2CO as a tracer of cold gas depends on its dominant formation pathway and on the efficiency of desorption mechanisms. H2CO can form from both gas phase and grain surface chemistry. The dominant reaction in the gas-phase at low ( K) temperatures is the neutral-neutral reaction
| (6) |
The grain surface chemistry pathway involves the successive hydrogenation of CO ices (Hidaka et al., 2004; Watanabe et al., 2004; Fuchs et al., 2009)
| (7) |
This pathway can only be efficient in regions where CO has started to freeze out onto dust grains, i.e., beyond the CO snowline and below and around the CO snow surface, depending on whether the CO hydrogenation is faster than the CO desorption. The light blue vertical lines in the bottom panels of Fig. 6 mark the estimated location of the CO snowline in each disk as measured by Zhang & MAPS team (2021). CO snowlines are located at smaller radii in the colder disks around T Tauri stars, compared to the warmer HD 163296 and MWC 480 disks, where the CO snowline is well-resolved by our observations. The first H2CO ring seen toward HD 163296 and MWC 480 spatially coincides with the estimated location of the CO snowline, suggesting that CO hydrogenation is an important (if not dominant) formation pathway of H2CO in disks.
In the warm inner disk, H2CO is expected to form mainly in the gas phase, since CO cannot freeze out onto dust grains. The inner regions of the MAPS disks all show central H2CO depressions, although they are less pronounced for GM Aur and AS 209. This does not mean that H2CO is depleted in the inner disk; it could purely be a result of the observed line being more sensitive to cold gas. Indeed, higher-energy lines have shown centrally peaked emission profiles suggesting a warmer H2CO component is present in the inner disk (Loomis et al., 2015; Öberg et al., 2017).
In the outer disk, both gas-phase and CO hydrogenation could contribute to the overall H2CO emission. In Section 3.2.3 we showed that at least 50% of disks may show some spatial links between H2CO substructures and the outer edge of the continuum disk. We also observe spatial links between the H2CO column density profiles and the outer edge of the continuum disk, which are marked by the gray vertical lines in Fig. 6. In particular, the second ring or bump component seen in the H2CO column density profiles of HD 163296 and MWC 480 spatially coincides with the millimeter dust edge. A similar coincidence is seen toward IM Lup and GM Aur, where a shoulder-type structure is seen near the continuum edge. This suggests that the release of ices at large distances becomes more efficient, either through thermal desorption due to thermal inversion (Cleeves, 2016), or by nonthermal desorption due to the penetration of UV photons (e.g., Podio et al., 2020; van’t Hoff et al., 2020). Another possibility is that other ice fragments are released into the gas phase in the outer disk, which then boost the gas-phase chemistry enhancing the abundance of H2CO.
The H2CO traced by our observations could also form predominantly in the gas phase through reaction (6), with little contribution from the CO hydrogenation pathway (7). This could happen if nonthermal desorption of H2CO ices is not efficient and H2CO remains frozen onto dust grains. In this scenario, the emission would arise in more elevated and warmer disk layers. Although chemical models have shown that pure gas-phase chemistry cannot account for the observed H2CO abundances in the outer disk around DM Tau (Loomis et al., 2015), observations of edge-on Class I disks have shown that H2CO emission arises in the warmer surface layers, as revealed by X-shaped patterns in their zeroth-moment maps (Podio et al., 2020; van’t Hoff et al., 2020). These observations, however, targeted the H2CO line which has a relatively large upper-level energy of K, and is therefore more sensitive to the warmer elevated disk layers. Lower-energy lines could trace colder gas present at intermediate disk layers. In order to confirm the origin of the H2CO emission, multi-line observations are needed (e.g., Pegues et al., 2020). The results toward Class II disks found by Pegues et al. (2020) suggest a possible trend between the location of the H2CO emitting layer and the age of the disk, or perhaps a difference between disks around T Tauri and Herbig stars. Future multi-line observations toward a larger sample of disks with a consistent set of lines may help to elucidate whether this trend is real.
5.6 Small organics reservoir in the inner au
We can estimate the amount of HCN, C2H, and H2CO present in the inner disk regions. The gas masses within au are listed in Table 3. Because of the uncertainties of the fit in the inner disk, we extrapolated the column density profiles inward, assuming a constant column density starting from the radius where we obtain a good fit (see Fig. 4). This means that the HCN masses estimated for GM Aur, HD 163296, and MWC 480, which tend to have centrally peaked N profiles, could be larger than what we have estimated here. The total amount of HCN, C2H, and H2CO is, however, much larger because a large fraction of the organic reservoir is expected to reside in icy mantles. Indeed, as discussed before, the emission of these small organics arises in disk layers with temperatures of K, which are lower than the freeze-out temperature of these molecules. Assuming a conservative ice-to-gas ratio of 1000 (these ratios could be larger, as discussed in Öberg & MAPS team, 2021), we find a large amount ( g) of gas phase plus ice mantle HCN, C2H, and H2CO in the inner disks. Interestingly, the relative amounts of these organics varies between the disks. For example, H2CO is times more abundant than HCN and C2H in IM Lup, while H2CO is less abundant than HCN and C2H in the rest of the disks. HCN is more abundant (by a factor ) than both C2H and H2CO in GM Aur, HD 163296, and MWC 480, and AS 209 has a slightly larger C2H mass than HCN.
We can also compare the amount of organics with respect to water ice in these disks. The total water mass inside au was estimated from the models presented in Zhang & MAPS team (2021), and are listed in Table 1 of Öberg & MAPS team (2021). The abundance of total gas and ice HCN, C2H, and H2CO relative to water are listed in the right columns of Table 3. The fractions range from 0.5% to 1.1% and 0.02% to 1.8% for HCN and C2H, respectively, not taking into account IM Lup, which has much lower organic fractions of . The fractions for H2CO are lower, ranging from 0.001% to 0.08%. Typical abundances with respect to water in cometary ices range from 0.1% to 0.6% for HCN and from for H2CO (Mumma & Charnley, 2011), which are consistent with our organic fraction estimates.
The MAPS disks are therefore rich in organic species, suggesting that future comets formed in these disks could efficiently deliver water and other key organics to rocky planets forming in the inner disk.
6 Conclusions
We have presented spatially resolved observations of the small organics HCN, C2H, and H2CO toward a sample of five protoplanetary disks from the MAPS program. The main conclusions are the following:
-
1.
The line emission reveals substantial substructure, in particular toward the warmer disks around HD 163296 and MWC 480, where several rings are observed in HCN and C2H.
-
2.
We derive column density profiles and find the distributions vary across disks, suggesting that the specific physical conditions in each disk play a major role in setting the organic distribution in disks.
-
3.
We find similarities between the HCN and C2H distribution in the outer disk regions, suggesting a similar chemistry drives their formation, most likely photochemistry in the temperate disk layers.
-
4.
The HCN and C2H excitation temperatures, estimated by the and lines as well as the hyperfine structure of the lines, range between 20 and 60 K. The temperatures are higher for C2H, however, suggesting that the HCN emission arises in a colder and deeper layer than C2H, and is thus more sensitive to density variations.
-
5.
HD 163296 and MWC 480 show gaps in their HCN column density profiles, which spatially coincide with the location of planets suggested in previous studies. This opens the possibility of using HCN to trace gas density variations in disks, and finding the massive planets that could be carving these gaps.
-
6.
Contrary to HCN and C2H, H2CO emits from a much more extended region of the disks, far beyond the dust millimeter edge. H2CO is slightly more abundant in the colder disks around T Tauri stars than in disks around Herbig stars, but is particularly abundant in the GM Aur disk.
-
7.
We find enhanced H2CO column densities at the CO snowline location and another column density enhancement around the millimeter dust edge.
-
8.
We estimated the total gas plus ice mass inside au for the MAPS disks, and find large amounts ( g) of organic material, with fractions with respect to water ice that are consistent with fractions observed in comets of our Solar System.
We have shown that high angular resolution (down to au) and sensitivity observations from these small organics provide a window into the C, O, and N budget of disks. The inner 50 au regions of the MAPS disks are rich in organic species, so comets forming in these disks could potentially deliver water and other key organics to nascent rocky planets. Future observations toward other disks with different stellar masses, ages, and disk properties will provide a more complete picture of the organic reservoir in disks, and the impact these properties may have on the possible outcomes of planet formation.
Appendix A Disk-integrated line fluxes
The disk-integrated line fluxes and upper limits for the observed HCN, C2H, and H2CO lines are listed in Table A.1. For HCN and C2H, the integrated line fluxes include several hyperfine components that are blended in velocity. The fluxes were computed using elliptical masks that were constructed using the disk inclinations and position angles listed in Table 1, and an outer radius based on the observed extent of the emission of each line. The uncertainties were estimated by computing integrated fluxes using the same elliptical mask but centered at 500 random positions that are free from line emission in the map. The listed uncertainties correspond to the standard deviation of these line-free integrated fluxes.
| Molecule | Line | IM Lup | GM Aur | AS 209 | HD 163296 | MWC 480 |
|---|---|---|---|---|---|---|
| (mJy km s-1) | (mJy km s-1) | (mJy km s-1) | (mJy km s-1) | (mJy km s-1) | ||
| HCN | , | 88.3 14.4 | 113.4 14.8 | 226.8 15.9 | 736.3 58.3 | 138.6 19.6 |
| , | 2343.7 86.3 | 1814.6 130.5 | 2940.8 71.7 | 7043.3 459.3 | 2494.4 122.8 | |
| C2H | , , | 30 | 16 | 60.7 9.7 | 130.1 34.2 | 44.3 17.2 |
| , , | 8 | 13.9 | 40.1 11.9 | 56.1 14.1 | 15.1 | |
| , , | 430.8 59.3 | 294.2 97.9 | 1716.6 56.7 | 2527.5 223.1 | 1076.4 66.6 | |
| , , | 620.2 88.3 | 506.7 102.0 | 2119.7 73.9 | 3230.6 400.4 | 1418.0 72.7 | |
| , , | 37 | 77 | 142.4 33.8 | 188.4 69.4 | 36.3 18.2 | |
| H2CO | 752.2 72.1 | 900.0 56.7 | 292.5 27.9 | 813.4 78.1 | 144.5 38.9 |
Appendix B Simultaneous fit to the and lines
Figure B.1 shows the HCN and C2H column density and excitation temperature profiles found when fitting the and lines simultaneously. The spatial resolution of the profiles is 03 which corresponds to the resolution of the tapered version of the line images. An example with the resulting best-fit spectra found for AS 209 are shown in Fig. B.2. The weakest C2H hyperfine line listed in Table 2 and shown in the bottom panel of the figure is detected in all disks except IM Lup.


Appendix C Comparison of HCN column density profiles
The MAPS data were used to derive HCN column density profiles in two other papers. Bergner & MAPS team (2021) derived CN and HCN column density profiles using a column density retrieval method similar to the one presented here. Cataldi & MAPS team (2021) also derived HCN column density profiles, but using the lower angular resolution images because the goal was to compare them to the profiles of DCN. The Band 6 DCN line is faint and was not detected at high S/N in the high angular resolution images. The resulting HCN column density profiles from these different analyses are shown in Fig. C.1. The profiles are consistent for all disks, and differences are only observed in the inner disk where the fit is known to behave poorly.

References
- Ahrens et al. (2002) Ahrens, V., Lewen, F., Takano, S., et al. 2002, Zeitschrift Naturforschung Teil A, 57, 669, doi: 10.1515/zna-2002-0806
- Aikawa et al. (2003) Aikawa, Y., Momose, M., Thi, W.-F., et al. 2003, PASJ, 55, 11, doi: 10.1093/pasj/55.1.11
- Alarcón & MAPS team (2021) Alarcón, F., & MAPS team. 2021, ApJ, 0, 0, doi: 0
- Andrews (2020) Andrews, S. M. 2020, ARA&A, 58, 483, doi: 10.1146/annurev-astro-031220-010302
- Andrews et al. (2018) Andrews, S. M., Huang, J., Pérez, L. M., et al. 2018, ApJ, 869, L41, doi: 10.3847/2041-8213/aaf741
- Astropy Collaboration et al. (2013) Astropy Collaboration, Robitaille, T. P., Tollerud, E. J., et al. 2013, A&A, 558, A33, doi: 10.1051/0004-6361/201322068
- Avenhaus et al. (2018) Avenhaus, H., Quanz, S. P., Garufi, A., et al. 2018, ApJ, 863, 44, doi: 10.3847/1538-4357/aab846
- Becker et al. (2019) Becker, S., Feldmann, J., Wiedemann, S., et al. 2019, Science, 366, 76, doi: 10.1126/science.aax2747
- Bergin et al. (2016) Bergin, E. A., Du, F., Cleeves, L. I., et al. 2016, ApJ, 831, 101, doi: 10.3847/0004-637X/831/1/101
- Bergin et al. (2010) Bergin, E. A., Hogerheijde, M. R., Brinch, C., et al. 2010, A&A, 521, L33, doi: 10.1051/0004-6361/201015104
- Bergner & MAPS team (2021) Bergner, J., & MAPS team. 2021, ApJ, 0, 0, doi: 0
- Bergner et al. (2018) Bergner, J. B., Guzmán, V. G., Öberg, K. I., Loomis, R. A., & Pegues, J. 2018, ApJ, 857, 69, doi: 10.3847/1538-4357/aab664
- Bergner et al. (2019) Bergner, J. B., Öberg, K. I., Bergin, E. A., et al. 2019, ApJ, 876, 25, doi: 10.3847/1538-4357/ab141e
- Bocquet et al. (1996) Bocquet, R., Demaison, J., Poteau, L., et al. 1996, Journal of Molecular Spectroscopy, 177, 154, doi: 10.1006/jmsp.1996.0128
- Bosman & MAPS team (2021a) Bosman, A., & MAPS team. 2021a, ApJ, 0, 0, doi: 0
- Bosman & MAPS team (2021b) Bosman, A. D., & MAPS team. 2021b, ApJ, 0, 0, doi: 0
- Carney et al. (2017) Carney, M. T., Hogerheijde, M. R., Loomis, R. A., et al. 2017, A&A, 605, A21, doi: 10.1051/0004-6361/201629342
- Carney et al. (2019) Carney, M. T., Hogerheijde, M. R., Guzmán, V. V., et al. 2019, A&A, 623, A124, doi: 10.1051/0004-6361/201834353
- Cataldi & MAPS team (2021) Cataldi, G., & MAPS team. 2021, ApJ, 0, 0, doi: 0
- Cazzoletti et al. (2018) Cazzoletti, P., van Dishoeck, E. F., Visser, R., Facchini, S., & Bruderer, S. 2018, A&A, 609, A93, doi: 10.1051/0004-6361/201731457
- Chapillon et al. (2012) Chapillon, E., Guilloteau, S., Dutrey, A., Piétu, V., & Guélin, M. 2012, A&A, 537, A60, doi: 10.1051/0004-6361/201116762
- Chuang et al. (2017) Chuang, K. J., Fedoseev, G., Qasim, D., et al. 2017, MNRAS, 467, 2552, doi: 10.1093/mnras/stx222
- Cleeves (2016) Cleeves, L. I. 2016, ApJ, 816, L21, doi: 10.3847/2041-8205/816/2/L21
- Cleeves et al. (2015) Cleeves, L. I., Bergin, E. A., & Harries, T. J. 2015, ApJ, 807, 2, doi: 10.1088/0004-637X/807/1/2
- Cleeves et al. (2016) Cleeves, L. I., Bergin, E. A., O’D. Alexander, C. M., et al. 2016, ApJ, 819, 13, doi: 10.3847/0004-637X/819/1/13
- Cleeves et al. (2018) Cleeves, L. I., Öberg, K. I., Wilner, D. J., et al. 2018, ApJ, 865, 155, doi: 10.3847/1538-4357/aade96
- Czekala & MAPS team (2021) Czekala, I., & MAPS team. 2021, ApJ, 0, 0, doi: 0
- Du et al. (2015) Du, F., Bergin, E. A., & Hogerheijde, M. R. 2015, ApJ, 807, L32, doi: 10.1088/2041-8205/807/2/L32
- Du et al. (2017) Du, F., Bergin, E. A., Hogerheijde, M., et al. 2017, ApJ, 842, 98, doi: 10.3847/1538-4357/aa70ee
- Dutrey et al. (2008) Dutrey, A., Guilloteau, S., Piétu, V., et al. 2008, A&A, 490, L15, doi: 10.1051/0004-6361:200810732
- Favre et al. (2018) Favre, C., Fedele, D., Semenov, D., et al. 2018, ApJ, 862, L2, doi: 10.3847/2041-8213/aad046
- Foreman-Mackey et al. (2013) Foreman-Mackey, D., Hogg, D. W., Lang, D., & Goodman, J. 2013, PASP, 125, 306, doi: 10.1086/670067
- Fuchs et al. (2009) Fuchs, G. W., Cuppen, H. M., Ioppolo, S., et al. 2009, A&A, 505, 629, doi: 10.1051/0004-6361/200810784
- Guzmán et al. (2018) Guzmán, V. V., Öberg, K. I., Carpenter, J., et al. 2018, ApJ, 864, 170, doi: 10.3847/1538-4357/aad778
- Guzmán et al. (2015) Guzmán, V. V., Öberg, K. I., Loomis, R., & Qi, C. 2015, ApJ, 814, 53, doi: 10.1088/0004-637X/814/1/53
- Henning & Semenov (2008) Henning, T., & Semenov, D. 2008, in Organic Matter in Space, ed. S. Kwok & S. Sanford, Vol. 251, 89–98, doi: 10.1017/S1743921308021261
- Hidaka et al. (2004) Hidaka, H., Watanabe, N., Shiraki, T., Nagaoka, A., & Kouchi, A. 2004, ApJ, 614, 1124, doi: 10.1086/423889
- Hily-Blant et al. (2019) Hily-Blant, P., Magalhaes de Souza, V., Kastner, J., & Forveille, T. 2019, A&A, 632, L12, doi: 10.1051/0004-6361/201936750
- Hogerheijde et al. (2011) Hogerheijde, M. R., Bergin, E. A., Brinch, C., et al. 2011, Science, 334, 338, doi: 10.1126/science.1208931
- Huang et al. (2017) Huang, J., Öberg, K. I., Qi, C., et al. 2017, ApJ, 835, 231, doi: 10.3847/1538-4357/835/2/231
- Huang et al. (2018) Huang, J., Andrews, S. M., Dullemond, C. P., et al. 2018, ApJ, 869, L42, doi: 10.3847/2041-8213/aaf740
- Huang et al. (2020) —. 2020, ApJ, 891, 48, doi: 10.3847/1538-4357/ab711e
- Isella et al. (2016) Isella, A., Guidi, G., Testi, L., et al. 2016, Phys. Rev. Lett., 117, 251101, doi: 10.1103/PhysRevLett.117.251101
- Kastner et al. (2018) Kastner, J. H., Qi, C., Dickson-Vandervelde, D. A., et al. 2018, ApJ, 863, 106, doi: 10.3847/1538-4357/aacff7
- Law & MAPS team (2021a) Law, C., & MAPS team. 2021a, ApJ, 0, 0, doi: 0
- Law & MAPS team (2021b) —. 2021b, ApJ, 0, 0, doi: 0
- Liu et al. (2019) Liu, Y., Dipierro, G., Ragusa, E., et al. 2019, A&A, 622, A75, doi: 10.1051/0004-6361/201834157
- Long et al. (2018) Long, F., Pinilla, P., Herczeg, G. J., et al. 2018, ApJ, 869, 17, doi: 10.3847/1538-4357/aae8e1
- Loomis et al. (2018) Loomis, R. A., Cleeves, L. I., Öberg, K. I., et al. 2018, ApJ, 859, 131, doi: 10.3847/1538-4357/aac169
- Loomis et al. (2015) Loomis, R. A., Cleeves, L. I., Öberg, K. I., Guzman, V. V., & Andrews, S. M. 2015, ApJ, 809, L25, doi: 10.1088/2041-8205/809/2/L25
- Mathews et al. (2013) Mathews, G. S., Klaassen, P. D., Juhász, A., et al. 2013, A&A, 557, A132, doi: 10.1051/0004-6361/201321600
- McClure et al. (2016) McClure, M. K., Bergin, E. A., Cleeves, L. I., et al. 2016, ApJ, 831, 167, doi: 10.3847/0004-637X/831/2/167
- McMullin et al. (2007) McMullin, J. P., Waters, B., Schiebel, D., Young, W., & Golap, K. 2007, in Astronomical Society of the Pacific Conference Series, Vol. 376, Astronomical Data Analysis Software and Systems XVI, ed. R. A. Shaw, F. Hill, & D. J. Bell, 127
- Miotello et al. (2019) Miotello, A., Facchini, S., van Dishoeck, E. F., et al. 2019, A&A, 631, A69, doi: 10.1051/0004-6361/201935441
- Monnier et al. (2017) Monnier, J. D., Harries, T. J., Aarnio, A., et al. 2017, ApJ, 838, 20, doi: 10.3847/1538-4357/aa6248
- Müller et al. (2005) Müller, H. S. P., Schlöder, F., Stutzki, J., & Winnewisser, G. 2005, Journal of Molecular Structure, 742, 215, doi: 10.1016/j.molstruc.2005.01.027
- Müller et al. (2001) Müller, H. S. P., Thorwirth, S., Roth, D. A., & Winnewisser, G. 2001, A&A, 370, L49, doi: 10.1051/0004-6361:20010367
- Mumma & Charnley (2011) Mumma, M. J., & Charnley, S. B. 2011, ARA&A, 49, 471, doi: 10.1146/annurev-astro-081309-130811
- Najita et al. (2013) Najita, J. R., Carr, J. S., Pontoppidan, K. M., et al. 2013, ApJ, 766, 134, doi: 10.1088/0004-637X/766/2/134
- Najita et al. (2018) Najita, J. R., Carr, J. S., Salyk, C., et al. 2018, ApJ, 862, 122, doi: 10.3847/1538-4357/aaca39
- Öberg & Bergin (2021) Öberg, K. I., & Bergin, E. A. 2021, Phys. Rep., 893, 1, doi: 10.1016/j.physrep.2020.09.004
- Öberg et al. (2015) Öberg, K. I., Guzmán, V. V., Furuya, K., et al. 2015, Nature, 520, 198, doi: 10.1038/nature14276
- Öberg & MAPS team (2021) Öberg, K. I., & MAPS team. 2021, ApJ, 0, 0, doi: 0
- Öberg et al. (2011) Öberg, K. I., Qi, C., Fogel, J. K. J., et al. 2011, ApJ, 734, 98, doi: 10.1088/0004-637X/734/2/98
- Öberg et al. (2017) Öberg, K. I., Guzmán, V. V., Merchantz, C. J., et al. 2017, ApJ, 839, 43, doi: 10.3847/1538-4357/aa689a
- Padovani et al. (2009) Padovani, M., Walmsley, C. M., Tafalla, M., Galli, D., & Müller, H. S. P. 2009, A&A, 505, 1199, doi: 10.1051/0004-6361/200912547
- Patel et al. (2015) Patel, B. H., Percivalle, C., Ritson, D. J., Duffy, C. D., & Sutherland, J. D. 2015, Nature Chemistry, 7, 301, doi: 10.1038/nchem.2202
- Pegues et al. (2020) Pegues, J., Öberg, K. I., Bergner, J. B., et al. 2020, ApJ, 890, 142, doi: 10.3847/1538-4357/ab64d9
- Pérez et al. (2020) Pérez, S., Casassus, S., Hales, A., et al. 2020, ApJ, 889, L24, doi: 10.3847/2041-8213/ab6b2b
- Pickett et al. (1998) Pickett, H. M., Poynter, R. L., Cohen, E. A., et al. 1998, J. Quant. Spec. Radiat. Transf., 60, 883, doi: 10.1016/S0022-4073(98)00091-0
- Pinte et al. (2018a) Pinte, C., Ménard, F., Duchêne, G., et al. 2018a, A&A, 609, A47, doi: 10.1051/0004-6361/201731377
- Pinte et al. (2018b) Pinte, C., Price, D. J., Ménard, F., et al. 2018b, ApJ, 860, L13, doi: 10.3847/2041-8213/aac6dc
- Pinte et al. (2020) —. 2020, ApJ, 890, L9, doi: 10.3847/2041-8213/ab6dda
- Podio et al. (2020) Podio, L., Garufi, A., Codella, C., et al. 2020, A&A, 642, L7, doi: 10.1051/0004-6361/202038952
- Powner et al. (2009) Powner, M. W., Gerland, B., & Sutherland, J. D. 2009, Nature, 459, 239, doi: 10.1038/nature08013
- Price-Whelan et al. (2018) Price-Whelan, A. M., Sipőcz, B. M., Günther, H. M., et al. 2018, AJ, 156, 123, doi: 10.3847/1538-3881/aabc4f
- Rab et al. (2020) Rab, C., Kamp, I., Dominik, C., et al. 2020, A&A, 642, A165, doi: 10.1051/0004-6361/202038712
- Rich et al. (2020) Rich, E. A., Wisniewski, J. P., Sitko, M. L., et al. 2020, ApJ, 902, 4, doi: 10.3847/1538-4357/abb2a3
- Rosenfeld et al. (2013) Rosenfeld, K. A., Andrews, S. M., Hughes, A. M., Wilner, D. J., & Qi, C. 2013, ApJ, 774, 16, doi: 10.1088/0004-637X/774/1/16
- Salinas et al. (2017) Salinas, V. N., Hogerheijde, M. R., Mathews, G. S., et al. 2017, A&A, 606, A125, doi: 10.1051/0004-6361/201731223
- Salyk et al. (2011) Salyk, C., Pontoppidan, K. M., Blake, G. A., Najita, J. R., & Carr, J. S. 2011, ApJ, 731, 130, doi: 10.1088/0004-637X/731/2/130
- Sastry et al. (1981) Sastry, K. V. L. N., Helminger, P., Charo, A., Herbst, E., & De Lucia, F. C. 1981, ApJ, 251, L119, doi: 10.1086/183706
- Shirley (2015) Shirley, Y. L. 2015, PASP, 127, 299, doi: 10.1086/680342
- Sierra & MAPS team (2021) Sierra, A., & MAPS team. 2021, ApJ, 0, 0, doi: 0
- Sokal et al. (2018) Sokal, K. R., Deen, C. P., Mace, G. N., et al. 2018, ApJ, 853, 120, doi: 10.3847/1538-4357/aaa1e4
- Teague (2019) Teague, R. 2019, The Journal of Open Source Software, 4, 1632, doi: 10.21105/joss.01632
- Teague (2019) Teague, R. 2019, The Journal of Open Source Software, 4, 1632, doi: 10.21105/joss.01632
- Teague et al. (2018a) Teague, R., Bae, J., Bergin, E. A., Birnstiel, T., & Foreman-Mackey, D. 2018a, ApJ, 860, L12, doi: 10.3847/2041-8213/aac6d7
- Teague et al. (2018b) Teague, R., Bae, J., Birnstiel, T., & Bergin, E. A. 2018b, ApJ, 868, 113, doi: 10.3847/1538-4357/aae836
- Teague & Loomis (2020) Teague, R., & Loomis, R. 2020, ApJ, 899, 157, doi: 10.3847/1538-4357/aba956
- Teague & MAPS team (2021) Teague, R., & MAPS team. 2021, ApJ, 0, 0, doi: 0
- Terwisscha van Scheltinga et al. (2021) Terwisscha van Scheltinga, J., Hogerheijde, M. R., Cleeves, L. I., et al. 2021, ApJ, 906, 111, doi: 10.3847/1538-4357/abc9ba
- van der Walt et al. (2011) van der Walt, S., Colbert, S. C., & Varoquaux, G. 2011, Computing in Science and Engineering, 13, 22, doi: 10.1109/MCSE.2011.37
- van’t Hoff et al. (2020) van’t Hoff, M. L. R., Harsono, D., Tobin, J. J., et al. 2020, ApJ, 901, 166, doi: 10.3847/1538-4357/abb1a2
- Virtanen et al. (2020) Virtanen, P., Gommers, R., Oliphant, T. E., et al. 2020, Nature Methods, doi: https://doi.org/10.1038/s41592-019-0686-2
- Walsh et al. (2016) Walsh, C., Loomis, R. A., Öberg, K. I., et al. 2016, ApJ, 823, L10, doi: 10.3847/2041-8205/823/1/L10
- Watanabe & Kouchi (2002) Watanabe, N., & Kouchi, A. 2002, ApJ, 571, L173, doi: 10.1086/341412
- Watanabe et al. (2004) Watanabe, N., Nagaoka, A., Shiraki, T., & Kouchi, A. 2004, ApJ, 616, 638, doi: 10.1086/424815
- Williams & Cieza (2011) Williams, J. P., & Cieza, L. A. 2011, ARA&A, 49, 67, doi: 10.1146/annurev-astro-081710-102548
- Zhang & MAPS team (2021) Zhang, K., & MAPS team. 2021, ApJ, 0, 0, doi: 0