[1,2]\fnmJilun \surYe
[1]\fnmXu \surZhang
1]\orgdivSchool of Medicine, \orgnameShenzhen University, \orgaddress\streetXueyuan Avenue 1066, \cityShenzhen, \postcode518055, \stateGuangdong Province, \countryChina
2]\orgnameWitleaf Medical Electronics Co., \orgaddress\streetGuangming District, \cityShenzhen, \postcode518132, \stateGuangdong Province, \countryChina
MobileNetV2: A lightweight classification model for home-based sleep apnea screening
Abstract
Obstructive Sleep Apnea (OSA) is a prevalent sleep disorder linked to severe complications such as hypertension, stroke, and epilepsy, posing significant health risks. Despite its high prevalence, early diagnosis of OSA remains challenging due to the high cost of screening and limited accessibility to specialized sleep centers, leading to a large number of undiagnosed cases. While neural networks have demonstrated high classification accuracy in OSA screening, their large size often limits their applicability to wearable devices, constraining practical use.
This study proposes a novel lightweight neural network model leveraging features extracted from electrocardiogram (ECG) and respiratory signals for early OSA screening. ECG signals are used to generate feature spectrograms to predict sleep stages, while respiratory signals are employed to detect sleep-related breathing abnormalities. By integrating these predictions, the method calculates the apnea-hypopnea index (AHI) with enhanced accuracy, facilitating precise OSA diagnosis.
The method was validated on three publicly available sleep apnea databases: the Apnea-ECG database, the UCDDB dataset, and the MIT-BIH Polysomnographic database. Results showed an overall OSA detection accuracy of 0.978, highlighting the model’s robustness. Respiratory event classification achieved an accuracy of 0.969 and an area under the receiver operating characteristic curve (ROC-AUC) of 0.98. For sleep stage classification, in UCDDB dataset, the ROC-AUC exceeded 0.85 across all stages, with recall for Sleep reaching 0.906 and specificity for REM and Wake states at 0.956 and 0.937, respectively.
This study underscores the potential of integrating lightweight neural networks with multi-signal analysis for accurate, portable, and cost-effective OSA screening, paving the way for broader adoption in home-based and wearable health monitoring systems.
keywords:
Sleep Apnea, MobileNetV2, Wearable Devices1 Introduction
Obstructive sleep apnea(OSA) is a common sleep disorder characterized by repeated cessation of breathing during sleep[1]. The prevalence of OSA in the population ranges from 9% to 38% and increases with age, with the probability of moderate to severe OSA being as high as 49% in the senior population[2]. OSA is emerging as a major health problem that cause complications like hypertension, stroke, diabetes and epilepsy[3, 4]. Despite its high prevalence, OSA has reported to be undiagnosed in 85% of potential patients[5], due to the high costs of screening and the limited availability of sleep centers. Traditional PSG screening method is performed in sleep centers with sensors including electroencephalogram(EEG), electrocardiogram (ECG), nasal airflow, pulse oximeter(SpO2), respiratory effort chest belts, and others. Therefore, the development of a portable, easy-to-use, and cost-effective rapid screening tool for OSA should be a current priority.
Research has shown that convolutional neural networks (CNNs) provide an effective solution for interpreting and learning from physiological signal sequences, as deep learning algorithms can automatically extract complex features from raw data, enhancing both diagnostic accuracy and robustness[6]. Since AlexNet?s success in the 2012 ImageNet Challenge[7], deep convolutional networks have trended towards increasing depth and structural complexity[8, 9]. While this can improve model accuracy, it often results in larger network sizes and slower computation. Due to hardware and computational limitations, complex deep learning models are challenging to deploy on mobile devices.
In response, this study proposes a lightweight deep convolutional approach for sleep apnea monitoring and validates the model’s performance using three publicly available datasets.
2 Materials and Methods
2.1 Dataset
The proposed method was validated using three publicly available datasets:
1. Apnea-ECG Database[10]: Contains 70 ECG recordings with a sampling rate of 100 Hz. Selected records (a01-a04, b01, c01-c03) include both ECG and blood oxygen data.
2. UCDDB Dataset[11]: Comprises overnight PSG data from 25 patients with a sampling rate of 128 Hz, used for sleep stage differentiation.
3. MIT-BIH Polysomnographic Database[12]: Includes 18 multi-channel recordings with a sampling rate of 128 Hz, broadening the model’s predictive scope.
2.2 Data preprocessing
As reported in the literature[13], 1-minute data segments are more advantageous for screening respiratory events, while sleep stages are typically divided into 30-second segments. In this study, ECG data is uniformly divided into 1-minute segments, with a sliding window of 30 seconds, like Fig 1. This approach encompasses sleep states while preventing respiratory events from being split due to the segmentation. To more accurately calculate the AHI index, sleep periods in this study are classified into two states: Sleep (S) and Non-Sleep (NS). Segments labeled as N1, N2, N3, and N4 are considered as Sleep (S) states.

After re-segmenting the signals, we applied bandpass filter (0.3-45Hz) to the single-lead ECG to remove baseline offsets and power disturbances.Observing fluctuations and artifacts in the signals in two datasets, we applied the following two treatments to the ECG and SpO2, respectively:
For SpO2, it in healthy humans is chronically stable at 97% or higher, while in critically ill patients undergoing surgery it is between 80% and 100%[14]. Therefore, we only retained the 60-second epochs with SpO2 in the 70% to 100% range. You can see those non-compliant SpO2 data in Fig 2.

For ECG, we divided each 60-second segment into six 10-second subsegments and extracted the maximum and minimum values from each. The median of the six maximum values was set as threshold th1, and the median of the six minimum values as threshold th2. If any value within a subsegment exceeds 2*th1 or falls below 2*th2, the subsegment is considered contaminated. The contaminated 60-second segments are given in Fig 3.


Studies indicate that the respiratory-derived signal (EDR) extracted from ECG closely resembles the original respiratory signal[15, 16]. During sleep, events like restricted or paused breathing cause marked rhythmic changes in the RR interval of ECG signals[17]. Building on this, we extracted QRS feature points from clean ECG signals. Fig 4 illustrates ECG signals under normal conditions and during respiratory events, while Fig 5 compares actual respiratory signals with simulated EDR signals. Given ECG?s ability to capture both respiratory and sleep information, we populated sequences for RR interval, Q-wave amplitude, R-wave amplitude, EDR amplitude, and EDR peak intervals to lengths of 200, 200, 200, 100, and 100 points, respectively. As shown in Fig 6, these populated feature sequences were input into a neural network model for sleep stage classification.


2.3 Model architecture
The MobileNet model is based on depth-separable convolution, which is a form of decomposed convolution. This form decomposes the standard convolution into a depth convolution and a 1x1 convolution called point-by-point convolution. Fig 7 illustrates the difference in feature extraction between depthwise and pointwise convolutions. This design reduces parameters and computational load, making it well-suited for mobile applications.

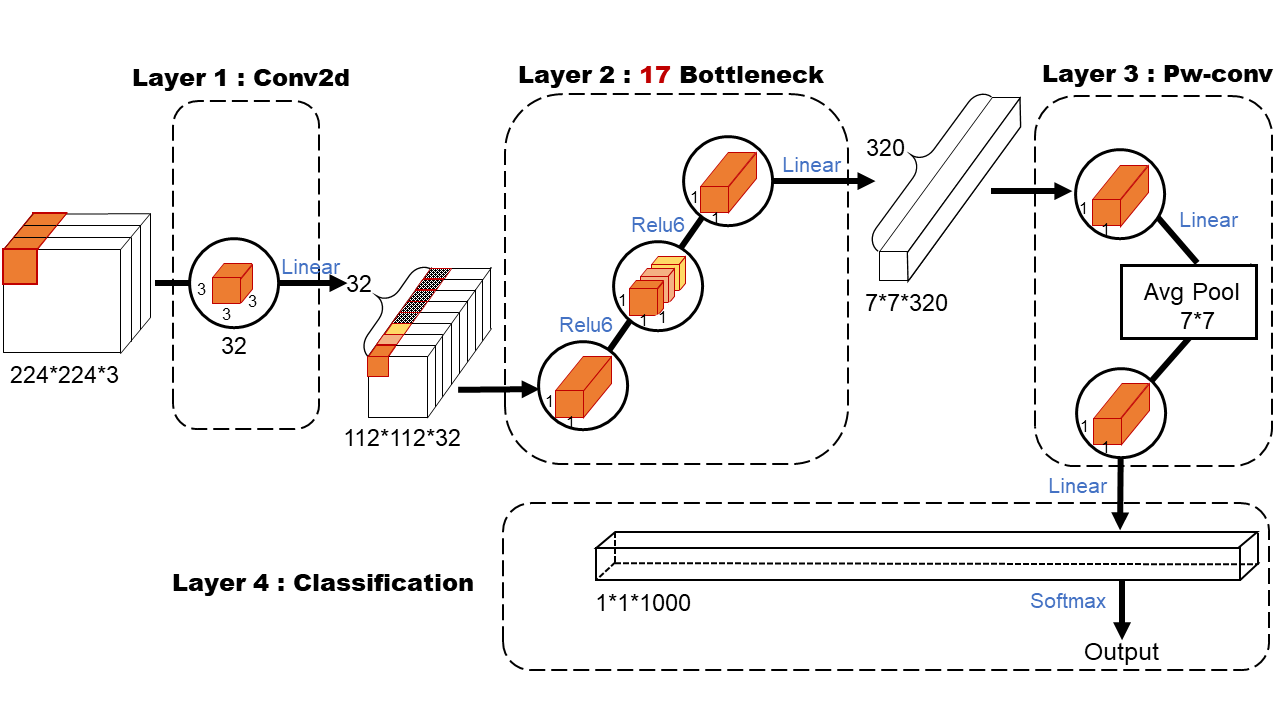
According to existing study[Howard2017-fq, 18], we usd MobileNet to build an optimal OSA detection model, as shown in Fig 8. The first layer is a standard convolutional layer with 32 filters of size 3x3x3, which undergo batch normalization and ReLU activation before passing to the second layer. The second layer utilizes an inverted residual structure: initially, a pointwise convolution expands the dimensionality, activated by ReLU6, followed by a depthwise convolution with ReLU6 activation, and finally a pointwise convolution reduces the dimensionality with a linear activation. This layer includes 17 inverted residual blocks, also known as ”bottlenecks.” The addition of ReLU6 minimizes the loss of high-dimensional information post-convolution. In the third layer, feature map expansion is achieved via pointwise convolution, followed by dimensionality reduction using an average pooling layer to prevent overfitting. A final 1x1 pointwise convolution adjusts the number of channels in the feature map. In the fourth layer, softmax activation is applied to the fully connected layer for classification predictions, where all neurons are fully connected and learning occurs through forward and backpropagation algorithms.
Note that after each convolution (either normal convolution, deep convolution or point-by-point convolution) a batch normalization and activation function operation is performed, which is omitted in Fig 8.
3 Results
3.1 Experiment setup
The deep learning framework selected for this experiment is Huawei’s self-developed MindSpore. During model training, the Adam optimizer is used. The batch size is set to 32, and the number of epochs is set to 20. The ECG data from 25 subjects in the UCDDB dataset is uniformly classified into two states: Sleep (S) and Non-Sleep (NS), and then input into the MobileNetV2 model for training. Subsequently, the overnight data from each subject in the Apnea-ECG and MIT-BIH datasets is fed into the model for sleep duration prediction. Finally, a rule-based screening algorithm designed for respiratory signals in the MATLAB platform is used to compute the AHI index for each subject, which is then compared with the AHI values provided in the datasets. More details can be found in Table 1.
| Number | Train set (UCDDB) | MIT-BIH | Apnea-ECG |
|---|---|---|---|
| Sleep | 13614 | 6268 | 7466 |
| Non-Sleep | 5974 | 3680 |
3.2 Performance evaluation
We use statistical values (like accuracy, precision, recall, specificity and Roc) to quantify the performance of our model. The formulas for these parameters are shown in Equation 1, 2, 3, 4, 5, where TP, FP, TN, and FN are true positive, false positive, true negative, and false negative, respectively.
| (1) |
| (2) |
| (3) |
| (4) |
| (5) |
3.3 Classification performances
In this study, we performed the detection of respiratory abnormal events using data from the Apnea-ECG dataset, specifically focusing on two different sample sizes: a small sample of 8 individuals and a larger sample of 50 individuals. For each frame, which corresponds to a 1-minute segment of the Electrocardiogram-derived Respiratory (EDR) signal spectrogram, the classification results of the model are shown in Fig 9. Since the Apnea-Hypopnea Index (AHI) is considered the gold standard for diagnosing sleep apnea syndromes (SAS) and other sleep-related breathing disorders, its accurate computation is crucial. The calculation of AHI relies heavily on the precise measurement of sleep duration, as defined by Equation 6.
| (6) |


To enhance the prediction accuracy, we employed the UCDDB dataset, applying our model to perform sleep stage classification and normal/abnormal respiratory status identification during sleep. Specifically, we performed a three-class prediction to differentiate the stages of sleep and a binary classification to distinguish between normal and abnormal respiratory events. The results of these predictions are presented in Fig 10. The model demonstrated strong performance in recognizing respiratory states in each frame, as well as accurately identifying sleep stages.


Given that early screening tools are typically used for interpreting full-night data for individual users, there is inherent variability between individuals in terms of sleep patterns and breathing characteristics. To address this variability, we further expanded the dataset by incorporating the MIT-BIH database, dividing the data by individual subjects rather than categorizing it solely by disease type. After training the model using data from specific subjects, the prediction results for each individual are shown in Fig 11, 12. These results indicate that our model is capable of accurately and promptly providing personalized disease risk assessments, tailored to individual users. This is particularly significant for personalized health monitoring and early diagnosis, as it reflects the model’s ability to generalize across diverse user profiles.
The four-class classification task aims to categorize the AHI index into the following classes: Normal (AHI<5), Mild (5 AHI<15), Moderate ((15 AHI<30), and Severe (AHI>30). The confusion matrix for three datasets is presented in Fig 11(a), where the rows represent the predicted classes, and the columns represent the true classes. The confusion matrices show how well the model differentiates between the different AHI levels. In view of the target group of our early screening instrument, we uniformly regard those with an AHI greater than 5 as having a risk of SAS disease, and those with an AHI less than or equal to 5 as normal, as shown in Fig 11(b).


From the confusion matrices, it can be observed that the model performs well in distinguishing between Normal and Severe classes across all datasets. However, misclassifications are more frequent in the Mild and Moderate classes, where there are more off-diagonal entries, suggesting a challenge in differentiating between these intermediate AHI levels.
The performance of the model is quantitatively assessed using the following metrics: Accuracy (ACC), Recall, Precision, F1-score, and the Macro-average of these metrics across all four classes. The results are summarized in Table 2.
| Precision | Recall | Specificity | F1-score | Acc | |
|---|---|---|---|---|---|
| SAS | 0.978 | 0.978 | 0.800 | 0.978 | 0.960 |
| Non-SAS | 0.800 | 0.800 | 0.978 | 0.800 |
To enhance the robustness of our findings, we performed a comparative analysis with recent studies that utilized similar lightweight neural network models for obstructive sleep apnea (OSA) detection. This comparison highlights the advantages and limitations of our approach.
Our model demonstrated high classification accuracy across all datasets, achieving a mean accuracy of 0.978 for OSA detection. Precision, recall, and F1-scores were also consistently high. Specifically, for the Apnea-ECG dataset, the ROC-AUC was 0.98, underscoring the robustness of our model. This performance was compared to other state-of-the-art methods as shown in Table 3.
| Study | Model | Dataset | Accuracy | ROC-AUC |
|---|---|---|---|---|
| Apnea-ECG(8) | 0.970 | 0.98 | ||
| Apnea-ECG(50) | 0.780 | 0.87 | ||
| Our Study | MobileNetV2 | UCDDB(24) | 0.831 | 0.85 |
| Apnea-ECG UCDDB MIT-BIH (50) | 0.960 | – | ||
| Novak et al. (2008) [19] | LSTM-Based | Apnea-ECG | 0.897 | – |
| Pathinarupothi et al. (2017) [20] | LSTM ( + IHR) | OSA Dataset | 0.921 | 0.99 |
| Li et al. (2018) [21] | ANN-HMM | Single-lead ECG | 0.889 | 0.869 |
| Thompson et al. (2020) [22] | 1D-CNN | Apnea-ECG | 0.938 | 0.9945 |
| Chen et al. (2022) [23] | CNN-BiGRU | UCDDB | 0.923 | 0.890 |
Despite these promising results, we observed that the model’s runtime remains a challenge, particularly when deployed on large-scale datasets or resource-constrained environments. To address this, quantization techniques from LLMEasyQuant [24] could be adapted to optimize the computational efficiency of MobileNetV2, while dynamic graph sampling strategies from GraphSnapShot [25] might aid in processing patient data that includes temporal and spatial dependencies [26]. These advancements provide a foundation for further exploration into efficient and scalable approaches, enhancing the applicability of lightweight models in real-world healthcare scenarios.
In addition to the confusion matrices and classification metrics, we further evaluate the model’s performance by comparing the real AHI values with the predicted (calculated) AHI values for each dataset. In Fig 12, line plots are presented for each dataset to visualize the correspondence between the true AHI values and the model’s predictions over the entire set of subjects. These plots provide an insightful way to assess the overall fit and the model’s ability to approximate the true AHI levels across different stages of sleep apnea severity.

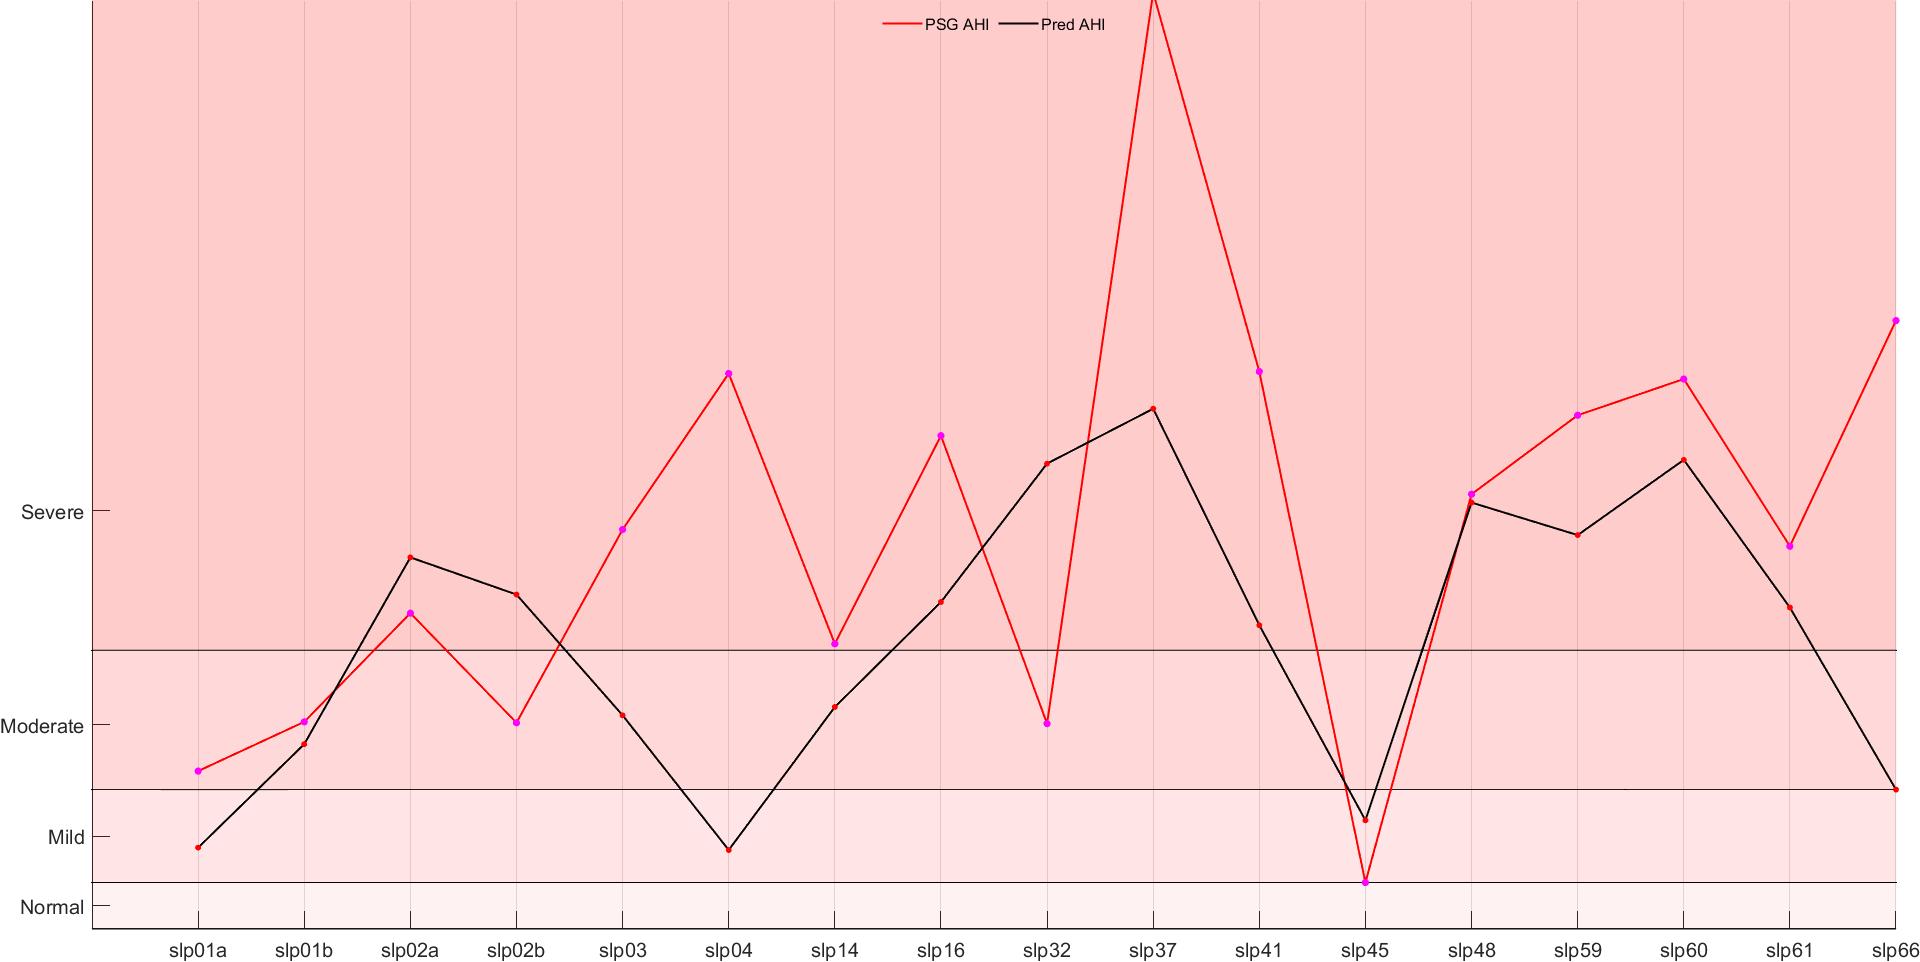

The real vs. predicted AHI line plots serve as a visual confirmation of the model’s predictive capabilities. The strong alignment between the true and predicted values across all datasets indicates that the model is effective in approximating the AHI values with high accuracy. Although some deviations are observed, particularly in the Mild and Moderate AHI categories, these can be attributed to the inherent challenges in distinguishing between these similar levels of severity. Overall, the line plot analysis reinforces the favorable results obtained from the confusion matrix and evaluation metrics, suggesting that the model is highly effective for the task of sleep apnea classification based on AHI prediction.
The integration of predicted and actual AHI (Apnea-Hypopnea Index) data from three publicly available databases enabled us to construct comprehensive AHI prediction and ground truth curves for a cohort of 50 individuals, as Fig 13. Statistical analysis revealed a strong correlation between the predicted and actual curves, with a Pearson correlation coefficient of 0.8831. This high degree of concordance underscores the robustness of the proposed model in accurately predicting AHI values across diverse datasets and individual cases, demonstrating its potential applicability in clinical and wearable health-monitoring settings.

4 Conclusion
The proposed machine learning model demonstrates promising results for the classification of AHI indices in the context of sleep apnea screening. The confusion matrices reveal that the model is generally effective at identifying Normal and Severe classes, but it encounters more difficulty in distinguishing between the Mild and Moderate categories, likely due to the similarities in these intermediate states. The overall accuracy, recall, precision, and F1-score metrics further validate the model’s robustness in the task of sleep apnea classification.
The results of this study have important implications, especially in improving the efficiency of early screening for sleep apnea syndrome (OSA). By combining blood oxygenation and ECG signals and utilizing a lightweight neural network model, this approach is not only able to rival traditional complex models (e.g., PSG) in terms of accuracy, but also has the potential to be practically applied to smart wearable devices. This could help to significantly reduce screening costs and improve the current low diagnosis rate of OSA due to expensive equipment and insufficient medical resources. Meanwhile, the method can also provide a new technical route for other disease detection and sleep health monitoring based on ECG and blood oxygen signals.
Our MobileNetV2 model achieved superior accuracy and ROC-AUC metrics. This improvement is attributable to the integration of ECG and respiratory signal features, along with advanced preprocessing techniques to mitigate noise artifacts. While Howard et al.[27] leveraged a similar architecture, their results on the MIT-BIH dataset fell short due to less comprehensive signal integration. However, certain limitations should be acknowledged. Misclassification rates were higher in the mild and moderate OSA categories, suggesting room for improvement in feature extraction and training methodologies. Future work will explore hybrid models combining convolutional and recurrent architectures to address these challenges.
Supplementary information None.
Acknowledgements The authors acknowledge all the participants and survey staffs for their participation. The work in this paper was carried out as a Shenzhen Science and Technology Major Project ’Heavy 2023 24N122 Key Technology Research and Development of Intelligent Sleep Monitoring and Analysis System’. In addition, the authors of the paper give extra thanks to Huawei’s open source AI framework MindSpore. Our code are available at https://github.com/mindspore-lab/models/tree/master/research/arxiv_papers/Easy-MobileNetV2.
Declarations
-
•
Funding This study was funded by the Shenzhen Science and Technology Major Project (KJZD20230923114306013);
-
•
Conflict of interest/Competing interests None.
-
•
Ethics approval and consent to participate The study was conducted according to the World Medical Association Declaration of Helsinki in 1975, as revised in 1983, and was approved by the Ethic Committee of Shanghai Jiao Tong University Affiliated Sixth People’s Hospital (Trial registration number: ChiCTR1900025714). All subjects provided their informed written consent
-
•
Consent for publication Not applicable.
-
•
Data availability No datasets were generated or analysed during the current study.
-
•
Author contribution The authors take responsibility and vouch for the accuracy and completeness of the data and analyses. Prof. ZX, YJL had full access to all of the data in the study and took responsibility for the integrity of the data and the accuracy of the data analysis. Study design: ZX; Data collection:PH; Statistical analysis: PH, YYX; Manuscript draft: PH, YYX, ZX. The authors have seen and approved the manuscript
References
- \bibcommenthead
- [1] Sleep–related breathing disorders in adults: Recommendations for syndrome definition and measurement techniques in clinical research. Sleep 22(5), 667–689 (1999)
- Senaratna et al. [2017] Senaratna, C.V., Perret, J.L., Lodge, C.J., Lowe, A.J., Campbell, B.E., Matheson, M.C., Hamilton, G.S., Dharmage, S.C.: Prevalence of obstructive sleep apnea in the general population: A systematic review. Sleep Med. Rev. 34, 70–81 (2017)
- Lloyd et al. [2024] Lloyd, R.M., Crawford, T., Donald, R., Gray, D.D., Healy, W.J., Junna, M.R., Lewin, D., Revana, A., Schutte-Rodin, S.: Quality measure for screening for adult obstructive sleep apnea by primary care providers: 2024 update after measure maintenance. J. Clin. Sleep Med. (2024)
- Chervin [2000] Chervin, R.D.: Sleepiness, fatigue, tiredness, and lack of energy in obstructive sleep apnea. Chest 118(2), 372–379 (2000)
- Motamedi et al. [2009] Motamedi, K.K., McClary, A.C., Amedee, R.G.: Obstructive sleep apnea: a growing problem. Ochsner J. 9(3), 149–153 (2009)
- Mostafa et al. [2019] Mostafa, S.S., Mendonça, F., Ravelo-García, A.G., Morgado-Dias, F.: A systematic review of detecting sleep apnea using deep learning. Sensors (Basel) 19(22), 4934 (2019)
- Krizhevsky et al. [2017] Krizhevsky, A., Sutskever, I., Hinton, G.E.: ImageNet classification with deep convolutional neural networks. Commun. ACM 60(6), 84–90 (2017)
- Simonyan and Zisserman [2014] Simonyan, K., Zisserman, A.: Very deep convolutional networks for large-scale image recognition (2014) arXiv:1409.1556 [cs.CV]
- He et al. [2015] He, K., Zhang, X., Ren, S., Sun, J.: Deep residual learning for image recognition (2015) arXiv:1512.03385 [cs.CV]
- Penzel et al. [2000] Penzel, T., Moody, G.B., Mark, R.G., Goldberger, A.L., Peter, J.H.: Apnea-ECG Database. physionet.org (2000)
- McNicholas et al. [2004] McNicholas, W., Doherty, L., Ryan, S., Garvey, J., Boyle, P., Chua, E.: St. Vincent’s university hospital / university college Dublin sleep apnea database. physionet.org (2004)
- Ichimaru and Moody [1992] Ichimaru, Y., Moody, G.B.: MIT-BIH Polysomnographic Database. physionet.org (1992)
- de Chazal et al. [2004] Chazal, P., Penzel, T., Heneghan, C.: Automated detection of obstructive sleep apnoea at different time scales using the electrocardiogram. Physiol. Meas. 25(4), 967–983 (2004)
- Hedenstierna [2000] Hedenstierna, G.: Causes of oxygenation impairment during anesthesia. In: Yearbook of Intensive Care and Emergency Medicine. Yearbook of Intensive Care and Emergency Medicine, pp. 343–351. Springer, Berlin, Heidelberg (2000)
- Sarkar et al. [2015] Sarkar, S., Bhattacherjee, S., Pal, S.: Extraction of respiration signal from ecg for respiratory rate estimation. In: Michael Faraday IET International Summit 2015, pp. 336–340 (2015). https://doi.org/10.1049/cp.2015.1654
- Varon et al. [2020] Varon, C., Morales, J., Lázaro, J., Orini, M., Deviaene, M., Kontaxis, S., Testelmans, D., Buyse, B., Borzée, P., Sörnmo, L., Laguna, P., Gil, E., Bailón, R.: A comparative study of ECG-derived respiration in ambulatory monitoring using the single-lead ECG. Sci. Rep. 10(1), 5704 (2020)
- Roebuck et al. [2014] Roebuck, A., Monasterio, V., Gederi, E., Osipov, M., Behar, J., Malhotra, A., Penzel, T., Clifford, G.D.: A review of signals used in sleep analysis. Physiol. Meas. 35(1), 1–57 (2014)
- Sandler et al. [2018] Sandler, M., Howard, A., Zhu, M., Zhmoginov, A., Chen, L.-C.: MobileNetV2: Inverted residuals and linear bottlenecks (2018) arXiv:1801.04381 [cs.CV]
- Novak et al. [2008] Novak, D., Mucha, K., Al-Ani, T.: Long short-term memory for apnea detection based on heart rate variability. 30th Annual International IEEE EMBS Conference Proceedings, 5234–5237 (2008)
- Pathinarupothi et al. [2017] Pathinarupothi, R.K., Rangan, E.S., Gopalakrishnan, E.A., Vinaykumar, R., Soman, K.P.: Single sensor techniques for sleep apnea diagnosis using deep learning. Proceedings of the IEEE International Conference on Healthcare Informatics (ICHI), 524–529 (2017) https://doi.org/10.1109/ICHI.2017.37
- Li et al. [2018] Li, K., Pan, W., Li, Y., Jiang, Q., Liu, G.: A method to detect sleep apnea based on deep neural network and hidden markov model using single-lead ecg signal. Neurocomputing 294, 94–101 (2018) https://doi.org/10.1016/j.neucom.2018.03.011
- Thompson et al. [2020] Thompson, S., Fergus, P., Chalmers, C., Reilly, D.: Detection of obstructive sleep apnoea using features extracted from segmented time-series ecg signals using a one dimensional convolutional neural network. arXiv preprint arXiv:2002.00833 (2020)
- Chen et al. [2022] Chen, J., Shen, M., Ma, W., Zheng, W.: A spatio-temporal learning-based model for sleep apnea detection using single-lead ecg signals. Frontiers in Neuroscience 16, 972581 (2022) https://doi.org/%****␣sleep-article_ph.bbl␣Line␣400␣****10.3389/fnins.2022.972581
- Liu and Pister [2024] Liu, D., Pister, K.: Llmeasyquant: A user-friendly toolkit for llm quantization. arXiv preprint arXiv:2406.19657 (2024)
- Liu et al. [2024] Liu, D., et al.: Graphsnapshot: Graph machine learning acceleration with fast storage and retrieval. arXiv preprint arXiv:2406.17918 (2024)
- Liu and Jiang [2024] Liu, D., Jiang, M.: Distance recomputator and topology reconstructor for graph neural networks. arXiv preprint arXiv:2406.17281 (2024)
- Howard et al. [2017] Howard, A.G., Zhu, M., Chen, B., Kalenichenko, D., Wang, W., Weyand, T., Andreetto, M., Adam, H.: Mobilenets: Efficient convolutional neural networks for mobile vision applications (2017)