MM-PCQA: Multi-Modal Learning for No-reference Point Cloud Quality Assessment
Abstract
The visual quality of point clouds has been greatly emphasized since the ever-increasing 3D vision applications are expected to provide cost-effective and high-quality experiences for users. Looking back on the development of point cloud quality assessment (PCQA), the visual quality is usually evaluated by utilizing single-modal information, i.e., either extracted from the 2D projections or 3D point cloud. The 2D projections contain rich texture and semantic information but are highly dependent on viewpoints, while the 3D point clouds are more sensitive to geometry distortions and invariant to viewpoints. Therefore, to leverage the advantages of both point cloud and projected image modalities, we propose a novel no-reference Multi-Modal Point Cloud Quality Assessment (MM-PCQA) metric. In specific, we split the point clouds into sub-models to represent local geometry distortions such as point shift and down-sampling. Then we render the point clouds into 2D image projections for texture feature extraction. To achieve the goals, the sub-models and projected images are encoded with point-based and image-based neural networks. Finally, symmetric cross-modal attention is employed to fuse multi-modal quality-aware information. Experimental results show that our approach outperforms all compared state-of-the-art methods and is far ahead of previous no-reference PCQA methods, which highlights the effectiveness of the proposed method. The code is available at https://github.com/zzc-1998/MM-PCQA.
1 Introduction
Point cloud has been widely adopted in practical applications such as virtual/augmented reality Park et al. (2008), automatic driving Cui et al. (2021), and video post-production Mekuria et al. (2016b) due to its ability of representing the 3D world. Consequently, plenty of works have been carried out to deal with point cloud classification Grilli et al. (2017); Ku et al. (2018); Wang and Jia (2019); Vora et al. (2020); Xie et al. (2020); Yoo et al. (2020); Chen et al. (2020), detection Cui et al. (2021), and segmentation Cheng et al. (2021); Liu et al. (2022b). However, point cloud quality assessment (PCQA) has gained less attention. PCQA aims to predict the visual quality level of point clouds, which is vital for providing useful guidelines for simplification operations and compression algorithms in applications such as metaverse and virtual/augmented reality (VR/AR) Fan et al. (2022a) to not negatively impact users’ quality of experience (QoE). Moreover, the point clouds representing vivid objects/humans are usually more complex in geometric structure and contain large amounts of dense points along with color attributes, which makes the PCQA problem very challenging.
Generally speaking, PCQA methods can be divided into full-reference PCQA (FR-PCQA), reduced-reference (RR-PCQA), and no-reference PCQA (NR-PCQA) methods according to the involvement extent of the reference point clouds. However, the pristine reference point clouds are not always available in many practical situations, thus NR-PCQA has a wider range of applications. Hence, we focus on the NR-PCQA in this paper. Reviewing the development of NR-PCQA, most metrics are either based on the point cloud features extracted by statistical models Zhang et al. (2021a, 2022c) and end-to-end neural networks Liu et al. (2022c) or based on the projected image features obtained via hand-crafted manners Meynet et al. (2020); Yang et al. (2020b); Alexiou and Ebrahimi (2020) or 2D convolutional neural networks (CNN) Liu et al. (2021b); Fan et al. (2022b); Zhang et al. (2022d). Such methods fail to jointly make use of the information from 3D point clouds along with 2D projections, thus resulting in unsatisfactory performance.
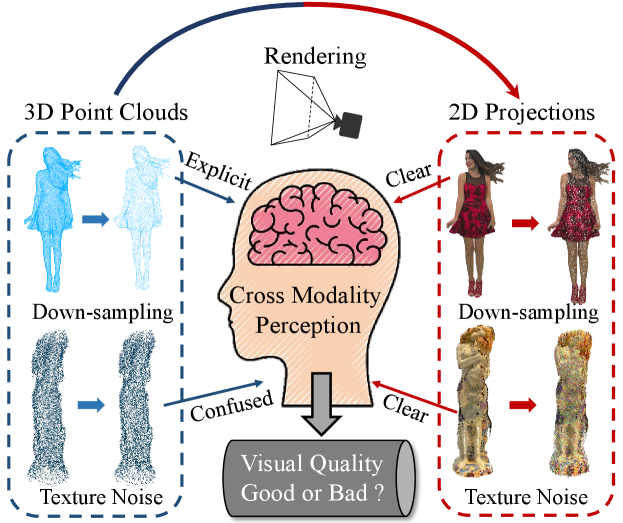
Therefore, to boost the performance of PCQA, we propose a multi-modal learning strategy for NR-PCQA, which extracts quality-aware features not only from the 3D point clouds but also from the 2D projections. There are two main reasons to adopt this strategy. First, point clouds can be perceived in both 2D/3D scenarios. We can view point clouds from 2D perspective via projecting them on the screen or directly watch point clouds in 3D format using the VR equipment. Thus multi-modal learning is able to cover more range of practical situations. Second, different types of distortions have divergent visual influence on different modalities. As shown in Fig. 1, the structural damage and geometry down-sampling are more obvious in the point cloud modality while the image modality is more sensitive to texture distortions caused by color quantization and color noise. Moreover, it is easier to extract quality-aware semantic information from the image modality. Thus, the proposed multi-modal learning fashion can make up for the deficiencies and take advantage of both modalities. Further, considering that the local patterns such as smoothness and roughness are very important for quality assessment, we first propose to split the point cloud into sub-models rather than sampling points for analysis, which has been previously adopted for extracting the low-level pattern features of the point cloud Chetouani et al. (2021); You and Gao (2021). The image projections are acquired by rendering the point clouds from several viewpoints with a fixed viewing distance to maintain the consistency of the texture scale. Then a point cloud encoder and an image encoder are used to encode the point clouds and projected images into quality-aware embeddings respectively, which are subsequently strengthened by symmetric cross-modality attention. Finally, the quality-aware embeddings are decoded into quality values with fully-connected layers. The main contributions of this paper are summarized as follows:
-
•
We propose a no-reference Multi-Modal Point Cloud Quality Assessment (MM-PCQA) to interactively use the information from both the point cloud and image modalities. To the best of our knowledge, we are the first to introduce multi-modal learning into the PCQA field.
-
•
To preserve the local patterns that are vital for visual quality, we propose to split the point cloud into sub-models rather than sampling points as the input of the point cloud encoder. To better incorporate the multi-modal features, we employ cross-modal attention to model the mutual relationship between the quality-aware features extracted from two modalities.
-
•
Extensive experiments show that MM-PCQA achieves the best performance among the compared state-of-the-art methods (even including the FR-PCQA methods). The ablation studies reveal the contributions of different modalities, the patch-up strategy, and cross-modal attention, demonstrating the effectiveness of the proposed framework.
2 Related Work
2.1 Quality Assessment for Point Cloud
In the early years of PCQA development, some simple point-based FR-PCQA methods are proposed by MPEG, such as p2point Mekuria et al. (2016a) and p2plane Tian et al. (2017). To further deal with colored point clouds, point-based PSNR-yuv Torlig et al. (2018) is carried out. Since the point-level difference is difficult to reflect complex distortions, many well-designed FR-PCQA metrics are proposed to employ structural features and have achieved considerable performance, which includes PCQM Meynet et al. (2020), GraphSIM Yang et al. (2020b), PointSSIM Alexiou and Ebrahimi (2020), etc.
To cover more range of practical applications and inspired by NR image quality assessment Zhang and Liu (2022); Zhang et al. (2022a, 2021b), some NR-PCQA methods have been proposed as well. Chetouani Chetouani et al. (2021) extract patch-wise hand-crafted features and use classical CNN models for quality regression. PQA-net Liu et al. (2021b) utilizes multi-view projection for feature extraction. Zhang Zhang et al. (2022c) use several statistical distributions to estimate quality-aware parameters from the geometry and color attributes’ distributions. Fan Fan et al. (2022b) infer the visual quality of point clouds via the captured video sequences. Liu Liu et al. (2022c) employ an end-to-end sparse CNN for quality prediction. Yang Yang et al. (2022) further transfer the quality information from natural images to help understand the point cloud rendering images’ quality via domain adaptation. The mentioned methods are all based on single-modal information, thus failing to jointly incorporate the multi-modal quality information.
2.2 Multi-modal Learning for Point Cloud
Many works Radford et al. (2021); Cheng et al. (2020) have proven that multi-modal learning is capable of strengthening feature representation by actively relating the compositional information across different modalities such as image, text, and audio. Afterwards, various works utilize both point clouds and image data to improve the understanding of 3D vision, which are mostly targeted at 3D detection. Namely, AVOD Ku et al. (2018) and MV3D Chen et al. (2020) make region proposals by mapping the LiDAR point clouds to bird’s eye view. Then Qi Qi et al. (2018) and Wang Wang and Jia (2019) attempt to localize the points by proposing 2D regions with 2D CNN object detector and then transforming the corresponding 2D pixels to 3D space. Pointpainting Vora et al. (2020) projects the points into the image segmentation mask and detects 3D objects via LiDAR-based detector. Similarly, PI-RCNN Xie et al. (2020) employs semantic feature maps and makes predictions through point-wise fusion. 3D-CVF Yoo et al. (2020) transfers the camera-view features using auto-calibrated projection and fuses the multi-modal features with gated fusion networks. More recently, some works Afham et al. (2022); Zhang et al. (2022b) try to make use of multi-modal information in a self-supervised manner and transfer the learned representation to the downstream tasks.

3 Proposed Method
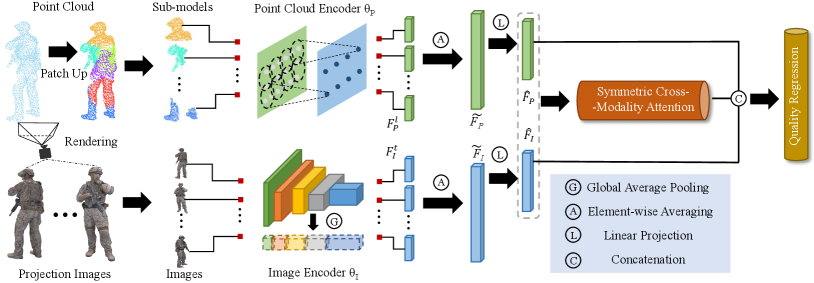
The framework overview is clearly exhibited in Fig. 2. The point clouds are first segmented into sub-models and put into the point cloud encoder . The projected images are directly rendered from the colored point clouds and put into the image encoder . Subsequently, the quality-aware encoder features are optimized with the assistance of symmetric cross-modality attention. Finally, the features are concatenated and decoded into the quality values via the quality regression.
3.1 Preliminaries
Suppose we have a colored point cloud , where indicates the geometry coordinates, represents the attached RGB color information, and stands for the number of points. The point cloud modality is obtained by normalizing the original geometry coordinates and the image modality is generated by rendering the colored point cloud into 2D projections. Note that contains no color information.
3.2 Point Cloud Feature Extraction
It is natural to transfer mainstream 3D object detectors such as PointNet++ Qi et al. (2017) and DGCNN Wang et al. (2019) to visual quality representation of point clouds. However, different from the point clouds used for classification and segmentation, the high-quality point clouds usually contain large numbers of dense points, which makes it difficult to extract features directly from the source points unless utilizing down-sampling. Nevertheless, the common sampling methods are aimed at preserving semantic information whereas inevitably damaging the geometry patterns that are crucial for quality assessment. To avoid the geometry error caused by the down-sampling and preserve the smoothness and roughness of local patterns, we propose to gather several local sub-models from the point cloud for geometric structure feature representation.
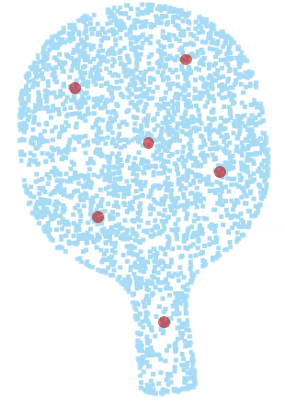
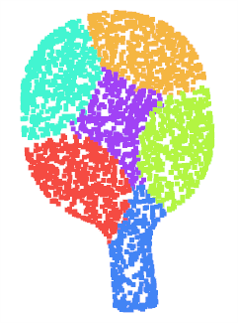
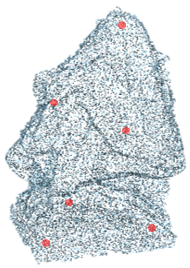
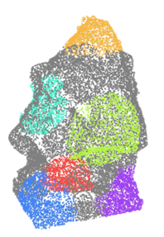
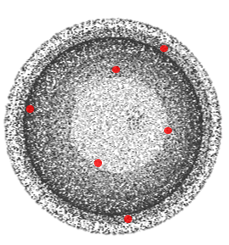
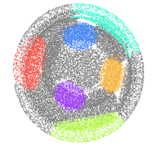
Specifically, given a normalized point cloud , we employ the farthest point sampling (FPS) to obtain anchor points . For each anchor point, we utilize K nearest neighbor (KNN) algorithm to find neighboring points around the anchor point and form such points into a sub-model:
| (1) |
where is the set of sub-models, denotes the KNN operation and indicates the -th farthest sampling point. An illustration of the patch-up process is exhibited in Fig. 3. It can be seen that the local sub-models are capable to preserve the local patterns. Then a point cloud feature encoder is employed to map the obtained sub-models to quality-aware embedding space:
| (2) | ||||
where indicates the quality-aware embedding for the -th sub-model , represents the number of output channels of the point cloud encoder , and is the pooled results after average fusion.
3.3 Image Feature Extraction
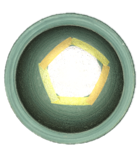
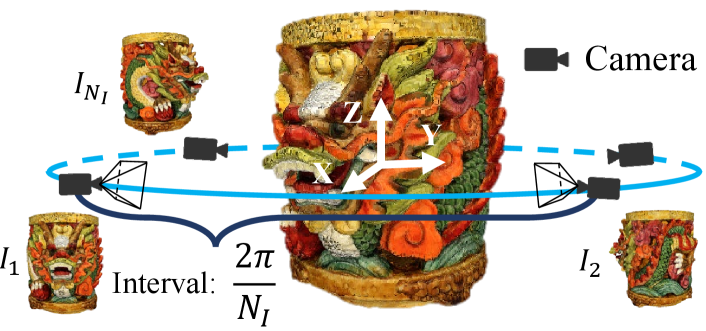
image projections are rendered from the distorted colored point clouds from a defined circular pathway with a fixed viewing distance to keep the texture consistent as shown in Fig. 4:
| (3) |
where the pathway is centered on the point cloud’s geometry center, indicates the fixed viewing distance and the image projections are captured with intervals of . The projections are rendered with the assistance of Open3D Zhou et al. (2018). Then we embed the rendered 2D images into quality-aware space with the 2D image encoder:
| (4) | ||||
where denotes the quality-aware embedding for the -th image projection , represents the number of output channels of the 2D image encoder , and is the pooled results after average fusion.
3.4 Symmetric Cross-Modality Attention
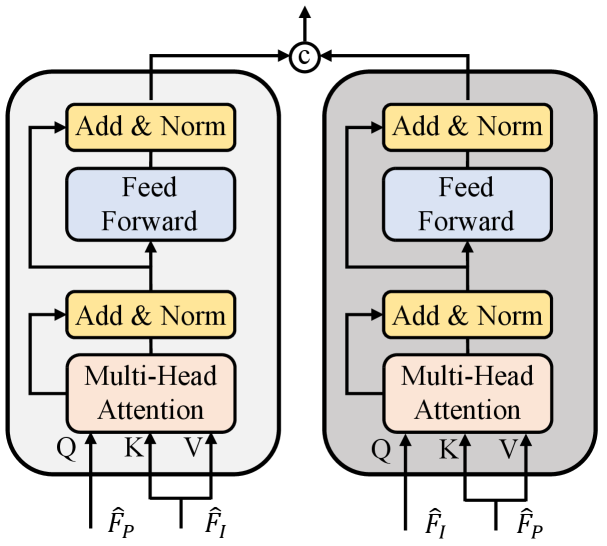
As shown in Fig 1, the single modality may be incomplete to cover sufficient information for quality assessment, thus we propose a symmetric attention transformer block to investigate the interaction between the visual quality features gathered from the point cloud and image modalities. Given the intra-modal features and from the point clouds and images respectively, we adjust them to the same dimension with linear projection:
| (5) |
where and are adjusted features, and are learnable linear mappings, and is the number of adjusted channels. To further explore the discriminate components among the modalities, the multi-head attention module is utilized:
| (6) | ||||
where indicates the multi-head attention operation, represents the attention function, is the -th head, and , , , are learnable linear mappings. As illustrated in Fig. 5, both point-cloud-based and image-based quality-aware features participate in the attention learning of the other modality. The final quality embedding can be concatenated by the intra-modal features and the guided multi-modal features obtained by the symmetric cross-modality attention module:
| (7) |
where indicates the concatenation operation, stands for the symmetric cross-modality attention operation, and represents the final quality-aware features (, ).
3.5 Quality Regression & Loss Function
Following common practice, we simply use two-fold fully-connected layers to regress the quality features into predicted quality scores. For the quality assessment tasks, we not only focus on the accuracy of the predicted quality values but also lay importance on the quality rankings. Therefore, the loss function employed in this paper includes two parts: Mean Squared Error (MSE) and rank error. The MSE is utilized to keep the predicted values close to the quality labels, which can be derived as:
| (8) |
where is the predicted quality scores, is the quality labels of the point cloud, and is the size of the mini-batch. The rank loss can better assist the model to distinguish the quality difference when the point clouds have close quality labels. To this end, we use the differentiable rank function described in Sun et al. (2022) to approximate the rank loss:
| (9) | ||||
where and are the corresponding indexes for two point clouds in a mini-batch and the rank loss can be derived as:
| (10) |
Then the loss function can be calculated as the weighted sum of MSE loss and rank loss:
| (11) |
where and are used to control the proportion of the MSE loss and the rank loss.
4 Experiments
| Type | Modal | Methods | SJTU-PCQA | WPC | WPC2.0 | |||||||||
|---|---|---|---|---|---|---|---|---|---|---|---|---|---|---|
| SRCC | PLCC | KRCC | RMSE | SRCC | PLCC | KRCC | RMSE | SRCC | PLCC | KRCC | RMSE | |||
| FR | P | MSE-p2po | 0.7294 | 0.8123 | 0.5617 | 1.3613 | 0.4558 | 0.4852 | 0.3182 | 19.8943 | 0.4315 | 0.4626 | 0.3082 | 19.1605 |
| P | HD-p2po | 0.7157 | 0.7753 | 0.5447 | 1.4475 | 0.2786 | 0.3972 | 0.1943 | 20.8990 | 0.3587 | 0.4561 | 0.2641 | 18.8976 | |
| P | MSE-p2pl | 0.6277 | 0.5940 | 0.4825 | 2.2815 | 0.3281 | 0.2695 | 0.2249 | 22.8226 | 0.4136 | 0.4104 | 0.2965 | 21.0400 | |
| P | HD-p2pl | 0.6441 | 0.6874 | 0.4565 | 2.1255 | 0.2827 | 0.2753 | 0.1696 | 21.9893 | 0.4074 | 0.4402 | 0.3174 | 19.5154 | |
| P | PSNR-yuv | 0.7950 | 0.8170 | 0.6196 | 1.3151 | 0.4493 | 0.5304 | 0.3198 | 19.3119 | 0.3732 | 0.3557 | 0.2277 | 20.1465 | |
| P | PCQM | 0.8644 | 0.8853 | 0.7086 | 1.0862 | 0.7434 | 0.7499 | 0.5601 | 15.1639 | 0.6825 | 0.6923 | 0.4929 | 15.6314 | |
| P | GraphSIM | 0.8783 | 0.8449 | 0.6947 | 1.0321 | 0.5831 | 0.6163 | 0.4194 | 17.1939 | 0.7405 | 0.7512 | 0.5533 | 14.9922 | |
| P | PointSSIM | 0.6867 | 0.7136 | 0.4964 | 1.7001 | 0.4542 | 0.4667 | 0.3278 | 20.2733 | 0.4810 | 0.4705 | 0.2978 | 19.3917 | |
| \hdashlineNR | I | BRISQUE | 0.3975 | 0.4214 | 0.2966 | 2.0937 | 0.2614 | 0.3155 | 0.2088 | 21.1736 | 0.0820 | 0.3353 | 0.0487 | 21.6679 |
| I | NIQE | 0.1379 | 0.2420 | 0.1009 | 2.2622 | 0.1136 | 0.2225 | 0.0953 | 23.1415 | 0.1865 | 0.2925 | 0.1335 | 22.5146 | |
| I | IL-NIQE | 0.0837 | 0.1603 | 0.0594 | 2.3378 | 0.0913 | 0.1422 | 0.0853 | 24.0133 | 0.0911 | 0.1233 | 0.0714 | 23.9987 | |
| P | ResSCNN | 0.8600 | 0.8100 | - | - | - | - | - | - | 0.7500 | 0.7200 | - | - | |
| I | PQA-net | 0.8372 | 0.8586 | 0.6304 | 1.0719 | 0.7026 | 0.7122 | 0.4939 | 15.0812 | 0.6191 | 0.6426 | 0.4606 | 16.9756 | |
| P | 3D-NSS | 0.7144 | 0.7382 | 0.5174 | 1.7686 | 0.6479 | 0.6514 | 0.4417 | 16.5716 | 0.5077 | 0.5699 | 0.3638 | 17.7219 | |
| P+I | MM-PCQA | 0.9103 | 0.9226 | 0.7838 | 0.7716 | 0.8414 | 0.8556 | 0.6513 | 12.3506 | 0.8023 | 0.8024 | 0.6202 | 13.4289 | |
4.1 Databases
To test the performance of the proposed method, we employ the subjective point cloud assessment database (SJTU-PCQA) Yang et al. (2020a), the Waterloo point cloud assessment database (WPC) proposed by Liu et al. (2022a), and the WPC2.0 database Liu et al. (2021a) for validation. The SJTU-PCQA database includes 9 reference point clouds and each point cloud is corrupted with seven types of distortions (compression, color noise, geometric shift, down-sampling, and three distortion combinations) under six strengths, which generates 378 = 976 distorted point clouds in total. The WPC database contains 20 reference point clouds and augments each point cloud with four types of distortions (down-sampling, Gaussian white noise, Geometry-based Point Cloud Compression (G-PCC), and Video-based Point Cloud Compression (V-PCC)), which generates 740 = 2037 distorted point clouds. The WPC2.0 databases provides 16 reference point clouds and degradaes the point clouds with 25 V-PCC settings, which generates 400 = 1625 distorted point clouds.
4.2 Implementation Details
The Adam optimizer Kingma and Ba (2015) is utilized with weight decay 1e-4, the initial learning rate is set as 5e-5, and the batch size is set as 8. The model is trained for 50 epochs by default. Specifically, We set the point cloud sub-model size as 2048, set the number of sub-models , and set the number of image projections . The projected images with the resolution of 192010803 are randomly cropped into image patches at the resolution of 2242243 as the inputs (the white background is removed from the projected images). The PointNet++ Qi et al. (2017) is utilized as the point cloud encoder and the ResNet50 He et al. (2016) is used as the image encoder, where the ResNet50 is initialized with the pre-trained model on the ImageNet database Deng et al. (2009). The multi-head attention module employs 8 heads and the feed-forward dimension is set as 2048. The weights and for and are both set as 1.
Following the practices in Fan et al. (2022b), the k-fold cross validation strategy is employed for the experiment to accurately estimate the performance of the proposed method. Since the SJTU-PCQA, WPC, and WPC2.0 contain 9, 20, 16 groups of point clouds respectively, 9-fold, 5-fold, and 4-fold cross validation is selected for the three database to keep the train-test ratio around 8:2. The average performance is recorded as the final results. It’s worth noting that there is no content overlap between the training and testing sets. We strictly retrain the available baselines with the same database split set up to keep the comparison fair. What’s more, for the FR-PCQA methods that require no training, we simply validate them on the same testing sets and record the average performance.
4.3 Competitors and Evaluation Criteria
14 state-of-the-art quality assessment methods are selected for comparison, which consist of 8 FR-PCQA methods and 6 NR-PCQA methods. The FR-PCQA methods include MSE-p2point (MSE-p2po) Mekuria et al. (2016a), Hausdorff-p2point (HD-p2po) Mekuria et al. (2016a), MSE-p2plane (MSE-p2pl) Tian et al. (2017), Hausdorff-p2plane (HD-p2pl) Tian et al. (2017), PSNR-yuv Torlig et al. (2018), PCQM Meynet et al. (2020), GraphSIM Yang et al. (2020b), and PointSSIM Alexiou and Ebrahimi (2020). The NR-PCQA methods include BRISQUE Mittal et al. (2012a), NIQE Mittal et al. (2012b), IL-NIQE Zhang et al. (2015), ResSCNN Liu et al. (2022c), PQA-net Liu et al. (2021b), and 3D-NSS Zhang et al. (2022c). Note that BRISQUE, NIQE, IL-NIQE are image-based quality assessment metrics and are validated on the same projected images. Furthermore, to deal with the scale differences between the predicted quality scores and the quality labels, a five-parameter logistic function is applied to map the predicted scores to subjective ratings, as suggested by Antkowiak et al. (2000).
Four mainstream evaluation criteria in the quality assessment field are utilized to compare the correlation between the predicted scores and MOSs, which include Spearman Rank Correlation Coefficient (SRCC), Kendall’s Rank Correlation Coefficient (KRCC), Pearson Linear Correlation Coefficient (PLCC), Root Mean Squared Error (RMSE). An excellent quality assessment model should obtain values of SRCC, KRCC, PLCC close to 1 and RMSE to 0.
| Modal | SJTU-PCQA | WPC | WPC2.0 | |||
|---|---|---|---|---|---|---|
| SRCC | PLCC | SRCC | PLCC | SRCC | PLCC | |
| P | 0.8460 | 0.8949 | 0.5234 | 0.5552 | 0.5228 | 0.4682 |
| I | 0.8741 | 0.8887 | 0.7845 | 0.8084 | 0.7631 | 0.7482 |
| P+I | 0.8786 | 0.8951 | 0.8017 | 0.8137 | 0.7731 | 0.7782 |
| P+I+SCMA | 0.9103 | 0.9226 | 0.8414 | 0.8556 | 0.8023 | 0.8024 |
4.3.1 Performance Discussion
The experimental results are listed in Table 1, from which we can make several useful inspections: a) Our method MM-PCQA presents the best performance among all 3 databases and outperforms the compared NR-PCQA methods by a large margin. For example, MM-PCQA surpasses the second place NR-PCQA method by about 0.05 (0.91 vs. 0.86 (ResSCNN)) on the SJTU-PCQA database, by 0.14 (0.84 vs. 0.70 (PQA-net)) on the WPC database, and by 0.05 (0.80 vs. 0.75 (ResSCNN )) on the WPC2.0 database in terms of SRCC. This is because MM-PCQA enforces the model to relate the compositional quality-aware patterns and mobilize under-complementary information between the image and point cloud modalities to optimize the quality representation by jointly utilizing intra-modal and cross-modal features; b) There are significant performance drops from the SJTU-PCQA database to the WPC and WPC2.0 databases since the WPC and WPC2.0 databases contain more complex distortion settings, which are more challenging for PCQA models. MM-PCQA achieves a relatively smaller performance drop than most compared methods. For example, the SRCC and PLCC values of MM-PCQA drop by 0.07 and 0.08 respectively from the SJTU-PCQA database to the WPC database. However, the top-performing PCQA methods except 3D-NSS experience a larger performance drop over 0.1 on both SRCC and PLCC values. Therefore, we can conclude that MM-PCQA gains more robustness over more complex distortions; c) The image-based handcrafted NR methods BRISQUE, NIQE, and IL-NIQE obtain the poorest performance. This is because such methods are carried out for evaluating the natural scene images, which have a huge gap from the projected images rendered from the point clouds. In all, the overall experimental performance firmly validates our motivation that multi-modal learning can help the model better understand the visual quality of point clouds.
4.4 Contributions of the Modalities
As described above, MM-PCQA jointly employs the features from the point cloud and image modalities and we hold the hypothesis that multi-modal learning helps the model to gain better quality representation than single-modality. Therefore, in this section, we conduct ablation studies to validate our hypothesis. The performance results are presented in Table 2. The performance of both single-modal-based model is inferior to the multi-modal-based model, which suggests that both point cloud and image features make contributions to the final results. After using SCMA module, the performance is further boosted, which validates the effectiveness of cross-modality attention.
| Model | SJTU-PCQA | WPC | WPC2.0 | |||
|---|---|---|---|---|---|---|
| SRCC | PLCC | SRCC | PLCC | SRCC | PLCC | |
| P+FPS | 0.3385 | 0.3499 | 0.1226 | 0.1584 | 0.2055 | 0.2744 |
| P+Patch-up | 0.8460 | 0.8949 | 0.5234 | 0.5552 | 0.5228 | 0.4682 |
| P+I+FPS | 0.8512 | 0.8901 | 0.7911 | 0.8122 | 0.7612 | 0.7744 |
| P+I+Patch-up | 0.9103 | 0.9226 | 0.8414 | 0.8556 | 0.8023 | 0.8024 |
| Model | WPCSJTU | WPCWPC2.0 | ||
|---|---|---|---|---|
| SRCC | PLCC | SRCC | PLCC | |
| PQA-net | 0.5411 | 0.6102 | 0.6006 | 0.6377 |
| 3D-NSS | 0.1817 | 0.2344 | 0.4933 | 0.5613 |
| MM-PCQA | 0.7693 | 0.7779 | 0.7607 | 0.7753 |
| Type | Num | SJTU-PCQA | WPC | WPC2.0 | |||
|---|---|---|---|---|---|---|---|
| SRCC | PLCC | SRCC | PLCC | SRCC | PLCC | ||
| sub-models | 2 | 0.7421 | 0.7824 | 0.4627 | 0.5238 | 0.3446 | 0.4011 |
| 4 | 0.7317 | 0.8214 | 0.4515 | 0.4956 | 0.4270 | 0.4532 | |
| 6 | 0.8460 | 0.8949 | 0.5234 | 0.5552 | 0.5228 | 0.4682 | |
| 8 | 0.8247 | 0.8955 | 0.5024 | 0.5420 | 0.4931 | 0.5232 | |
| \hdashlineproj-ections | 2 | 0.8448 | 0.8472 | 0.7417 | 0.7371 | 0.7446 | 0.7587 |
| 4 | 0.8741 | 0.8887 | 0.7845 | 0.8084 | 0.7631 | 0.7482 | |
| 6 | 0.8601 | 0.8754 | 0.7811 | 0.7976 | 0.7601 | 0.7723 | |
| 8 | 0.8612 | 0.8577 | 0.7542 | 0.7622 | 0.7521 | 0.7517 | |
| P | I | SJTU-PCQA | WPC | WPC2.0 | |||
|---|---|---|---|---|---|---|---|
| SRCC | PLCC | SRCC | PLCC | SRCC | PLCC | ||
| DGC | R50 | 0.8734 | 0.8999 | 0.8226 | 0.7984 | 0.7822 | 0.7807 |
| P++ | R50 | 0.9103 | 0.9226 | 0.8414 | 0.8556 | 0.8023 | 0.8024 |
| P++ | VGG16 | 0.8651 | 0.8669 | 0.7919 | 0.8026 | 0.7744 | 0.7811 |
| P++ | MNV2 | 0.8513 | 0.8721 | 0.8014 | 0.8006 | 0.7614 | 0.7780 |
4.5 Ablation for the Patch-up Strategy
To prove that the patch-up strategy is more suitable for PCQA, we present the performance of using farthest point sampling (FPS) strategy as well. To make the comparison even, 12,288 = 62048 points (the same number of points as contained in the default 6 sub-models) are sampled for each point cloud and the results are shown in Table 3. It can be seen that the patch-up strategy greatly improves the performance when only point cloud features are used. The reason is that the sampled points are not able to preserve the local patterns that are vital for quality assessment. Moreover, when the point cloud contains more points, the sampled points may not even maintain the main shape of the object unless greatly increasing the number of sampling points.
4.6 Cross-database Evaluation
The cross-database evaluation is further conducted to test the generalization ability of the proposed MM-PCQA and the experimental results are exhibited in Table 4. Since the WPC database is the largest in scale (740), we mainly train the models on the WPC database and conduct the validation on the SJTU-PCQA (378) and WPC2.0 (400) databases. From the table, we can find that the proposed MM-PCQA better generalizes learned feature representation from the WPC database and achieves much better performance than the most competitive NR-PCQA methods. Furthermore, the WPCWPC2.0 MM-PCQA is even superior to all the competitors directly trained on the WPC2.0 database.
4.7 Number of 2D Projections and 3D sub-models
We try to investigate the contributions of the point cloud and image branch by varying the number of the 3D sub-models and input 2D projections. The performance results are exhibited in Table 5. We can see that employing 6 sub-models and 4 projections yields the best performance on major aspects for the point cloud and image branch respectively. With the number increasing, the features extracted from sub-models and projections may get redundant, thus resulting in the performance drop.
4.8 Different Feature Encoders
In this section, we present the performance of different feature encoders. The popular 2D image backbones VGG16 Simonyan and Zisserman (2014), MobileNetV2 Sandler et al. (2018) and ResNet50 He et al. (2016) are used for demonstration while the mainstream point cloud backbones PointNet++ Qi et al. (2017) and DGCNN Wang et al. (2019) are also included. The results are shown in Table 6. It can be found that the proposed PointNet++ and ResNet50 combination is superior to other encoder combinations. Additionally, the performance of different backbones are still competitive compared with other NR-PCQA methods, which further confirms the effectiveness of the proposed framework.
5 Conclusion
This paper proposes a novel multi-modal learning approach for no-reference point cloud quality assessment (MM-PCQA). MM-PCQA aims to acquire quality information across modalities and optimize the quality representation. In particular, the point clouds are patched up to preserve the important local geometric structure patterns. Then the projected images are employed to reflect the texture distortions. PointNet++ and ResNet50 are utilized as the feature encoders. Symmetric cross-modal attention is further employed to make full use of the cross-modal information. Experimental results show that MM-PCQA reaches a new state-of-the-art on the SJTU-PCQA, WPC and WPC2.0 databases. Extensive ablation studies further demonstrate the potency of the proposed multi-modal learning framework.
5.0.1 Acknowledgements
This work was supported in part by NSFC (No.62225112, No.61831015), the Fundamental Research Funds for the Central Universities, National Key R&D Program of China 2021YFE0206700, and Shanghai Municipal Science and Technology Major Project (2021SHZDZX0102).
References
- Afham et al. [2022] Mohamed Afham, Isuru Dissanayake, Dinithi Dissanayake, Amaya Dharmasiri, Kanchana Thilakarathna, and Ranga Rodrigo. Crosspoint: Self-supervised cross-modal contrastive learning for 3d point cloud understanding. In IEEE/CVF CVPR, pages 9902–9912, 2022.
- Alexiou and Ebrahimi [2020] Evangelos Alexiou and Touradj Ebrahimi. Towards a point cloud structural similarity metric. In ICMEW, pages 1–6, 2020.
- Antkowiak et al. [2000] Jochen Antkowiak, TDF Jamal Baina, France Vittorio Baroncini, Noel Chateau, France FranceTelecom, Antonio Claudio França Pessoa, FUB Stephanie Colonnese, Italy Laura Contin, Jorge Caviedes, and France Philips. Final report from the video quality experts group on the validation of objective models of video quality assessment march 2000. 2000.
- Chen et al. [2020] Qi Chen, Lin Sun, Zhixin Wang, Kui Jia, and Alan Yuille. Object as hotspots: An anchor-free 3d object detection approach via firing of hotspots. In ECCV, pages 68–84, 2020.
- Cheng et al. [2020] Ying Cheng, Ruize Wang, Zhihao Pan, Rui Feng, and Yuejie Zhang. Look, listen, and attend: Co-attention network for self-supervised audio-visual representation learning. In ACM MM, pages 3884–3892, 2020.
- Cheng et al. [2021] Mingmei Cheng, Le Hui, Jin Xie, and Jian Yang. Sspc-net: Semi-supervised semantic 3d point cloud segmentation network. In AAAI, volume 35, pages 1140–1147, 2021.
- Chetouani et al. [2021] Aladine Chetouani, Maurice Quach, Giuseppe Valenzise, and Frédéric Dufaux. Deep learning-based quality assessment of 3d point clouds without reference. In ICMEW, pages 1–6, 2021.
- Cui et al. [2021] Yaodong Cui, Ren Chen, Wenbo Chu, Long Chen, Daxin Tian, Ying Li, and Dongpu Cao. Deep learning for image and point cloud fusion in autonomous driving: A review. IEEE TITS, 23(2):722–739, 2021.
- Deng et al. [2009] Jia Deng, Wei Dong, Richard Socher, Li-Jia Li, Kai Li, and Li Fei-Fei. Imagenet: A large-scale hierarchical image database. In IEEE/CVF CVPR, pages 248–255, 2009.
- Fan et al. [2022a] Tingyu Fan, Linyao Gao, Yiling Xu, Zhu Li, and Dong Wang. D-dpcc: Deep dynamic point cloud compression via 3d motion prediction. IJCAI, 2022.
- Fan et al. [2022b] Yu Fan, Zicheng Zhang, Wei Sun, Xiongkuo Min, Ning Liu, Quan Zhou, Jun He, Qiyuan Wang, and Guangtao Zhai. A no-reference quality assessment metric for point cloud based on captured video sequences. In IEEE MMSP, pages 1–5. IEEE, 2022.
- Grilli et al. [2017] Eleonora Grilli, Fabio Menna, and Fabio Remondino. A review of point clouds segmentation and classification algorithms. The International Archives of Photogrammetry, Remote Sensing and Spatial Information Sciences, 42:339, 2017.
- He et al. [2016] Kaiming He, Xiangyu Zhang, Shaoqing Ren, and Jian Sun. Deep residual learning for image recognition. In IEEE/CVF CVPR, pages 770–778, 2016.
- Kingma and Ba [2015] Diederik P Kingma and Jimmy Ba. Adam: A method for stochastic optimization. In ICLR, 2015.
- Ku et al. [2018] Jason Ku, Melissa Mozifian, Jungwook Lee, Ali Harakeh, and Steven L Waslander. Joint 3d proposal generation and object detection from view aggregation. In IEEE/RSJ IROS, pages 1–8, 2018.
- Liu et al. [2021a] Qi Liu, Hui Yuan, Raouf Hamzaoui, Honglei Su, Junhui Hou, and Huan Yang. Reduced reference perceptual quality model with application to rate control for video-based point cloud compression. IEEE TIP, 30:6623–6636, 2021.
- Liu et al. [2021b] Qi Liu, Hui Yuan, Honglei Su, Hao Liu, Yu Wang, Huan Yang, and Junhui Hou. Pqa-net: Deep no reference point cloud quality assessment via multi-view projection. IEEE TCSVT, 31(12):4645–4660, 2021.
- Liu et al. [2022a] Qi Liu, Honglei Su, Zhengfang Duanmu, Wentao Liu, and Zhou Wang. Perceptual quality assessment of colored 3d point clouds. IEEE TVCG, 2022.
- Liu et al. [2022b] Weiquan Liu, Hanyun Guo, Weini Zhang, Yu Zang, Cheng Wang, and Jonathan Li. Toposeg: Topology-aware segmentation for point clouds. IJCAI, 2022.
- Liu et al. [2022c] Yipeng Liu, Qi Yang, Yiling Xu, and Le Yang. Point cloud quality assessment: Dataset construction and learning-based no-reference metric. ACM TOMM, 2022.
- Mekuria et al. [2016a] R Mekuria, Z Li, C Tulvan, and P Chou. Evaluation criteria for point cloud compression. ISO/IEC MPEG, (16332), 2016.
- Mekuria et al. [2016b] Rufael Mekuria, Kees Blom, and Pablo Cesar. Design, implementation, and evaluation of a point cloud codec for tele-immersive video. IEEE TCSVT, 27(4):828–842, 2016.
- Meynet et al. [2020] Gabriel Meynet, Yana Nehmé, Julie Digne, and Guillaume Lavoué. Pcqm: A full-reference quality metric for colored 3d point clouds. In QoMEX, pages 1–6, 2020.
- Mittal et al. [2012a] Anish Mittal, Anush Krishna Moorthy, and Alan Conrad Bovik. No-reference image quality assessment in the spatial domain. IEEE TIP, 21(12):4695–4708, 2012.
- Mittal et al. [2012b] Anish Mittal, Rajiv Soundararajan, and Alan C Bovik. Making a “completely blind” image quality analyzer. IEEE Signal Processing Letters, 20(3):209–212, 2012.
- Park et al. [2008] Youngmin Park, Vincent Lepetit, and Woontack Woo. Multiple 3d object tracking for augmented reality. In IEEE/ACM International Symposium on Mixed and Augmented Reality, pages 117–120, 2008.
- Qi et al. [2017] Charles Ruizhongtai Qi, Li Yi, Hao Su, and Leonidas J Guibas. Pointnet++: Deep hierarchical feature learning on point sets in a metric space. NIPS, 30, 2017.
- Qi et al. [2018] Charles R Qi, Wei Liu, Chenxia Wu, Hao Su, and Leonidas J Guibas. Frustum pointnets for 3d object detection from rgb-d data. In IEEE/CVF CVPR, pages 918–927, 2018.
- Radford et al. [2021] Alec Radford, Jong Wook Kim, Chris Hallacy, Aditya Ramesh, Gabriel Goh, Sandhini Agarwal, Girish Sastry, Amanda Askell, Pamela Mishkin, Jack Clark, et al. Learning transferable visual models from natural language supervision. In ICLR, pages 8748–8763, 2021.
- Sandler et al. [2018] Mark Sandler, Andrew Howard, Menglong Zhu, Andrey Zhmoginov, and Liang-Chieh Chen. Mobilenetv2: Inverted residuals and linear bottlenecks. In IEEE/CVF CVPR, pages 4510–4520, 2018.
- Simonyan and Zisserman [2014] Karen Simonyan and Andrew Zisserman. Very deep convolutional networks for large-scale image recognition. arXiv preprint arXiv:1409.1556, 2014.
- Sun et al. [2022] Wei Sun, Xiongkuo Min, Wei Lu, and Guangtao Zhai. A deep learning based no-reference quality assessment model for ugc videos. In ACM MM, pages 856–865, 2022.
- Tian et al. [2017] Dong Tian, Hideaki Ochimizu, Chen Feng, Robert Cohen, and Anthony Vetro. Geometric distortion metrics for point cloud compression. In IEEE ICIP, pages 3460–3464, 2017.
- Torlig et al. [2018] Eric M Torlig, Evangelos Alexiou, Tiago A Fonseca, Ricardo L de Queiroz, and Touradj Ebrahimi. A novel methodology for quality assessment of voxelized point clouds. In Applications of Digital Image Processing XLI, volume 10752, pages 174–190, 2018.
- Vora et al. [2020] Sourabh Vora, Alex H Lang, Bassam Helou, and Oscar Beijbom. Pointpainting: Sequential fusion for 3d object detection. In IEEE/CVF CVPR, pages 4604–4612, 2020.
- Wang and Jia [2019] Zhixin Wang and Kui Jia. Frustum convnet: Sliding frustums to aggregate local point-wise features for amodal 3d object detection. In IEEE/RSJ IROS, pages 1742–1749, 2019.
- Wang et al. [2019] Yue Wang, Yongbin Sun, Ziwei Liu, Sanjay E Sarma, Michael M Bronstein, and Justin M Solomon. Dynamic graph cnn for learning on point clouds. ACM TOG, 38(5):1–12, 2019.
- Xie et al. [2020] Liang Xie, Chao Xiang, Zhengxu Yu, Guodong Xu, Zheng Yang, Deng Cai, and Xiaofei He. Pi-rcnn: An efficient multi-sensor 3d object detector with point-based attentive cont-conv fusion module. In AAAI, volume 34, pages 12460–12467, 2020.
- Yang et al. [2020a] Qi Yang, Hao Chen, Zhan Ma, Yiling Xu, Rongjun Tang, and Jun Sun. Predicting the perceptual quality of point cloud: A 3d-to-2d projection-based exploration. IEEE TMM, 2020.
- Yang et al. [2020b] Qi Yang, Zhan Ma, Yiling Xu, Zhu Li, and Jun Sun. Inferring point cloud quality via graph similarity. IEEE TAMI, 2020.
- Yang et al. [2022] Qi Yang, Yipeng Liu, Siheng Chen, Yiling Xu, and Jun Sun. No-reference point cloud quality assessment via domain adaptation. In IEEE/CVF CVPR, pages 21179–21188, 2022.
- Yoo et al. [2020] Jin Hyeok Yoo, Yecheol Kim, Jisong Kim, and Jun Won Choi. 3d-cvf: Generating joint camera and lidar features using cross-view spatial feature fusion for 3d object detection. In ECCV, pages 720–736, 2020.
- You and Gao [2021] Kang You and Pan Gao. Patch-based deep autoencoder for point cloud geometry compression. In ACM Multimedia Asia, pages 1–7. 2021.
- Zhang and Liu [2022] Chaofan Zhang and Shiguang Liu. No-reference omnidirectional image quality assessment based on joint network. In ACM MM, pages 943–951, 2022.
- Zhang et al. [2015] Lin Zhang, Lei Zhang, and Alan C Bovik. A feature-enriched completely blind image quality evaluator. IEEE TIP, 24(8):2579–2591, 2015.
- Zhang et al. [2021a] Zicheng Zhang, Wei Sun, Xiongkuo Min, Tao Wang, Wei Lu, Wenhan Zhu, and Guangtao Zhai. A no-reference visual quality metric for 3d color meshes. In IEEE ICMEW, pages 1–6. IEEE, 2021.
- Zhang et al. [2021b] Zicheng Zhang, Wei Sun, Xiongkuo Min, Wenhan Zhu, Tao Wang, Wei Lu, and Guangtao Zhai. A no-reference evaluation metric for low-light image enhancement. In IEEE ICME, 2021.
- Zhang et al. [2022a] Chaofan Zhang, Ziqing Huang, Shiguang Liu, and Jian Xiao. Dual-channel multi-task cnn for no-reference screen content image quality assessment. IEEE TCSVT, 32(8):5011–5025, 2022.
- Zhang et al. [2022b] Yanan Zhang, Jiaxin Chen, and Di Huang. Cat-det: Contrastively augmented transformer for multi-modal 3d object detection. In IEEE/CVF CVPR, pages 908–917, 2022.
- Zhang et al. [2022c] Zicheng Zhang, Wei Sun, Xiongkuo Min, Tao Wang, Wei Lu, and Guangtao Zhai. No-reference quality assessment for 3d colored point cloud and mesh models. IEEE TCSVT, 2022.
- Zhang et al. [2022d] Zicheng Zhang, Wei Sun, Xiongkuo Min, Wei Wu, Ying Chen, and Guangtao Zhai. Treating point cloud as moving camera videos: A no-reference quality assessment metric. arXiv preprint arXiv:2208.14085, 2022.
- Zhou et al. [2018] Qian-Yi Zhou, Jaesik Park, and Vladlen Koltun. Open3d: A modern library for 3d data processing. arXiv preprint arXiv:1801.09847, 2018.