Mechanisms of strength and hardening in austenitic stainless 310S steel: Nanoindentation experiments and multiscale modeling
Abstract
Austenitic stainless steels with low carbon have exceptional mechanical properties and are capable to reduce embrittlement, due to high chromium and nickel alloying, thus they are very attractive for efficient energy production in extreme environments. It is key to perform nanomechanical investigations of the role of chromium and the form of the particular alloy composition that give rise to the excellent mechanical properties of steel. We perform nanoindentation experiments and molecular dynamics (MD) simulations of FCC austenitic stainless steel 310S, using established interatomic potentials, and we use a comparison to the plastic behavior of NiFe solid solutions under similar conditions for the elucidation of key dislocation mechanisms. We combine EBSD images to connect crystalline orientations to nanoindentation results, and provide input data to MD simulations for modeling mechanisms of defects nucleation and interactions. The maps of impressions after nanoindentation indicate that the Ni-Fe-Cr composition in 310S steel leads to strain localization and hardening. A detailed analysis of the dislocation dynamics at different depths leads to the development of an experimentally consistent Kocks-Mecking-based continuum multiscale model. Furthermore, the analysis of geometrically necessary dislocations (GND) shows to be responsible for exceptional hardness at low depths, predicted by the Ma-Clarke’s constitutive model.
I Introduction
Stainless steels with promising thermo-mechanical properties are currently proposed to be used in extreme environments applications such us new and efficient nuclear energy systems or demanding transport and construction industries Lo et al. (2009); Chen et al. (2017); Wen et al. (2017); Isakov et al. (2016). 310S stainless steel (SS) can also be used for thermal power plants, where containers present distortion during the process of being filled with high-level nuclear waste glass at elevated temperature requiring a high strength of the material Zhang et al. (2019); Szuwalski and Ustrzycka (2012, 2013). Finally, SS can also be used for manufacturing radiant tubes, thermowells, burners and combustion chambers, and annealing covers Zhang et al. (2019). Among these applications, nuclear reactor environment seems to be the most challenging. Despite the high demands related to structural, mechanical and thermal properties stability at reactor environment, austenitic SS is considered as excellent candidate for applications in Generation IV - Super-Critical Water Reactors (SCWR) due to its superior corrosion resistance. SCWR type nuclear reactors are designed to operate above the thermodynamic critical point of water (22.1 MPa, 374 C). According to the nuclear community, this type of reactor is supposed to be considered as one of the most promising future Generation IV concepts. This is due to its simplified design, compact layout, and high thermal efficiency in comparison to standard PWR or LWR systems. However, one should remember that above the thermodynamic critical point, the coolant is more corrosive which is a challenge for in-core structural components (especially fuel cladding material). In addition, the so called hot-spots, which are typical for SCWR technology, locally may reach even 600 C. Beyond this temperature, strength decreases and the material may oxidize rapidly due to the development of Cr23C6 particles which are preferentially located at grain boundaries. This increases brittleness and further deteriorates corrosion resistance. It is this temperature (C) where there is significant mechanical properties drop, and a detailed understanding of plastic deformation phenomena in SS is required before and after irradiation.
It is known that corrosion resistance is provided by the presence of Chromium (20%) in the material. At the same time, high strength and ductility are maintained due to the inclusion of high nickel content (20%) in the material. Moreover, high Ni content makes this kind of steel to not exhibit a strain-induced phase transformation Lo et al. (2009); Liu et al. (1997). Finally, additions of carbon in SS are limited and optimized to reduce the prone to embrittlement and improve its creep deformation resistance. Despite having a fairly good understanding of the effect of individual elements and their concentration on the functional properties, the microscopic mechanisms of plastic deformation are still an intriguing challenge. For this reason, in this work, experimental and numerical investigations are carried out towards understanding SS’ themo-mechanical properties.
It is well known that plasticity properties and physical mechanisms associated with the deformation of a material can be estimated from nanoindentation data Chen et al. (2017); Xia et al. (2019); Schuh (2006); Nix and Gao (1998); Oliver and Pharr (1992) where hardness and flow stress are well explained in the literature Mattucci et al. (2021); Cui et al. (2020); Zhang et al. (2004, 2006); Rodriguez and Gutierrez (2003). Hardness is defined as the ability of a material to resist plastic deformation. Tabor’s relationship between hardness and yield strength Tabor (1956) is formulated in the following way , where is the tensile yield strength, is the indentation hardness measured and is the correlation factor which depends on the elastic-plastic properties of the material. However, one should remember that at small length scales the mechanical characterization of materials indicates significant departures from the classical elastic–plastic behavior. Therefore, the characterization of SS by nanoindentation can provide information about its mechanical properties, if carefully performed Lo et al. (2009); Chen et al. (2017).
Concomitantly, Molecular Dynamics (MD) simulations have proven to be a powerful tool to emulate experimental nanoindentation tests. MD may provide atomistic insights to the mechanical response of indented samples and defect mechanisms Voyiadjis and Yaghoobi (2017); Yaghoobi and Voyiadjis (2014); Mayo et al. (1990); Sato et al. (2020); Domínguez-Gutiérrez et al. (2021); Kurpaska et al. (2022); Varillas et al. (2017), information that cannot be clearly seen through Load - Displacement (L-D) curves. The major advantage of MD simulations is the ability to investigate the thermomechanical stability of dislocation nucleation and defects’ evolution Voyiadjis and Yaghoobi (2017); Yaghoobi and Voyiadjis (2014); Mayo et al. (1990); Sato et al. (2020); Domínguez-Gutiérrez et al. (2021). In addition, MD provides insights to the dislocations contribution on the relative increase or decrease of material hardness Yaghoobi and Voyiadjis (2014); Mayo et al. (1990). Atomistic simulations can be further applied to study anisotropy in mechanical properties, providing a predictive tool for experiments with prohibitive technical limits and costs. Thus, atomistic computational studies of SS’ nanomechanical response under external loads provides an insight into fundamental defect mechanisms during testing that may explain the thermal dependence of plastic deformation, dislocation nucleation rates, and strain-hardening rates.
The present paper constitutes an attempt to fill in the gap related to multiscale computational modeling of mechanisms and plastic deformation of SS. We demonstrate a detailed experimental and computational study to understand the nanoscale plastic deformation mechanisms and anisotropy effects in polycrystalline SS Zhang et al. (2019); Musiał et al. (2022) and develop a multiscale description, using constitutive modeling. For the understanding of dislocation nucleation and evolution mechanism in SS during nanoindentation tests, we compare our MD results with the simpler, already studied, case of equiatomic FCC Ni-Fe solid solutions Kurpaska et al. (2022) under similar thermomechanical conditions. Then, by visualizing and quantifying dislocation ensembles, we develop a continuum plasticity model for the defect evolution in SS. Our manuscript is organized as follows: In Section II, we describe the experimental techniques and computational methodology for carrying out single load nanoindentation tests. By using MD simulations, we investigate the mechanisms by which dislocations lines and dislocation loops mediate plastic deformation at early stages of nanoindentation in SS samples. In Section III, the hardness measurements and atomistic insights of indentation processes in crystalline stainless steel SS samples are presented, where an agreement between experimental measurements and numerical modelling is reported and discussed. Pop-in event identification is done by comparing to Hertz fitting curve in both methods. Qualitative good agreement is reached for the unloading process allowing us to apply Oliver-Pharr method. Finally, in Section IV, concluding remarks are summarized.
II Methods
II.1 Nanoindentation Experiments
In this work, we study the mechanical properties of the low carbon 310S stainless steel with high chromium and nickel contents. This material is known for its resistance to high temperature corrosion Lo et al. (2009); Zhang et al. (2019); Szuwalski and Ustrzycka (2012) due to the presence of these two elements.
| Element | Fe | Cr | Ni | Mn | Si | C | P | S |
|---|---|---|---|---|---|---|---|---|
| weight % | 53.096 | 24-26 | 19-22 | 2.0 | 0.75 | 0.08 | 0.045 | 0.015 |
The chemical composition of our SS specimens is presented in Table 1. The material was annealed at C and air/water spray quenched. Studied specimens in the shape of square plates with dimensions of about cm were produced using electro-discharge machining (EDM) method. To reveal grain orientation, samples were submitted to the standard polishing procedure route (polishing with sandpaper from 320 till ). The final step was done by electro-polishing using LectroPol 5 system. The described methodology allowed us to limit the hardening effect while effectively reducing surface roughness. Afterward, mechanical characterization by using nanoindentation technique was performed using a NanoTest Vantage System provided by Micro Materials Ltd. Measurements were done at room temperature using a Berkovich-shaped diamond indenter tip with the load control method. Two basic parameters: hardness and reduced Young’s modulus with different indentation loads, were calculated. Before the indentation campaign started, the Diamond Area Function (DAF) of the indenter, for each given load, was determined by conducting a series of indentations on the fused silica specimen (reference sample with well-known mechanical properties). Indentations were performed using single force mode with loads from 0.25 to 10 mN and were repeated at least 15 times at a given load. The 60 sec thermal drift measurement time at the end of each indentation cycle was recorded during the test. This was done to measure the thermal difference between the sample and the indenter tip. The described methodology allowed us to investigate mechanical properties as a function of the depth, hence taking into account the response of one grain (for small loads) and the cumulative effect of grains, grain boundaries, and precipitates (for higher loads). Indentations were done with 20 m distance between each indents (in and direction). This allowed us to avoid interference of the indents or probing in an already deformed (by previous indent) region which is particularly important to prevent the influence of indentation stress field. The experimental details of the nanoindentation campaign are shown in Tab 2. Thus, the SS samples were characterized by calculating the nanohardness (H) and reduced Young’s modulus (Er) values at different depths, following the well-known classical Oliver and Pharr approach Oliver and Pharr (1992).
| Experiment type | Single load |
|---|---|
| Method | Load Controlled |
| Load ramp control | Fixed time load |
| and unload | |
| Max. load (mN) | 10 |
| Min. load (mN) | 0.25 |
| Limit stop load (mN) | 0.1 |
| Indenter cont. vel. (m/s) | 0.2 |
| Load time (s) | 5 or 10 |
| Unload time (s) | 3 or 5 |
| Dwell period at max. load (s) | 1 or 2 |
| Dwell period for drift correction (s) | 60 |
| Number of columns | 1 |
| Number of rows | 12 |
| Distance between indent (m) | 20 |
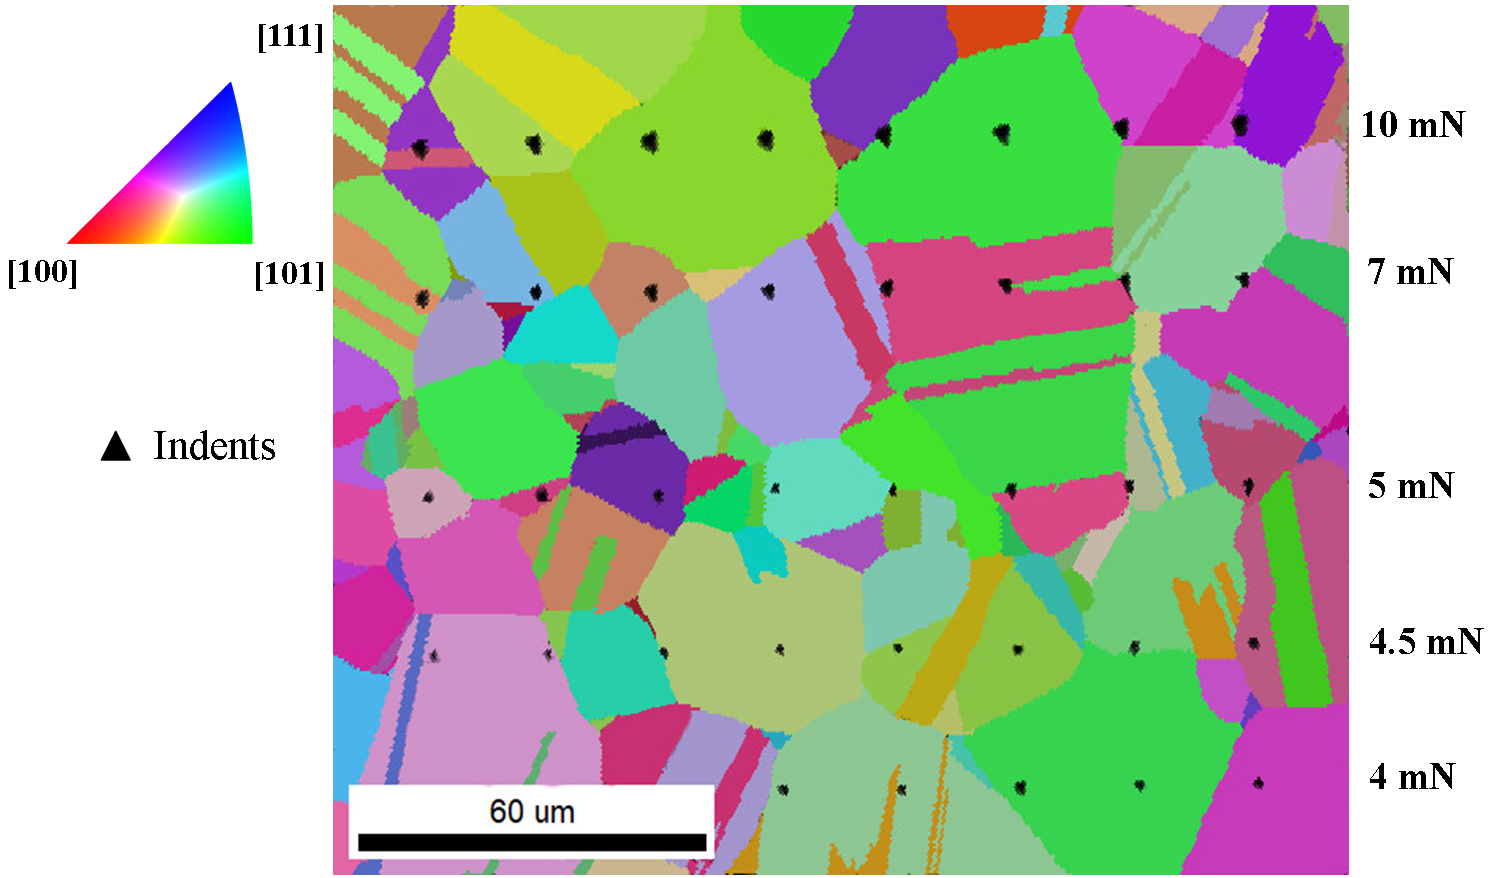
After the mechanical test, detailed structural characterization was done. The Electron Backscatter Diffraction (EBSD) analysis of the indented sample was conducted using ThermoFisher Scientific Helios 5 UX Scanning Electron Microscope (SEM) equipped with an EDAX Velocity Pro EBSD system. The mapping of the specimens was done using 20 keV electron beam of 6.4 nA probe current. The grain reconstruction in the collected EBSD maps has been performed in EDAX OIM Analysis 8 software by an algorithm that groups sets of connected and similarly oriented points into grains if they are within specified Grain Tolerance Angle (equal to 5 deg. in the studied case) of a given point. The Minimum Grain Size, which is the number of points on the measurement grid required whether a given group of points should be considered a grain, has been set to 2. A crystallographic orientation expressed in can be assigned to each reconstructed grain. This information for selected grains has been used as input data for the computational modeling, with approximately identical orientations. The average grain size of the as-received SS was around 20 m, as depicted in Fig 1.
II.2 Atomistic modeling and simulations
Atomistic computational modeling is based on the Molecular Dynamics (MD) simulations by the Large-scale Atomic Molecular Massively Parallel Simulator (LAMMPS) Thompson et al. (2022) with interatomic potentials based on EAM Bonny et al. (2013) to describe the atom-to-atom interactions in SS. In order to model FCC Fe-Ni-Cr samples, we first create a pure FCC Fe sample with a lattice constant of 0.3562 nm followed by randomly replacing Fe atoms by Ni and Cr atoms at [100], [110], and [111] crystal orientations. However, the potential energy of structure is minimized, with the idea the real value is achieved in the process. The lattice constant is slightly changed during the sample equilibration compared to the originally adopted. The obtained sample with an atomic distribution of: 54.7% Fe; 18.8% Ni; and 26.5 % Cr is then prepared by a series of Monte Carlo simulations to search for each possible metastable configuration at room temperature. Then, we applied a process of energy optimization and equilibration for 100 ps with a Langevin thermostat at 300 K and a time constant of 100 fs Mayo et al. (1990). This is done until the system reaches a homogeneous sample temperature and pressure profile Mayo et al. (1990) with a density of g/cm3, the numerical parameters that defined our numerical cells are presented in Tab 3. For the equiatomic Ni-Fe concentrated solid solution Alloy, we utilized a potential interatomic reported by Choi et al. Choi et al. (2018) which are based on the second Nearest Neighbor Modified Embedded Atom Method (2NN-MEAM). The numerical cell defined as: (33.08x, 35.95y, 30.97z) and with 1 582 400 Ni and 1 582 400 Fe atoms, as reported in our previous work Kurpaska et al. (2022).
| Orientation | Size(dx,dy,dz) [nm] | Atoms |
|---|---|---|
| (44.68,43.97,50.09) | 8 610 000 | |
| (44.58,43.78,52.62) | 8 985 600 | |
| (44.73,43.78,52.67) | 9 027 000 |
Under the spatial (few nanometers) and time (picoseconds) scales of the MD simulations, the initial processes of the plastic deformation of the materials can be studied at the atomic level by nanoindentation testing Nix and Gao (1998). In addition, the computational modeling is an approximation to the roundness of the Berkovich tip into the consider errors due to the use of a spherical indenter in the MD simulations, which is limited to only few nm depths Bei et al. (2005). Furthermore, the 20 m/s indentation velocity considered in our work is smaller than the sound’s speed in solids where our computational results can accurately capture the elastic Hertzian regime and provide information of early dislocation nucleation, similar to those obtained in experiments, along with a better understanding of the elastic-plastic deformation transition of the material. In Fig 2, we present the initial frame of the nanoindentation simulation which is defined into three sections in the direction. Thus 1) the lowest bottom layers are kept frozen (0.02dz) to assure stability of the atoms when nanoindentation is performed; 2) a thermostatic region (0.08dz) above the frozen one is set to dissipate the generated heat during nanoindentation; and 3) the rest of the layers are defined as the dynamical atoms section, where the interaction with the indenter tip modifies the surface structure of the samples. Finally, a 5 nm vacuum section is added at the top of the sample Domínguez-Gutiérrez et al. (2021).
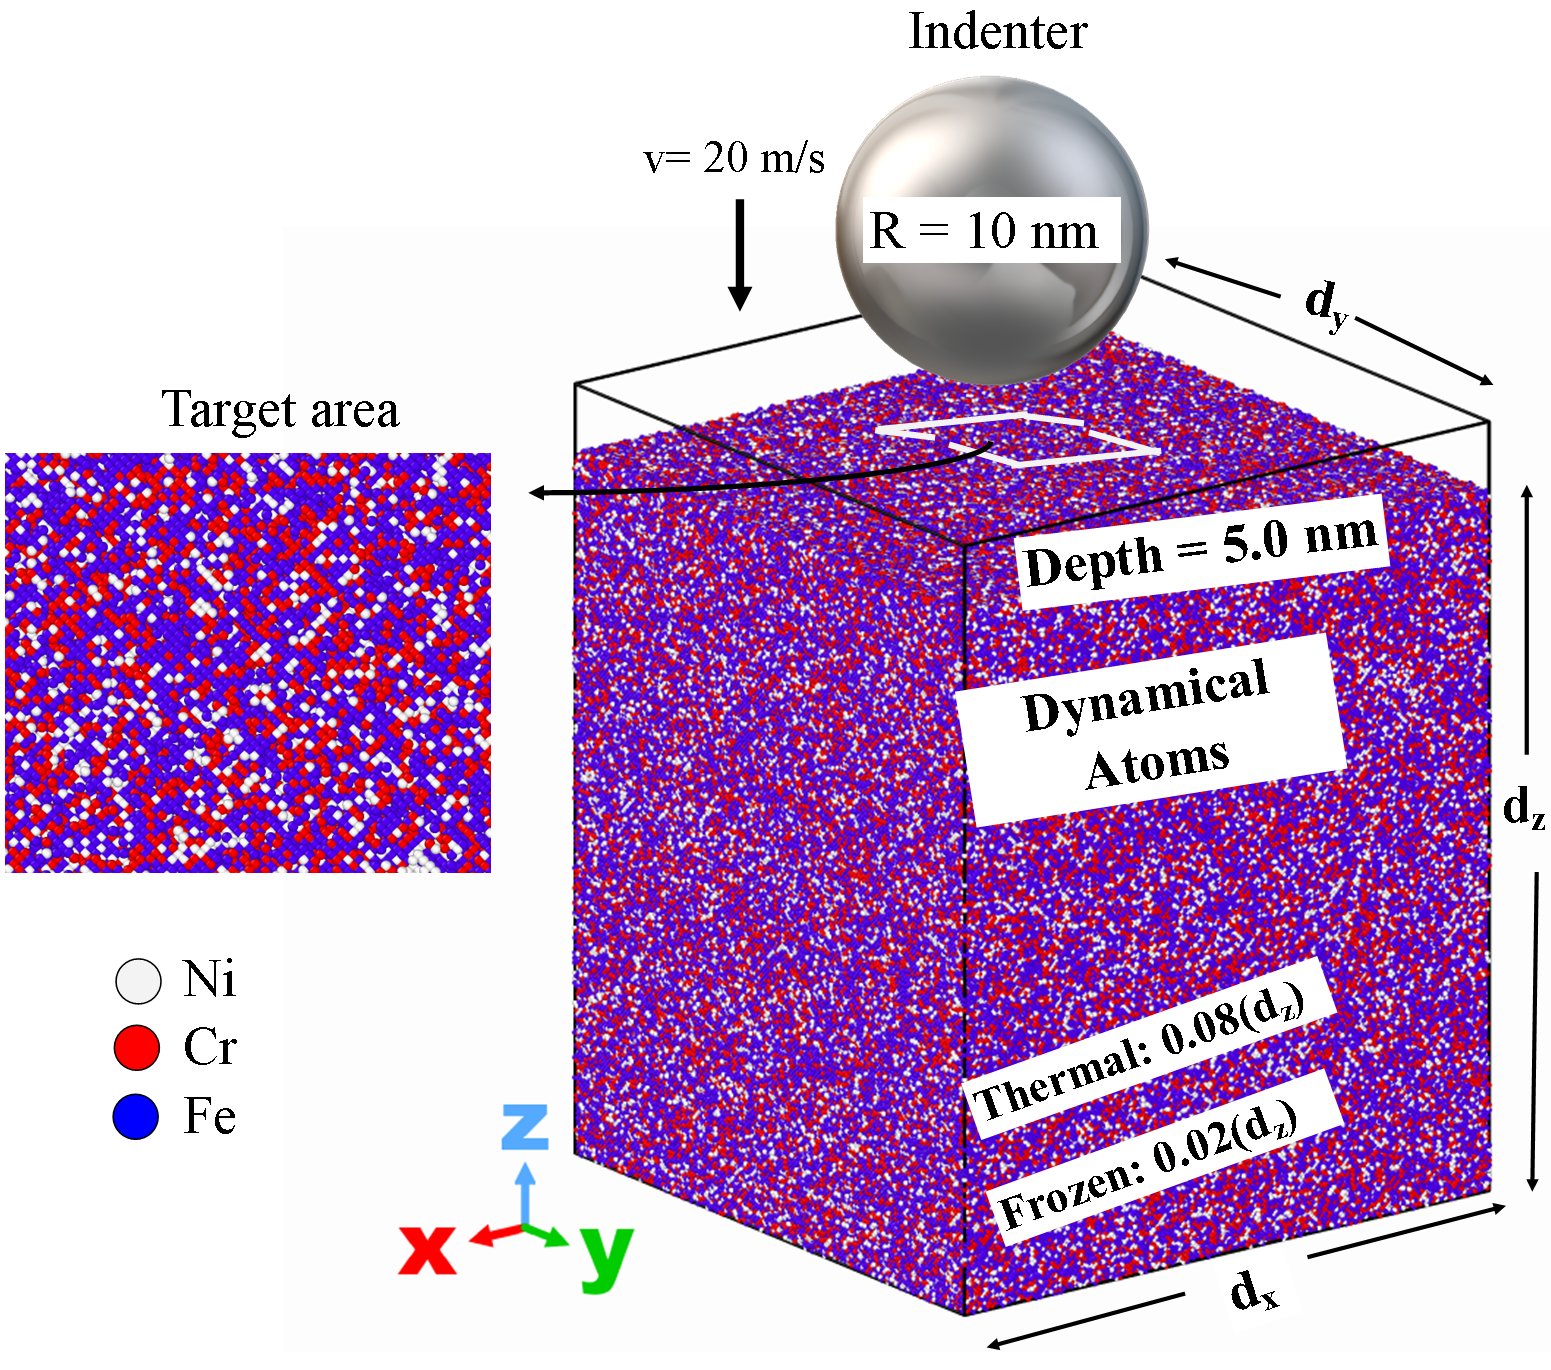
In our work, we use a NVE statistical thermodynamic ensemble to carry out the indentation test, where the velocity Verlet algorithm is implemented in LAMMPS with periodic boundary conditions set on the and axes to simulate an infinite surface. A non-atomic repulsive imaginary (RI) rigid sphere defines our indenter tip as: where the constant force is K= 37.8 MPa, and the trajectory of the center of the indenter tip is defined as , with radius = 10 nm, surface contact point as and , and the initial gap nm between the surface and the intender tip to avoid effects of initial tip-surface interaction. The indenter tip’s speed m/s is chosen as positive for loading, and as negative for unloading processes. Each calculation was performed for 125 ps with a time step of fs. for a maximum indentation depth of 5.0 nm to avoid the influence of boundary layers of the material. We consider the random atomic distribution of the elements on the material surface by performing 10 simulations at different indenter tip’s positions into 10nm10nm target area, as depicted by a white square in Fig 2. Thus, the load on the indenter is computed by the forces acting on the indenter in the -axis direction and the depth is calculated as the displacement of the indenter tip relative to the initial surface of the material sample.
II.3 Measures of Hardness and Elastic Moduli
Once the experimental and computational nanoindentation test is done, the unloading curve of the load displacement recording is analsyzed to apply the Oliver-Pharr method as follows:
| (1) |
with is the indentation load; is the indentation depth and is the residual depth after the whole indentation process; and and are fitting parameters. Thus, the nanoindentation hardness can be computed as: where is the maximum indentation load at the maximum indentation depth, where is the projected contact area with as the indenter tip radius and . Here is a factor related to the spherical indenter shape for the MD simulations, and unloading stiffness . Thus, the Oliver-Pharr method can be applied to compute the Young’s modules of the material at different indentation depths as Oliver and Pharr (1992, 2004).
The Young’s module is computed as:
| (2) |
where and are the Poisson’s ratio of the 310S sample and indenter, respectively. is the Young’s modulus of the spherical indenter that is considered to be infinitely large, and the effective elastic modulus with and for a spherical and Berkovich indenter shape, respectively Oliver and Pharr (2004).
II.4 Atomic shear strain mapping
For the shear dependence of nanoindentation, atomic strains are computed through the distance difference, , between the the -th nearest neighbors of the -th atom of the pristine and indented samples. Followed by defining the Lagrangian strain matrix of the -th atom as Shimizu et al. (2007):
| (4) |
Thus, the shear invariant of the -th atom is computed as:
| (5) |
This approach is implemented in OVITO Stukowski (2010).
II.5 Multiscale dislocations evolution
In order to analyze the influence of the crystal orientation on the dislocation nucleation and evolution of the sample, we visualize and quantify different types of dislocations nucleated at different indentation depths by using the OVITO Stukowski (2010) software. This was done through the use of the Dislocation Extraction Algorithm (DXA) Stukowski et al. (2012); that extracts dislocation structure and content from atomistic microstructures. Thus, we categorized the dislocations into several dislocation types according to their Burgers vectors as: ½¡110¿ (Perfect), 1/6¡112¿ (Shockley), 1/6¡110¿ (Stair-rod), 1/3¡100¿ (Hirth), 1/3¡111¿ (Frank) noticing that the nucleation of partial 1/6¡112¿ Shockley dislocations is dominant in the loading process regardless of the crystal orientation due to the material’s FCC structure. Thus, we compute the dislocation density, , as a function of the depth as
| (6) |
where is the number of dislocation lines and loops measured during nanoindentation test; is the dislocation length of each type, and is the volume of the plastic deformation region by using the approximation of a spherical plastic zone; where is the largest distance of a dislocation measured from the indentation displacement, considering a hemispherical geometry. In order to obtain more information about the nanomechanical response of the material during loading event, we calculate the indentation stress and strain by considering the contact radius between the sample and the tip by using the geometrical relationship . Thus, the nanoindentation stress and strain are calculated using the following equations Pathak and Kalidindi (2015):
| (7) |
where is load, is indenter displacement. The first expression for the nanoindentation strain is considered as a physical strain where the nanomechanical response of the material is provided by the indentation depth () and the contact radius of the indenter tip, .
The following constitutive laws of dislocation mechanics are used to describe the evolution of dislocation density during plastic deformation in continuum material point Kocks and Mecking (2003); Tsuchida et al. (2001)
| (8) |
with
| (9) |
where denotes length of the Burgers vector, is the mean free path of dislocation and is the dislocation annihilation constant Bouaziz (2012). The evolution of the total dislocation density during plastic deformation is decomposed into the component of dislocation multiplication denoted by associated with the production of new dislocations and the annihilation component denoted by . The relation between the effective plastic strain rate and the the plastic shear rate is expressed by a mean orientation factor as . As a result the relationship between the evolution of and the plastic strain is obtained in the following form
| (10) |
where is the average grain size and is a constant.
III Results
III.1 Nanoindentation experiments and molecular simulations
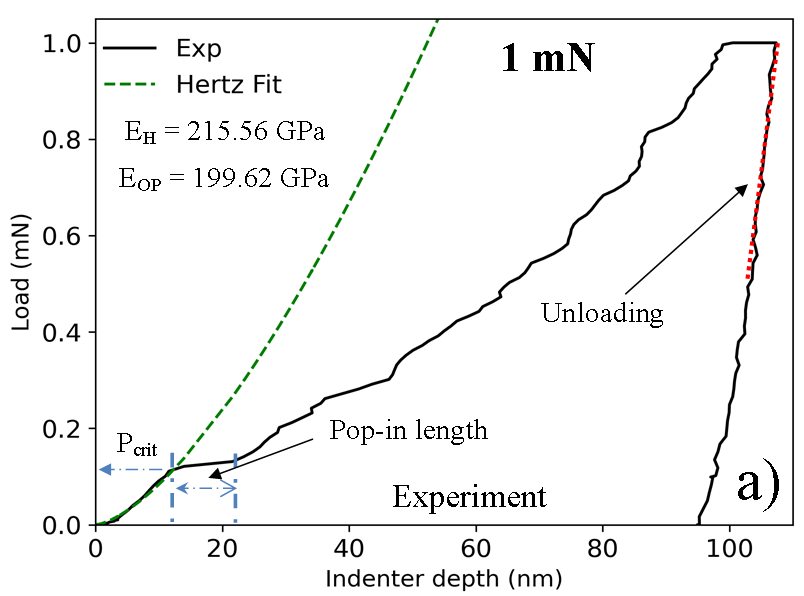
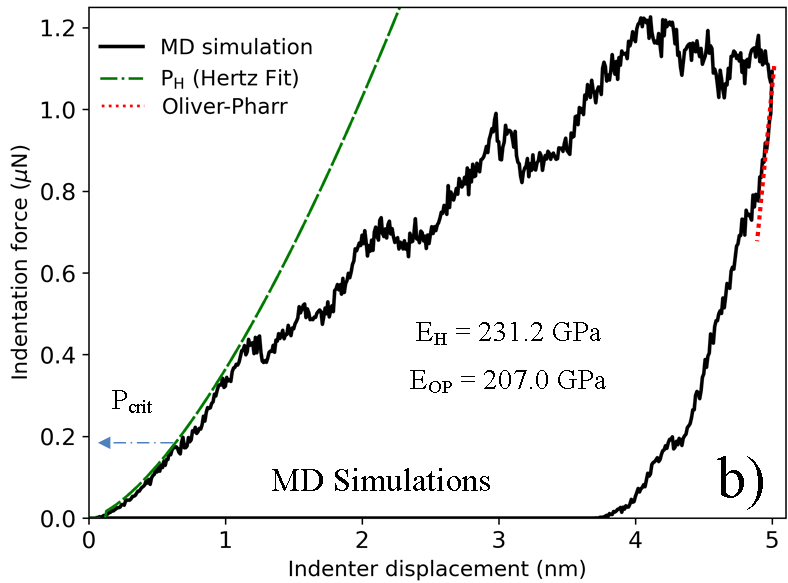
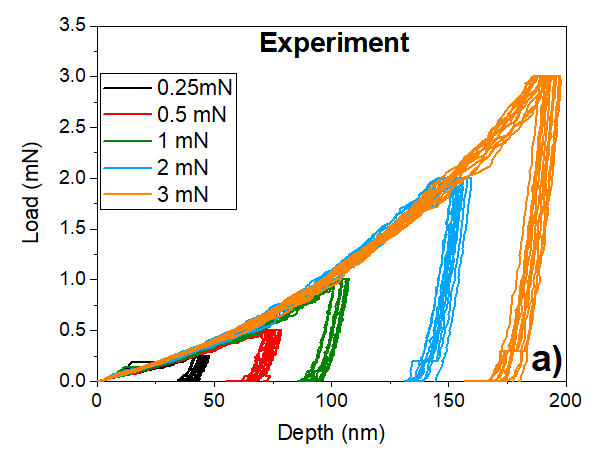
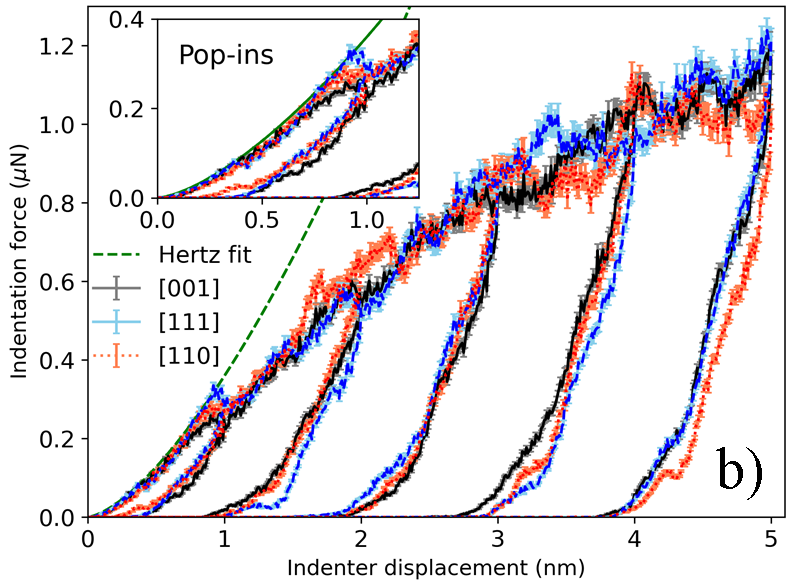
In order to numerically model the nanoindentation test with a single force mode, we need to follow the recorded LD curve that is obtained experimentally as shown in Fig 3a). Here we present an initial loading-unloading curve recorded at 1mN reaching a depth of 100 nm. The test was done at a [110] grain, according to the EBSD image shown in Fig 1. At the beginning of the loading process, the pop-in event Xu et al. (2021); Papanikolaou et al. (2017) is identified by fitting this part of the curve to the Hertz curve defined as: we calculate the effective elastic modulus of the studied system. This defines the critical load (and length) of the pop-in which is necessary to trigger elastic-plastic transition Morris et al. (2011). In Fig 3b), we show results for the numerical modeling of nanoindentation test performed on the [110] crystal orientation. One can observe that the pop-in event guides the elastic-plastic transition which is observed as a deviation of the force respect to the Hertz fitting curve, (without pop-in length). Calculated experimental elastic modulus value for this selected LD curve is = 215.56 GPa, while the MD simulation results with = 231.2 GPa. In addition to that, both methods allowed us to observe several pop-in events during the nanoindentation test. Also, one can see that the unloading process recorded experimentally and simulated is in qualitative good agreement, as shown in Fig 3. Thus, the Oliver-Pharr method is applied to compute the hardness and Young’s modulus of the material by applying a fitting curve to the unloading curve in both methods as shown in Sec. 2.2.
In Fig 4a), we report the recorded LD curves for different initial load values to investigate the hardness of the sample material as a function of its depth for several indentation tests. This was done to collect more statistical data and take into account morphology of the surface, crystal orientation and impact of grain boundaries, as these events must be taken into account for this kind of mechanical tests. As shown by the experiments, at a load range of 0.25 to 3 mN where plastic deformation can be at some extend compared to MD simulations, albeit that the spherical indenter tip is moved at a fixed speed during the computational nanoindentation test. In order to emulate the experiments, we performed MD simulations reaching different depths in the material so that the Oliver-Pharr method can be applied to each indentation depth.
In Fig 4b), we present the results from 10 MD simulations for each [001], [110], and [111] crystal orientations taking into account the random atomic distribution on the material surface. Thus, the average of the results is reported as: where is the number of the MD simulations and the error bars correspond to the maximum and minimum values from the simulations. We noticed that the maximum pop-in load has been recorded for the [111] orientation, followed by [110], while the lowest value defines the [001]. This is representative for FCC samples (shown in the inset figure). During the loading process several pop-ins are observed in the MD simulations due to the distortion of the lattice constant of the material. Experimental data show also these effects where several pop-ins are observed at depths smaller than nm. Recorded data suggest that the correlations between the crystal orientation and the pop-in magnitude exists. This will be further analyzed in the next section of the article.
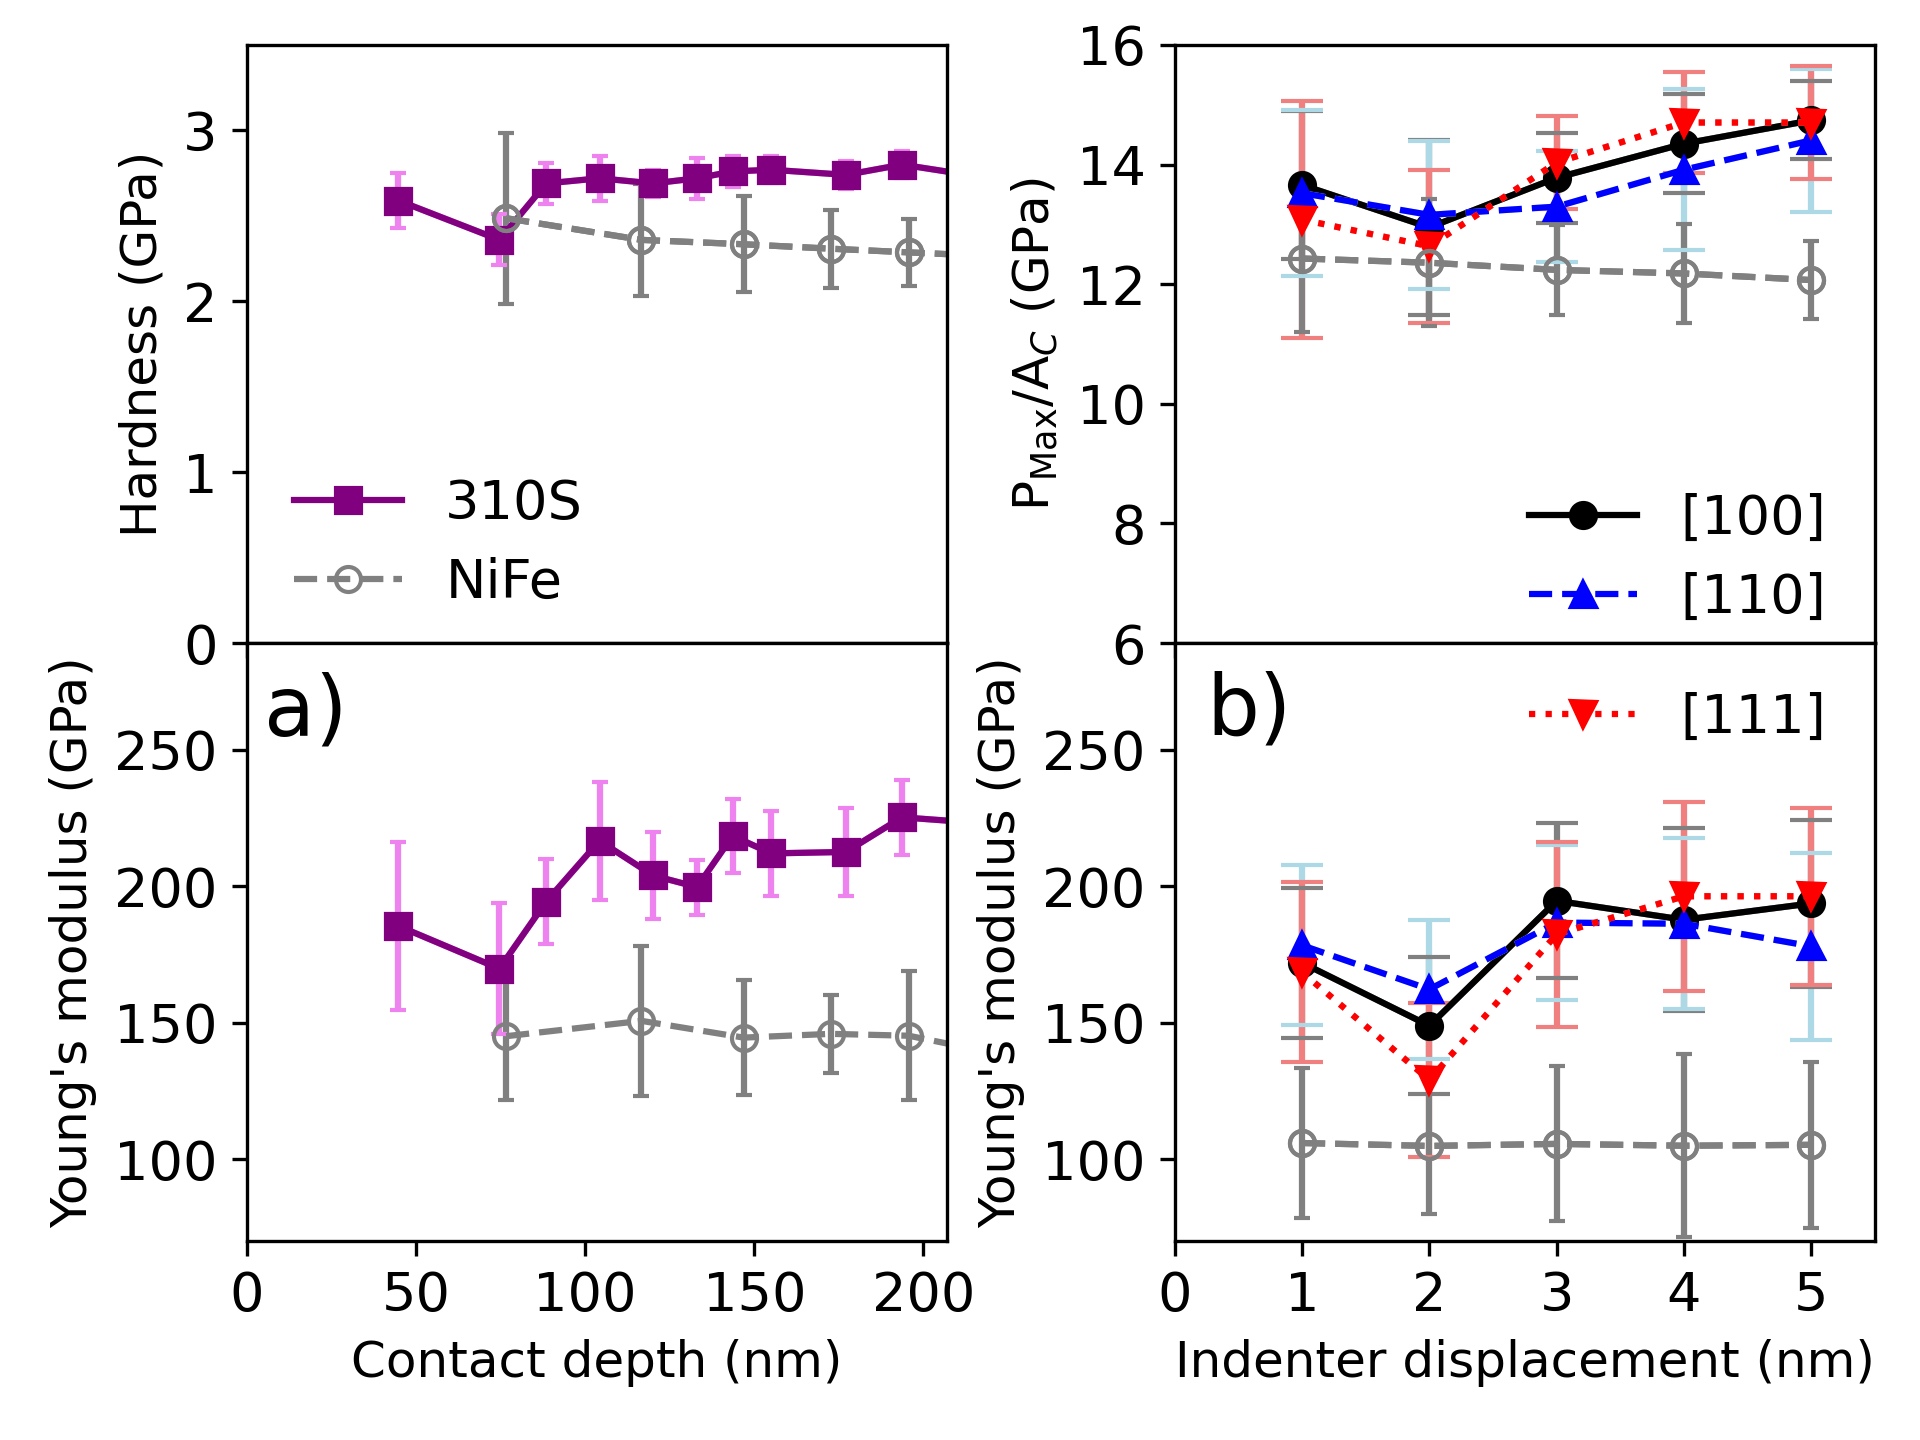
In Fig 5, we present results of the hardness and Young’s modulus vs indentation depth recorded experimentally, in Fig 5a), and from the numerical modeling in b). In the numerical part we consider different crystal orientations. The error bars are associated to the maximum and minimum value obtained from 10 MD simulations. We noticed a qualitatively good agreement between both methods where recorded pop-in event during the loading process can be associated to the nucleation of geometrically necessary dislocation (GND), as analyzed in the following sections. Presented results were obtained by applying the Oliver-Pharr method to the unloading curve at different initial loads (Fig 3a), while the MD simulations provide information of the unloading process at each indentation depth (with single nm precision) where the calculations of the hardness and Young’s modulus were done. Same as the experimental data, MD simulations present higher error bars for small depths. Also, one can see that the calculated hardness and young modulus values are within the error bars, regardless of the studied crystal orientation. This is related to the sample roughness (in the case of experimental tests) and probably to the orientation of the material (in the case of simulations) where the nanoindentation tests were carried out. Hardness data from experiments are reported in the supplementary material. In order to report the effects on chemical complexity of the material on the mechanical properties, we compare results to those reported for an equiatomic single-phase concentrated solid solution alloy (SP-CSA) defined as NiFe Kurpaska et al. (2022) for experimental and computational modeling. We noticed that the hardness of the binary alloy smoothly decreases as a function of the depth for both methods. Reduced Young’s modulus is constant regardless the depth of the tip. This comparison shows the effect of lattice mismatch and Cr concentration in 2 to 3 elements mixed materials.
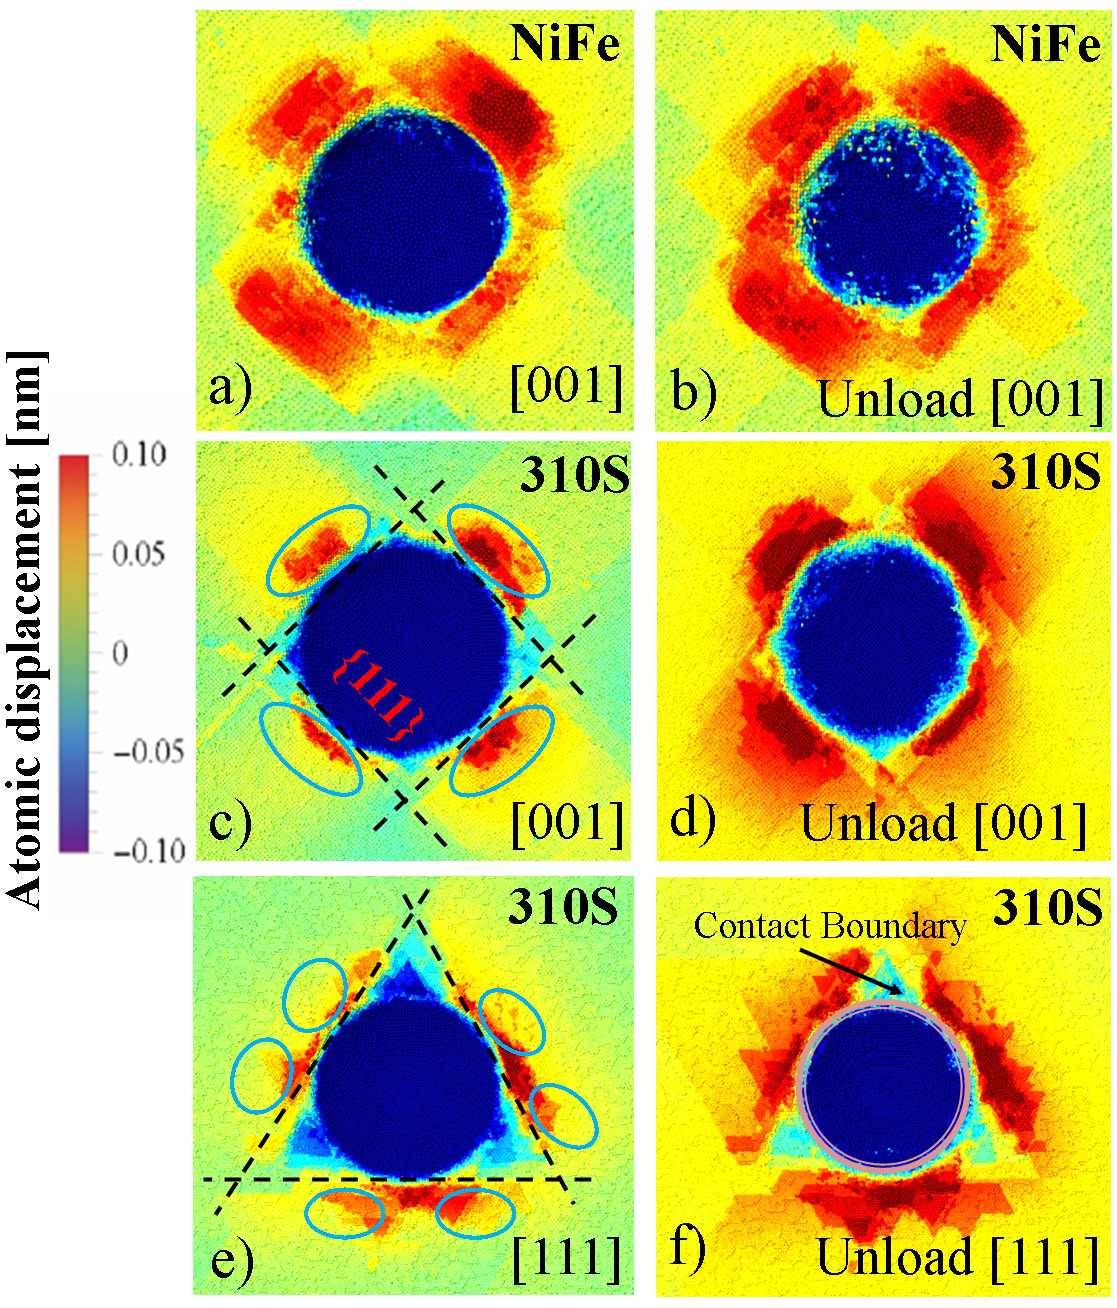
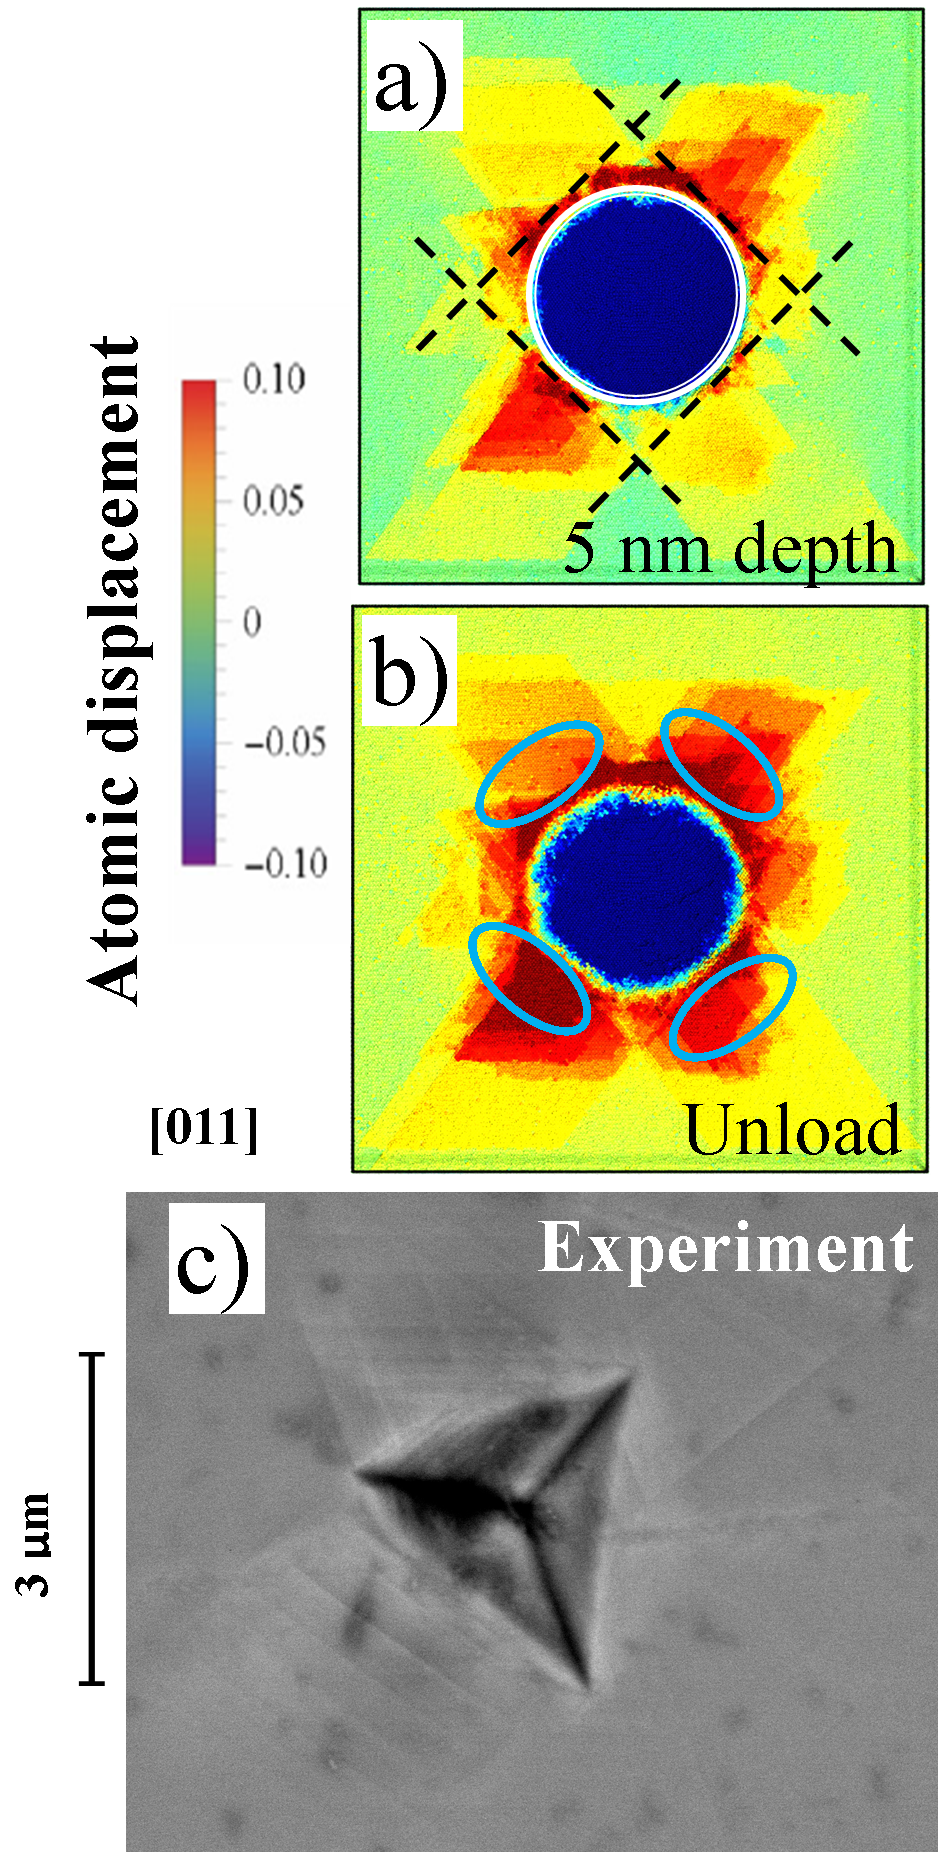
The simulated nanoindentation tests were carried out by considering different crystal orientations to investigate their effects on the mechanical properties of the material and account for surface morphology. In Fig 6, we present the atomic displacement at the maximum indentation depth from the MD simulations calculated for [001] NiFe in a-b), and for SS sample for the crystal orientations of [001] in c-d) and [111] in e-f). We identified that the {111} slip system family activated during the loading process which is associated to the slip traces on the [110] orientation. The out-of-plane displacements are highlighted by blue circles presenting the typical morphology for FCC materials Sato et al. (2020) where the profile around the indent on the [001] orientation shows a fourfold symmetry, while the [111] orientation is defined by the sixfold symmetry. Formed pile-ups following {111} planes are observed at the maximum indentation depth. It is worth pointing out, that the pile-ups formation results primarily due to the crystalline nature of the material and depends strongly on the hardening of the material during deformation.
In order to qualitatively compare MD simulations results with experimental data in Fig. 7 we present the atomic displacement for the [110] orientation at the maximum indentation depth in a) and after nanoindentation test in b); SEM image of slip traces formation for an indent on a [110] grain in c). These images show a good agreement where the two-fold symmetry and the attainment of crystallographic slip directions are observed by both methods. Experimental data for this indent at 225 GPa agrees well with MD simulations report in Fig. 4
III.2 Dislocation mechanisms and multiscale modeling
In Fig 8 we show results of the average dislocation density in a) and indentation stress in b) calculated for different crystal orientations as a function of the indentation strain. The interaction of symmetrical Shockley dislocations are observed to be responsible for prismatic dislocation loops (PDL) nucleation, as identified in Fig 8a) for different crystal orientations. In Fig 8b), we show the dislocation density as a function of the indentation strain for different crystal orientations where the elastic process is fitted to Hertz equation identifying the first pop-in event.
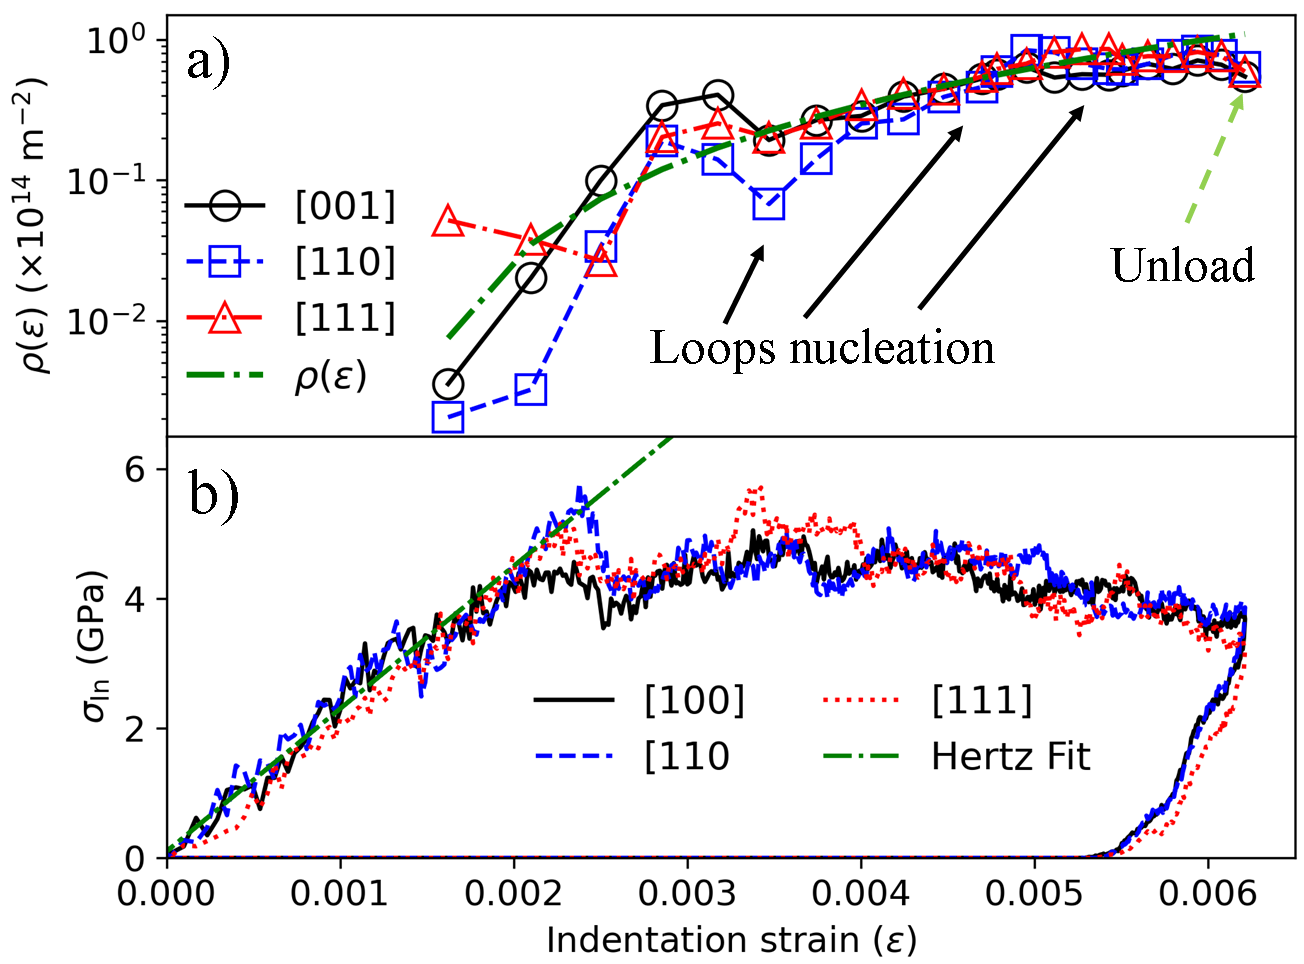
A comparison of the evolution of the dislocation density for different crystal orientations as a function of the indentation strain obtained from MD simulations with theoretical curve (Eq 10) is shown in Fig 8. The agreement can be regarded as satisfactory. This also shows that the adopted constitutive assumptions (Eqs. 8 and 9) are sufficient for the description of kinetics of dislocation density. This equation is assumed to principally reflect the dislocation mechanisms governing inelastic deformation in the indented material.
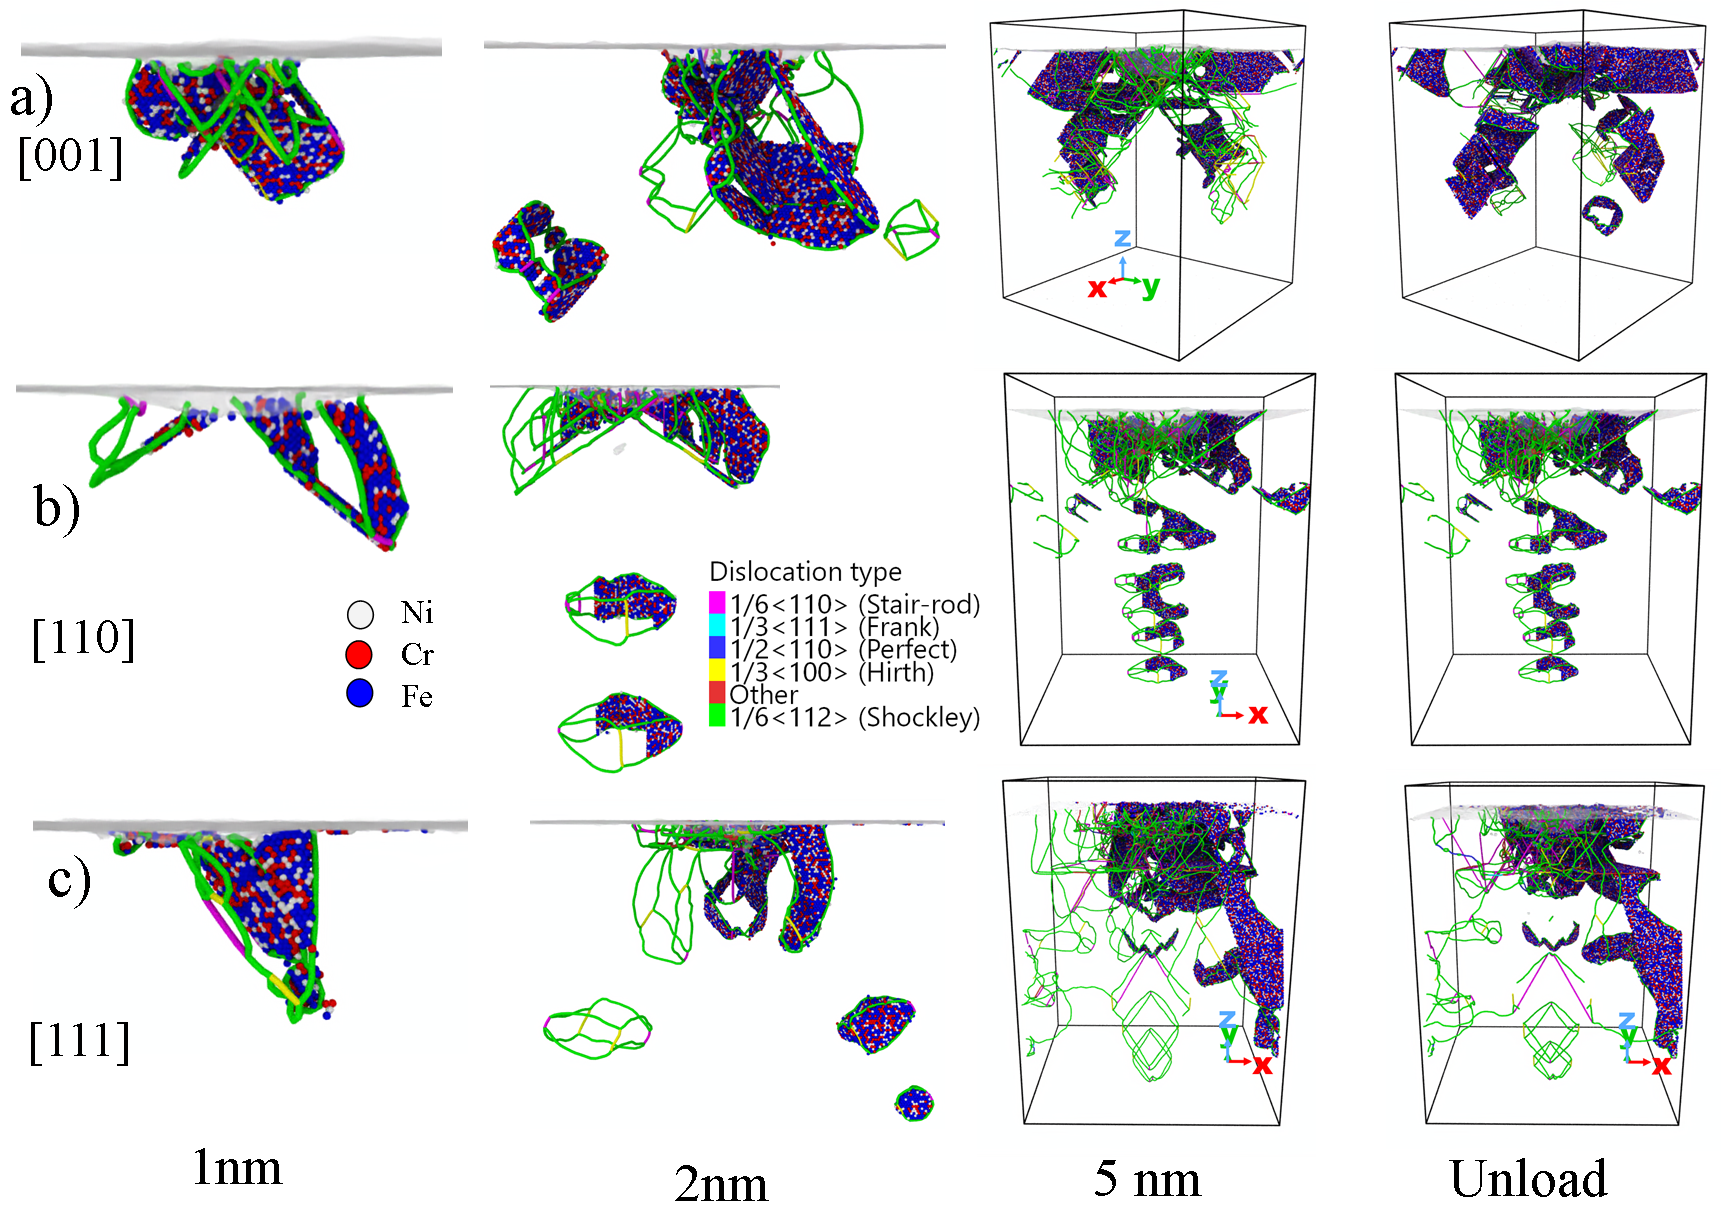
In Fig 9, we show the dislocation lines and loops nucleated at 1nm, 2nm, 5nm depths, and after unloading process. The calculations were carried out for a particular MD simulation for [001] in a), [110] in b), and [111] in c) crystal orientations. We noticed that the dislocation loops following the {111} slips systems by computing the atomic displacements where prismatic dislocation loops are found due to the interaction of Shockley type dislocation during the loading process. Obtained numerical results shows that the mobility of prismatic dislocation loops (PDLs) on the [001] crystal orientation tend to form stacking fault tetrahedron (SFT) due to the 1/3¡100¿ Hirth dislocation junction by the interaction of Shockley type dislocations. At the same time, the formation of SFT is not observed for the [110] and [111] orientations. On the [110] orientation, we observe the propagation of PDL through the sample where 4 loops were found at the maximum depth. After the unloading process, 2 PDLs are pushed back and they are absorbed by the surface, leaving 2 PDL in the sample after the nanoindentation test. Lastly, for the [111] orientation, 4 PDLs were observed at the maximum indentation depth. Finally, the effect of hardness decrease is connected with the nucleation the dislocation loops at the 2 nm depth acting subsequently as obstacles to the deformation in the material and increase of hardness. The unloading process provides the information about elastic recovery after the nanoindentation cycle is terminated. In the Supplementary material of this paper we show the animation videos of the MD simulations of the loading and unloading processes at different crystal orientations.
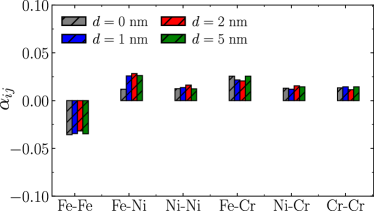
In the next step we checked if the nanoindentation simulation induces a level of ordering in our random sample due to the chemical complexity of the stacking fault planes formed during loading process. To do so, we calculate the pair wise shot range order parameter as Li et al. (2019):
| (11) |
where is the average probability of finding a type atom around an -type, means that the calculation is performed only considering the 1st nearest neighbors, is the average concentration of type atom in the sample, and is the Kronecker delta function. Fig 10 shows the value of at 1, 2, and 5nm depths. An evident increase in the absolute value of the pairwise SRO parameter is not observed indicating that nanoindentation test does not affect the randomness of the SS samples; and the system keeps as a random solid solution structure during the whole process. In addition, this fact was also found during the nanoindentation test of equatomic NiFe sample.
In nanoindentation testing, plasticity size effects were vastly experimentally studied Yilmaz et al. (2020); Ustrzycka et al. (2020); Ruiz-Moreno and Hähner (2018). In the case of strain-hardening materials, hardness is less related to yield strength and plastic deformation, but it directly depends on a strain induced by the indenter geometry. Here, Nix and Gao Nix and Gao (1998) proposed the mathematical model by considering the total density of dislocations separated into two densities of statistically stored dislocations (SSD) and geometrically stored dislocations (GND). The former constitutes a group of dislocations accumulated by multiplication during plastic deformation and the latter is accumulated in strain gradient fields caused by geometrical constraints of the crystal lattice.
For the considered material the depth-dependent nanoindentation hardness is plotted as a function of the indentation depth in Fig 5 noticing a suddenly decrease for both MD simulation and experimental method. This occurs at around 80 nm indentation depth from the experimental measurements and around the 2 nm depth for the numerical modelling. Thus, we note that the decrease of the measured hardness of the material is observed at early stages of nanoindentation process, where the accumulation rate of GNDs can be described by the geometric slip distance, parameter strongly dependent on the microstructure and independent of strain Ashby (1970). The geometric slip distance is analogous to the slip distance for the SSD and expresses the effectiveness of particles or grain in causing dislocations to be stored. Moreover, the GND density has to be directly related to the strain gradient as follows:
| (12) |
where is the shear applied on the primary slip plane and is defined as some finite length connected with the particle size. For a rough estimate of the geometrically stored dislocations GNDs, Ma and Clarke Ma and Clarke (1995) proposed the average shear strain below the indent as
| (13) |
where denotes the indent diameter. The local length scale used in Eqs. 12 and 13 can be expressed by the indentation contact depth as .
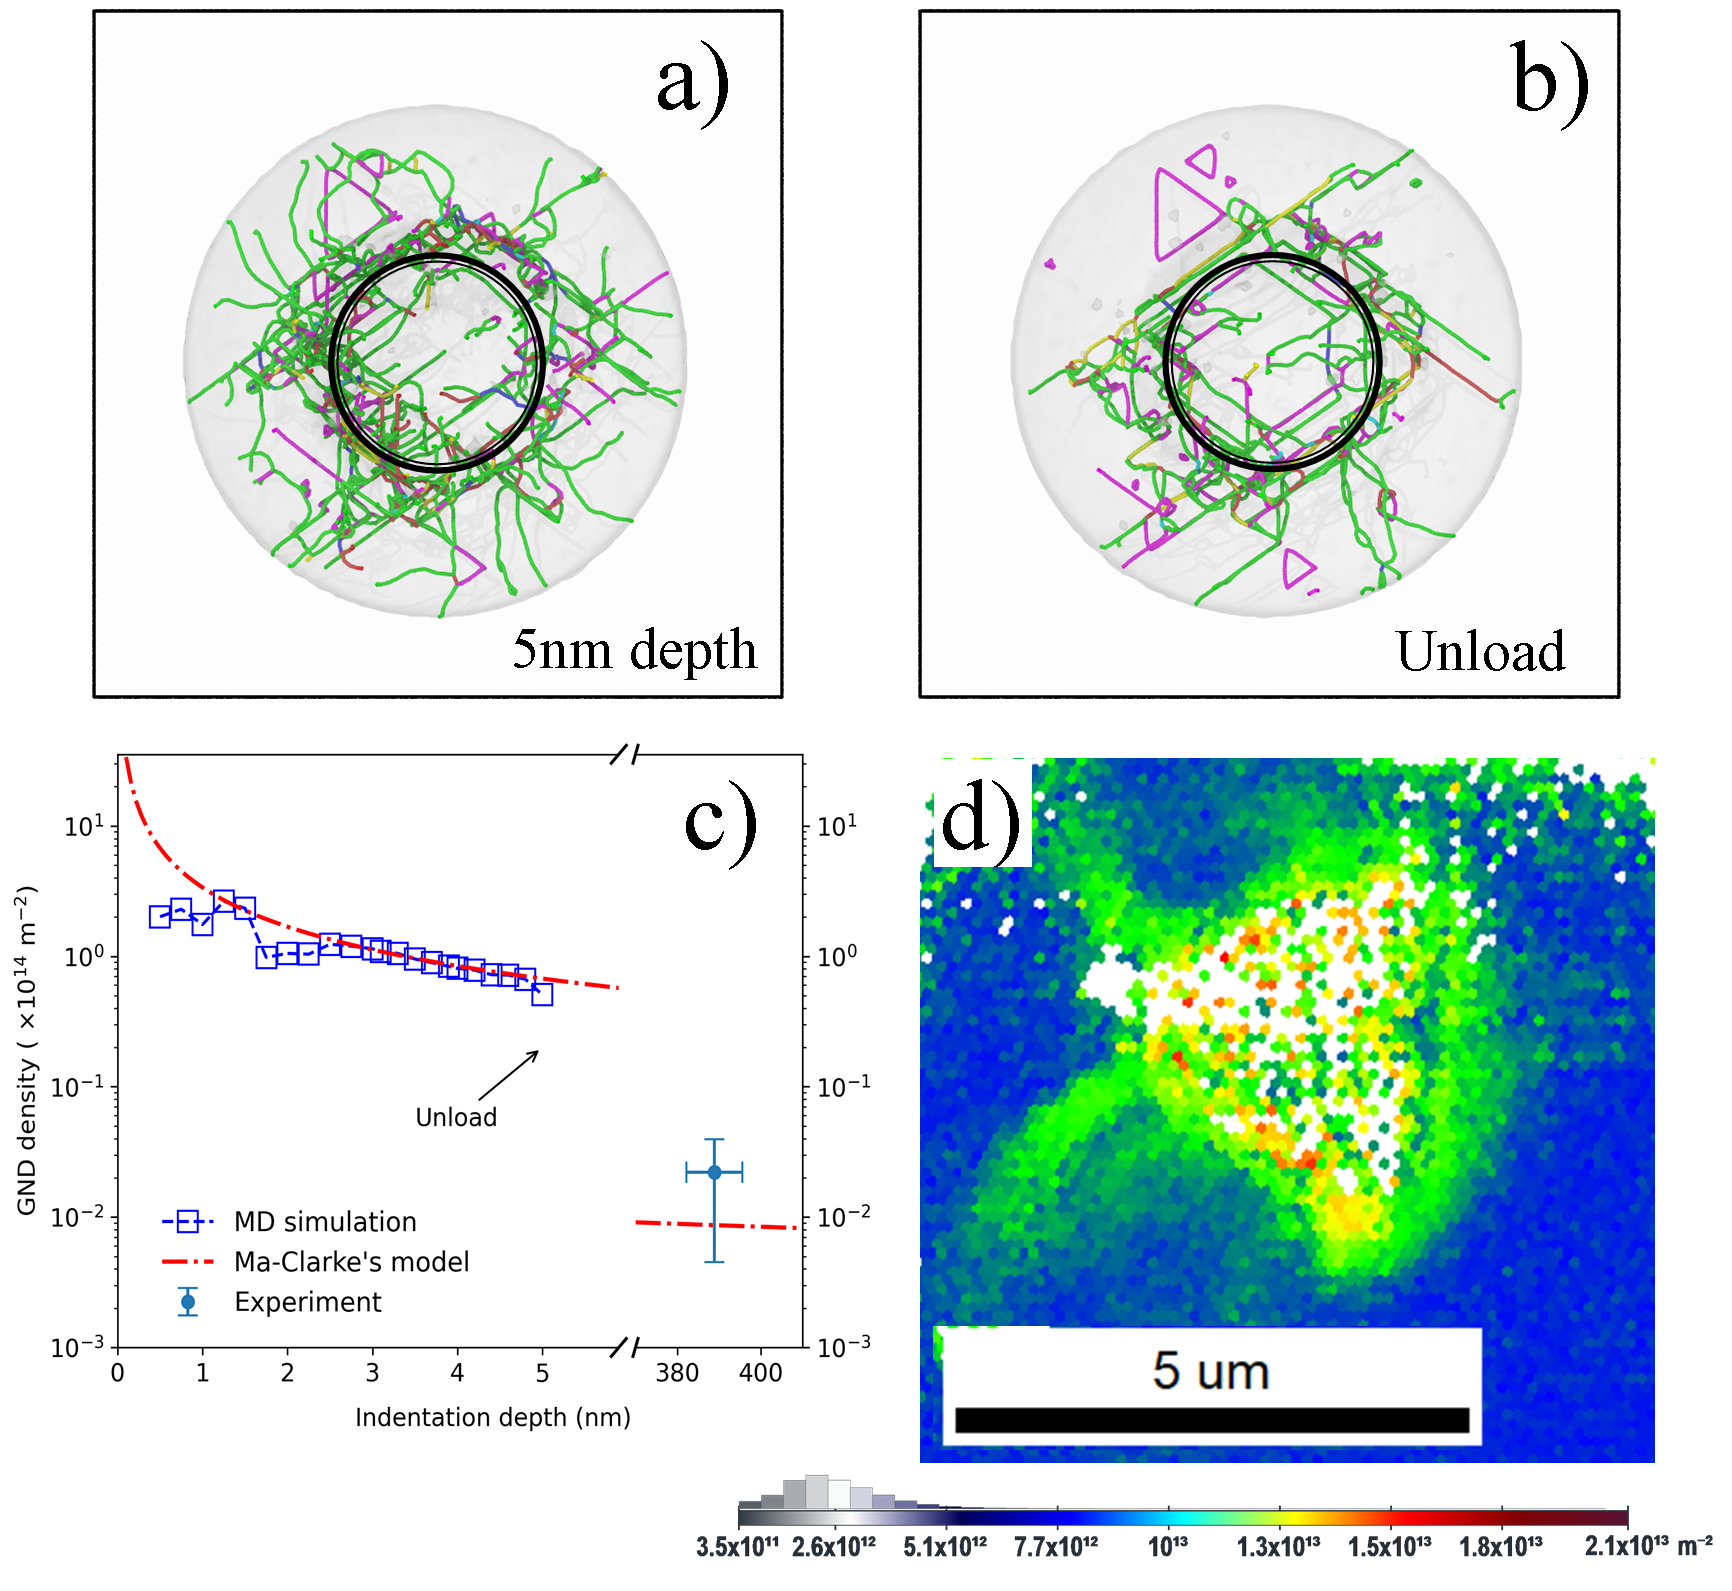
In Fig 11a-b) we present the visualization of the GNDs nucleated at the maximum indentation depth and after nanoindentation test, a gray circle is added the plastic deformation volume. We noticed that computed GNDs density from MD simulation as a function of indentation depth follow the Ma and Clarke relationship as shown in Fig 11c) (Fig 11d) reports experimental data obtained by EBSD investigation of the indentation made with depth of 388.68 nm (see Fig. 11d) and a crystal orientation close to [110] where the obtained GND density agrees well with the Ma-Clarke’s fitting. Due to the fact, that the plastic area around the indent is proportional to the ten times of the indentation depth Mattucci et al. (2021) the GNDs analysis was provided from the larger area (compare the zones marked with red circles in Fig. 11d). Thus, the surface distribution of GNDs density is obtained.
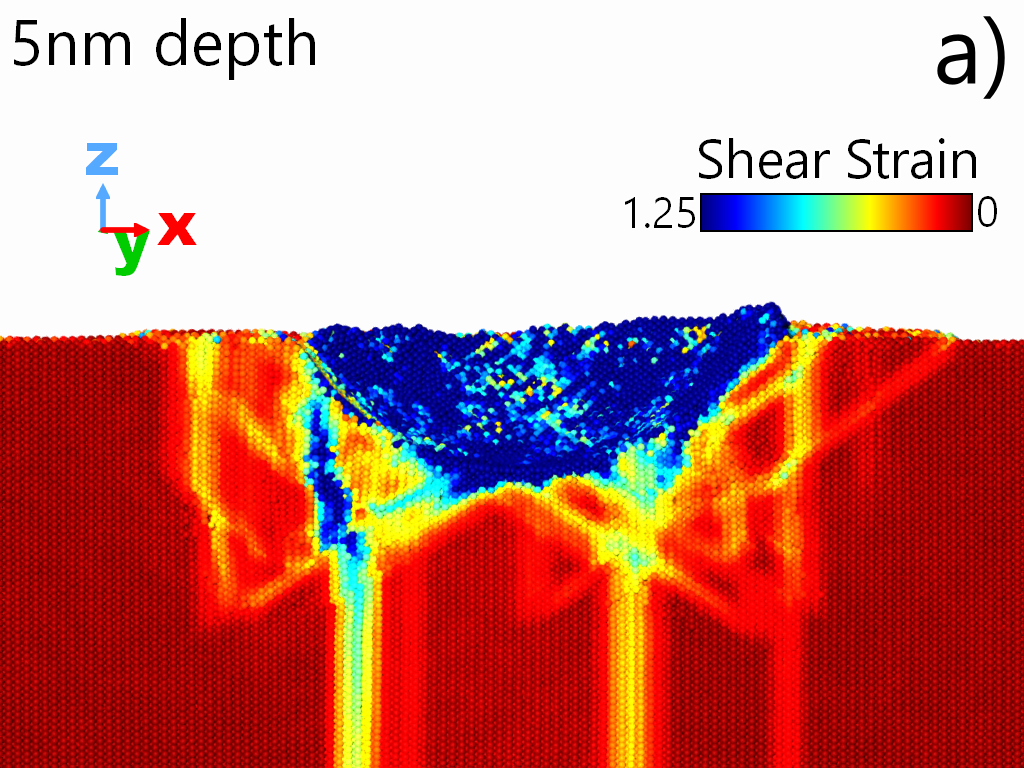
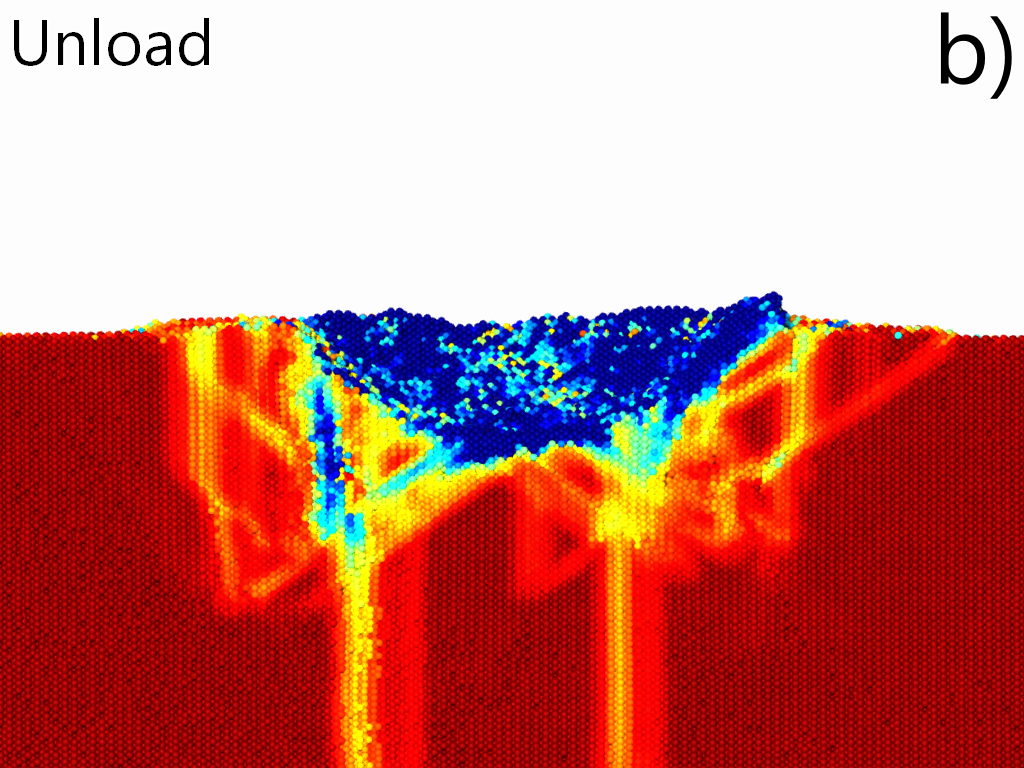
We have also noted that GNDs created in the volume deformed by the indentation are directly related to lattice distortion which suggests that the production of GNDs has a considerably key role on strength of stainless steel. In addition, increasing atomic level disorder can lead to reduction in mean free paths of dislocation and a significant impact on evolution of defect formation, where the presence of multi-elements makes slip paths of dislocations differently shaped than for single element metals Domínguez-Gutiérrez et al. (2021). We have also noted that the first pop-in event identified in the nanoindentation tests (Fig 4) demonstrate the onset of microplasticity and the nucleation of the first dislocations but the second pop-in event during the loading process is connected with the drop of the hardness. Atomic shear strain for SS samples at [001] orientation, are shown in Fig 12. The sample is slid to the half in the {111} slip plane to visualize the atomic distribution of the shear strain by coloring Fe, Ni, and Cr atoms according to their values; results for the plastic region are presented for the maximum indentation depth and after unloading process. We notice the correspondence between the GNDs nucleated into the plastic region and the slip trace formation, where the shear strain has values of 0.1; besides that, the maximum values are observed underneath the indenter tip at the maximum depth and by the in-print mark after unloading process.
IV Concluding Remarks
In this work, we present a joint experimental and atomistic based computational study of nanoindentation mechanisms of 310S stainless steel. We numerically model the dislocation nucleation and evolution in different crystal orientations where trend in hardness and young’s modulus data between experiments and simulations reached an excellent agreement. We discuss the decrease of hardness at indentation depths close to the surface due to the lattice mismatching of the material and its elastic-plastic deformation transition where the formation of dislocation loops affects the material mechanical properties. Thus, we characterized the nanoindentation process in connection to experimental findings, and through tracking dislocation dynamics and densities at different indentation depths where prismatic dislocation loops are nucleated and mainly formed by Shockley type dislocations; regardless the particular grain orientation and its chemical disorder.
Several new elements can be summarized: 1) The analysis of the nanoscale anisotropic elastic–plastic behavior of SS using nanoindentation, as well as pile-up patterns and atomic strains distribution using molecular dynamics (MD) simulations; 2) The elucidation of atomistic mechanisms of dislocation nucleation and defects evolution by suitable nano-indentation tests in SS by comparison to equiatomic Ni-Fe solid solutions under identical conditions Kurpaska et al. (2022); 3) The verification of the connection between geometrically necessary dislocations (GND) and size effects based on dislocation dynamics and associated continuum modeling. From our results, we can argue that low-carbon austenitic stainless steel 310S indicates anisotropic properties and the insights into lattice defect dynamics may provide a basis for understanding the physical mechanisms associated with its deformation making it a good candidate for applications in nuclear power plants and extreme operating environments. Our work is also aimed to inspire the design of more advanced chemically complex functional materials and understand their mechanical properties at operating conditions of future advanced nuclear reactors.
Acknowledgments
We acknowledge support from the European Union Horizon 2020 research and innovation program under grant agreement no. 857470 and from the European Regional Development Fund via the Foundation for Polish Science International Research Agenda PLUS program grant No. MAB PLUS/2018/8 (R.A.D.,L.K.,S.P., and M.A.). This work has been partially supported by the National Science Centre through the Grant No UMO-2020/38/E/ST8/00453 (F.J.D.G.,K.M., A.U.). We acknowledge the computational resources provided by the High Performance Cluster at the National Centre for Nuclear Research in Poland, as well as the support of the Interdisciplinary Centre for Mathematical and Computational Modelling (ICM) University of Warsaw under computational allocation no g88-1181.
References
- Lo et al. (2009) K. Lo, C. Shek, and J. Lai, Materials Science and Engineering: R: Reports 65, 39 (2009).
- Chen et al. (2017) T. Chen, L. Tan, Z. Lu, and H. Xu, Acta Materialia 138, 83 (2017).
- Wen et al. (2017) D. Wen, B. Jiang, Q. Wang, F. Yu, X. Li, R. Tang, R. Zhang, G. Chen, and C. Dong, Materials & Design 128, 34 (2017).
- Isakov et al. (2016) M. Isakov, M. May, S. Hiermaier, and V.-T. Kuokkala, Materials & Design 106, 258 (2016).
- Zhang et al. (2019) X. Zhang, D. Li, Y. Li, and S. Lu, Materials Science and Engineering: A 743, 648 (2019).
- Szuwalski and Ustrzycka (2012) K. Szuwalski and A. Ustrzycka, International Journal of Non-Linear Mechanics 826, 141912 (2012).
- Szuwalski and Ustrzycka (2013) K. Szuwalski and A. Ustrzycka, European Journal of Mechanics A-Solids 27, 79 (2013).
- Liu et al. (1997) Z. Liu, Y. He, and W. Gao, J. of Materi Eng and Perform 7, 88 (1997).
- Xia et al. (2019) W. Xia, G. Dehm, and S. Brinckmann, Materials & Design 183, 108169 (2019).
- Schuh (2006) C. A. Schuh, Materials Today 9, 32 (2006).
- Nix and Gao (1998) W. Nix and H. Gao, Journal of the Mechanics and Physics of Solids 46, 411 (1998).
- Oliver and Pharr (1992) W. Oliver and G. Pharr, Journal of Materials Research 7, 1564–1583 (1992).
- Mattucci et al. (2021) M. Mattucci, I. Cherubin, P. Changizian, T. Skippon, and M. Daymond, Acta Materialia 207, 116702 (2021).
- Cui et al. (2020) L. Cui, S. Jiang, J. Xu, R. L. Peng, R. T. Mousavian, and J. Moverare, Materials & Design 198, 109385 (2020).
- Zhang et al. (2004) T.-Y. Zhang, W.-H. Xu, and M.-H. Zhao, Acta Materialia 52, 57 (2004).
- Zhang et al. (2006) F. Zhang, Y. Huang, and K.-C. Hwang, Acta Materialia 22, 1 (2006).
- Rodriguez and Gutierrez (2003) R. Rodriguez and I. Gutierrez, Materials Science and Engineering A 361, 377 (2003).
- Tabor (1956) D. Tabor, British Journal of Applied Physics 7, 159 (1956).
- Voyiadjis and Yaghoobi (2017) G. Z. Voyiadjis and M. Yaghoobi, Crystals 7, 321 (2017).
- Yaghoobi and Voyiadjis (2014) M. Yaghoobi and G. Z. Voyiadjis, Computational Materials Science 95, 626 (2014).
- Mayo et al. (1990) M. J. Mayo, R. W. Siegel, A. Narayanasamy, and W. Nix, Journal of Materials Research 5, 107 (1990).
- Sato et al. (2020) Y. Sato, S. Shinzato, T. Ohmura, T. Hatano, and S. Ogata, Nature Communications 11, 4177 (2020).
- Domínguez-Gutiérrez et al. (2021) F. Domínguez-Gutiérrez, S. Papanikolaou, A. Esfandiarpour, P. Sobkowicza, and M. Alava, Materials Science and Engineering: A 826, 141912 (2021).
- Kurpaska et al. (2022) L. Kurpaska, F. Dominguez-Gutierrez, Y. Zhang, K. Mulewska, H. Bei, W. Weber, A. Kosińska, W. Chrominski, I. Jozwik, R. Alvarez-Donado, S. Papanikolaou, J. Jagielski, and M. Alava, Materials & Design 217, 110639 (2022).
- Varillas et al. (2017) J. Varillas, J. Ocenasek, J. Torner, and J. Alcala, Acta Materialia 125, 431 (2017).
- Musiał et al. (2022) S. Musiał, M. Maj, L. Urbański, and M. Nowak, International Journal of Solids and Structures 238, 111411 (2022).
- Thompson et al. (2022) A. P. Thompson, H. M. Aktulga, R. Berger, D. S. Bolintineanu, W. M. Brown, P. S. Crozier, P. J. in ’t Veld, A. Kohlmeyer, S. G. Moore, T. D. Nguyen, R. Shan, M. J. Stevens, J. Tranchida, C. Trott, and S. J. Plimpton, Computer Physics Communications 271, 108171 (2022).
- Bonny et al. (2013) G. Bonny, N. Castin, and D. Terentyev, Modelling and Simulation in Materials Science and Engineering 21, 085004 (2013).
- Choi et al. (2018) W. M. Choi, Y. Jo, S. Sohn, et al., npj Comput Mater 4, 1 (2018).
- Bei et al. (2005) H. Bei, E. P. George, J. L. Hay, and G. M. Pharr, Phys. Rev. Lett. 95, 045501 (2005).
- Oliver and Pharr (2004) W. Oliver and G. Pharr, Journal of Materials Research 19, 3 (2004).
- Shimizu et al. (2007) F. Shimizu, S. Ogata, and J. Li, Materials Transactions 48, 2923 (2007).
- Stukowski (2010) A. Stukowski, Modelling and simulation in materials science and engineering 18 (2010), 10.1088/0965-0393/18/1/015012.
- Stukowski et al. (2012) A. Stukowski, V. V. Bulatov, and A. Arsenlis, Modelling and Simulation in Materials Science and Engineering 20, 085007 (2012).
- Pathak and Kalidindi (2015) S. Pathak and S. R. Kalidindi, Materials Science and Engineering: R: Reports 91, 1 (2015).
- Kocks and Mecking (2003) U. Kocks and H. Mecking, Progress in Materials Science 48, 171 (2003).
- Tsuchida et al. (2001) N. Tsuchida, Y. Tomota, H. Moriya, O. Umezawa, and K.Nagai, Acta Materialia 49, 3029 (2001).
- Bouaziz (2012) O. Bouaziz, Advanced Engineering Materials 14, 759 (2012).
- Xu et al. (2021) R.-G. Xu, H. Song, Y. Leng, and S. Papanikolaou, Materials 14 (2021), 10.3390/ma14185220.
- Papanikolaou et al. (2017) S. Papanikolaou, Y. Cui, and N. Ghoniem, Modelling and Simulation in Materials Science and Engineering 26, 013001 (2017).
- Morris et al. (2011) J. R. Morris, H. Bei, G. M. Pharr, and E. P. George, Phys. Rev. Lett. 106, 165502 (2011).
- Li et al. (2019) Q.-J. Li, H. Sheng, and E. Ma, Nature communications 10, 1 (2019).
- Yilmaz et al. (2020) H. Yilmaz, C. J. Williams, and B. Derby, Materials Science and Engineering A 793, 139883 (2020).
- Ustrzycka et al. (2020) A. Ustrzycka, B. Skoczen, M. Nowak, L. Kurpaska, E. Wyszkowska, and J. Jagielski, International Journal of Damage Mechanics 29, 1271 (2020).
- Ruiz-Moreno and Hähner (2018) A. Ruiz-Moreno and P. Hähner, Materials & Design 145, 168 (2018).
- Ashby (1970) M. Ashby, The Philosophical Magazine: A Journal of Theoretical Experimental and Applied Physics 21, 399–424 (1970).
- Ma and Clarke (1995) Q. Ma and D. Clarke, Journal of Materials Research 10, 853–863 (1995).