Measuring the coefficient of moisture expansion of Hysol 9396 loaded with boron nitride powder
Abstract
The future ATLAS ITk strip tracker [1] will consist of 17,000 silicon strip detector modules mounted on support structures called cores. Cores are assembled from a number of components, among others carbon fibre facings, honeycomb structure and carbon foam surrounding titanium tubes used for cooling, using a two-component epoxy (Hysol 9396) loaded with boron nitride for good thermal conductivity. The adhesive constitutes about 20 % of a core’s weight.
During operation, the detector is cooled down to -40 ∘C using bi-phase carbon dioxide and flushed with dry gas to prevent condensation. The effect of this temperature change has been simulated to study the impact of Coefficient of Thermal Expansion (CTE) mismatches between different materials and investigate resulting deformations and misalignment.
In addition to the shrinking of an adhesive during cooling, which can be estimated well using its known CTE, flushing the detector volume with dry gas removes the moisture contained in the adhesive, leading to an additional shrinking. In order to estimate the impact of shrinking during drying, the Coefficient of Moisture Expansion (CME) of Hysol samples with different contents of boron nitride as well as their overall moisture absorption were measured and their extent compared to the contraction associated with cooling.
1 Introduction
The ITk strip tracker [1] for the ATLAS [2] detector will be comprised of silicon strip sensor modules which are glued directly onto carbon fibre support structures, which provide mechanical support and cooling through embedded titanium pipes. Support structures are assembled from carbon fibre face sheets with co-cured bus tapes, closeouts, carbon fibre honeycomb structures and titanium pipes embedded in carbon foam. The parts are connected using Hysol 9396, a two-component epoxy, filled with boron nitride powder for thermal conductivity, which makes up about 20 % of the support structure (by weight).
Extensive studies have been performed to study the thermal behaviour of the assembled support structure and simulate its behaviour after cooling: during operation, support structures will be cooled down from room temperature to -40 ∘C, i.e. by about -60 ∘C, resulting in deformations due to CTE mismatches of the involved components.
During operation, the detector is additionally going to be flushed with dry gas to prevent humidity condensation within the detector volume. Adhesives are known to expand or contract with increasing/decreasing humidity content, however the exact coefficient of moisture expansion (CME) for the adhesive in use was unknown.
Measurements were therefore conducted to investigate the CME of Hysol 9396 with boron nitride filling as planned to be used in the ATLAS strip tracker.
2 Samples under investigation
All samples under investigation were prepared using Hysol 9396, an epoxy adhesive mixed from two components in a ratio of 100:30 (resin:hardener). Additionally, in order to study the dependence of the CME on the filling content, samples with different filling percentages of boron nitride powder were prepared.
Samples were prepared by mixing a minimum of 10 g of Hysol 9396 in a glue mixer (using a glue mixer at 2,500 u/min for 2.5 min). Depending on the intended content, a measured amount of boron nitride powder was added and mixed using an automated glue mixer.
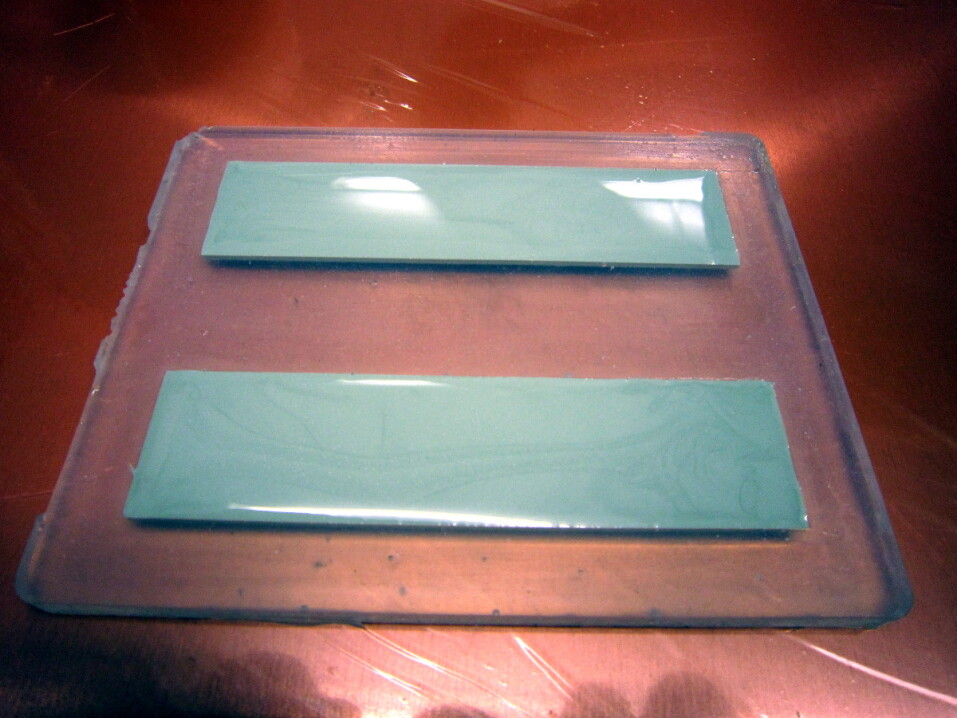
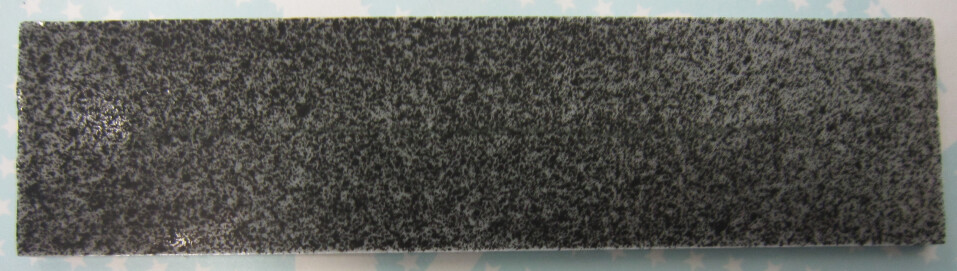
A silicon mold was used to produce pairs of glue samples with defined dimensions of cm2 and thicknesses of 2-3 mm to maximise surface area and, thereby, moisture absorption (see figure 1).
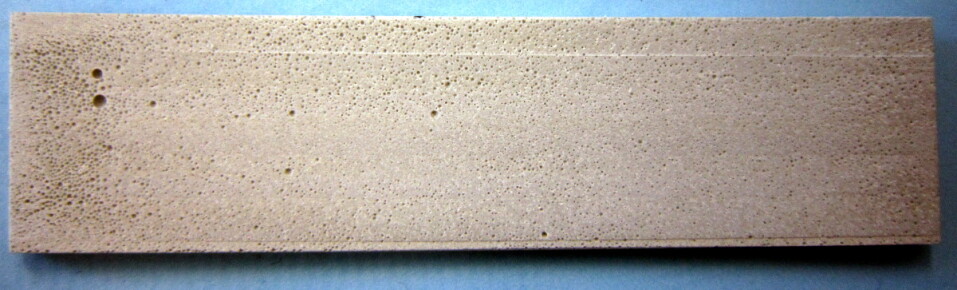
Since adding boron nitride powder introduced air bubbles in the glue mixture, which slowly escaped over time, two different approaches to curing were taken. Samples with 0, 10 and 20 % boron nitride content (by weight) were cured at elevated temperatures (60 ∘C for 1 hour), which led to faster curing and therefore more air being trapped within the sample (see figure 2). All other samples (with 5, 15, 25 and 30 % boron nitride content), were cured at room temperature.
Samples cured at both elevated temperatures and room temperature were found to have uneven surfaces after curing. CME measurements of these samples required measurements of their expansion due to moisture absorption, which were conducted using an image correlation system (see section 4), therefore sample surfaces were milled to provide even surfaces for imaging (see figures 3(a) and 3(b)). For each boron nitride content, one sample was milled down with the top surface up, and one sample was milled with the bottom surface up for comparison.
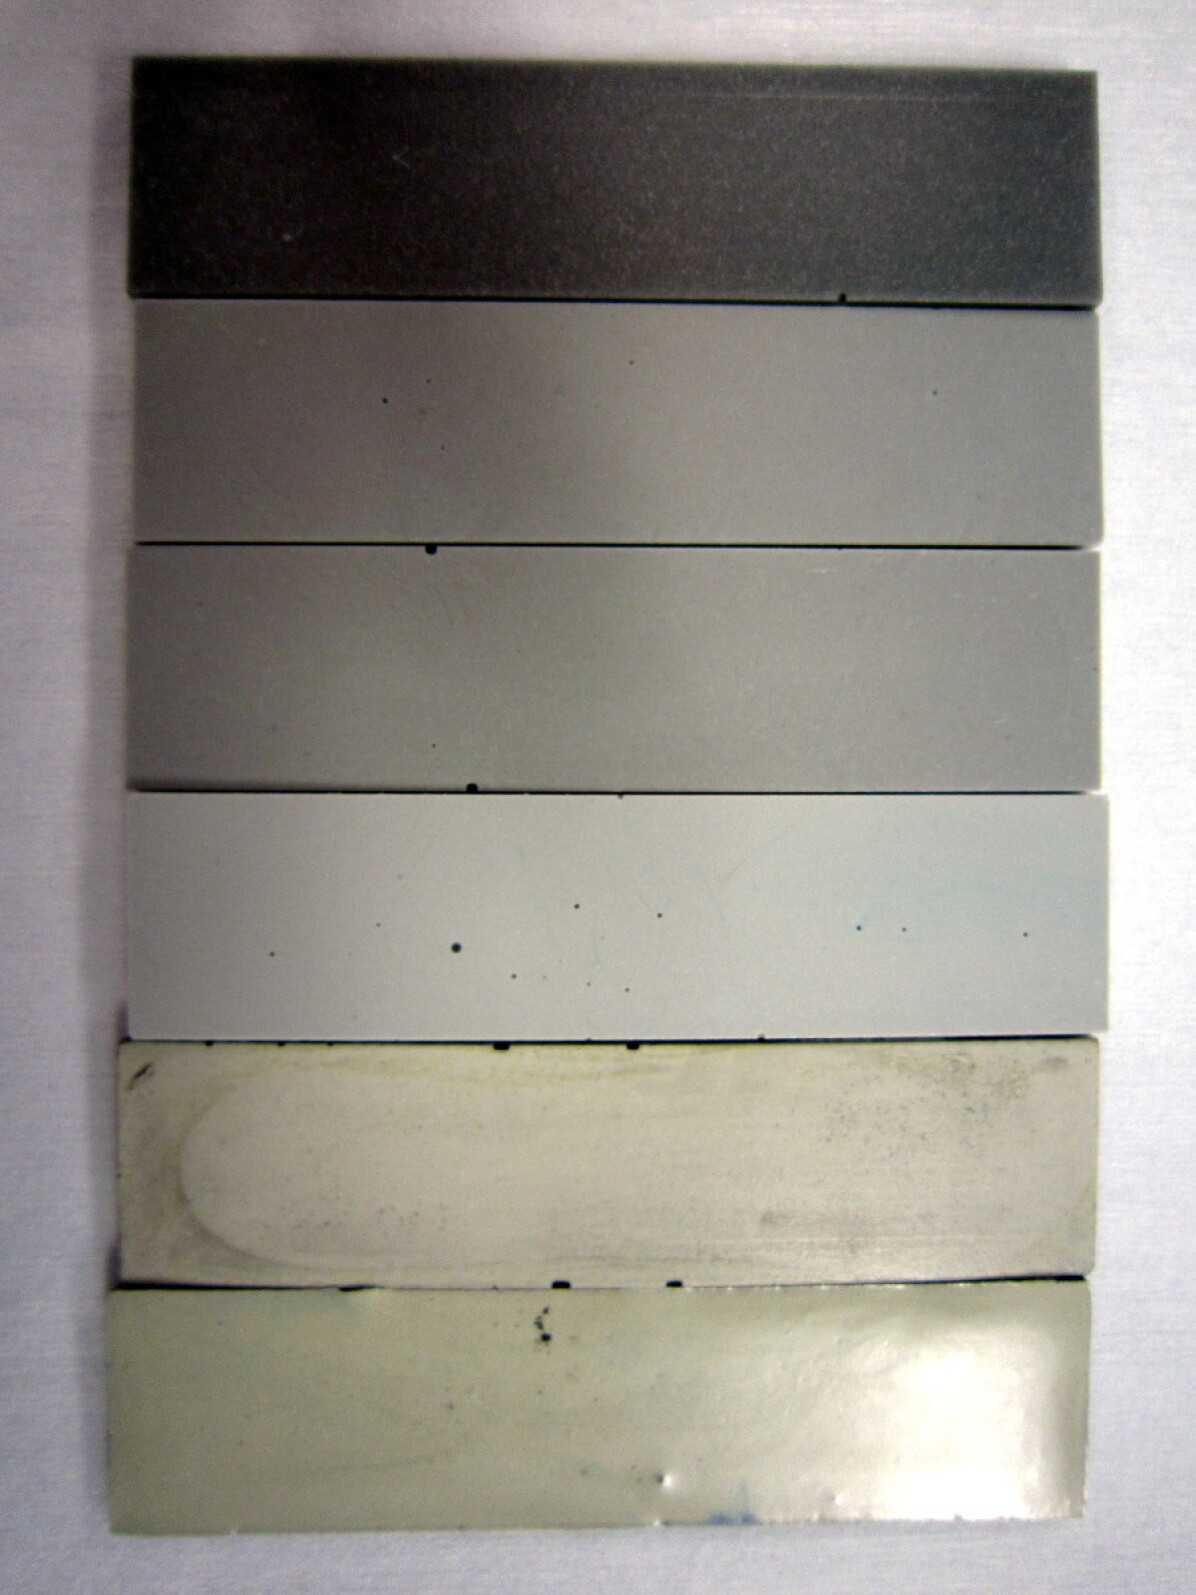
Afterwards, any marks left in samples surfaces by the milling process were sanded down to achieve a smooth sample surface.
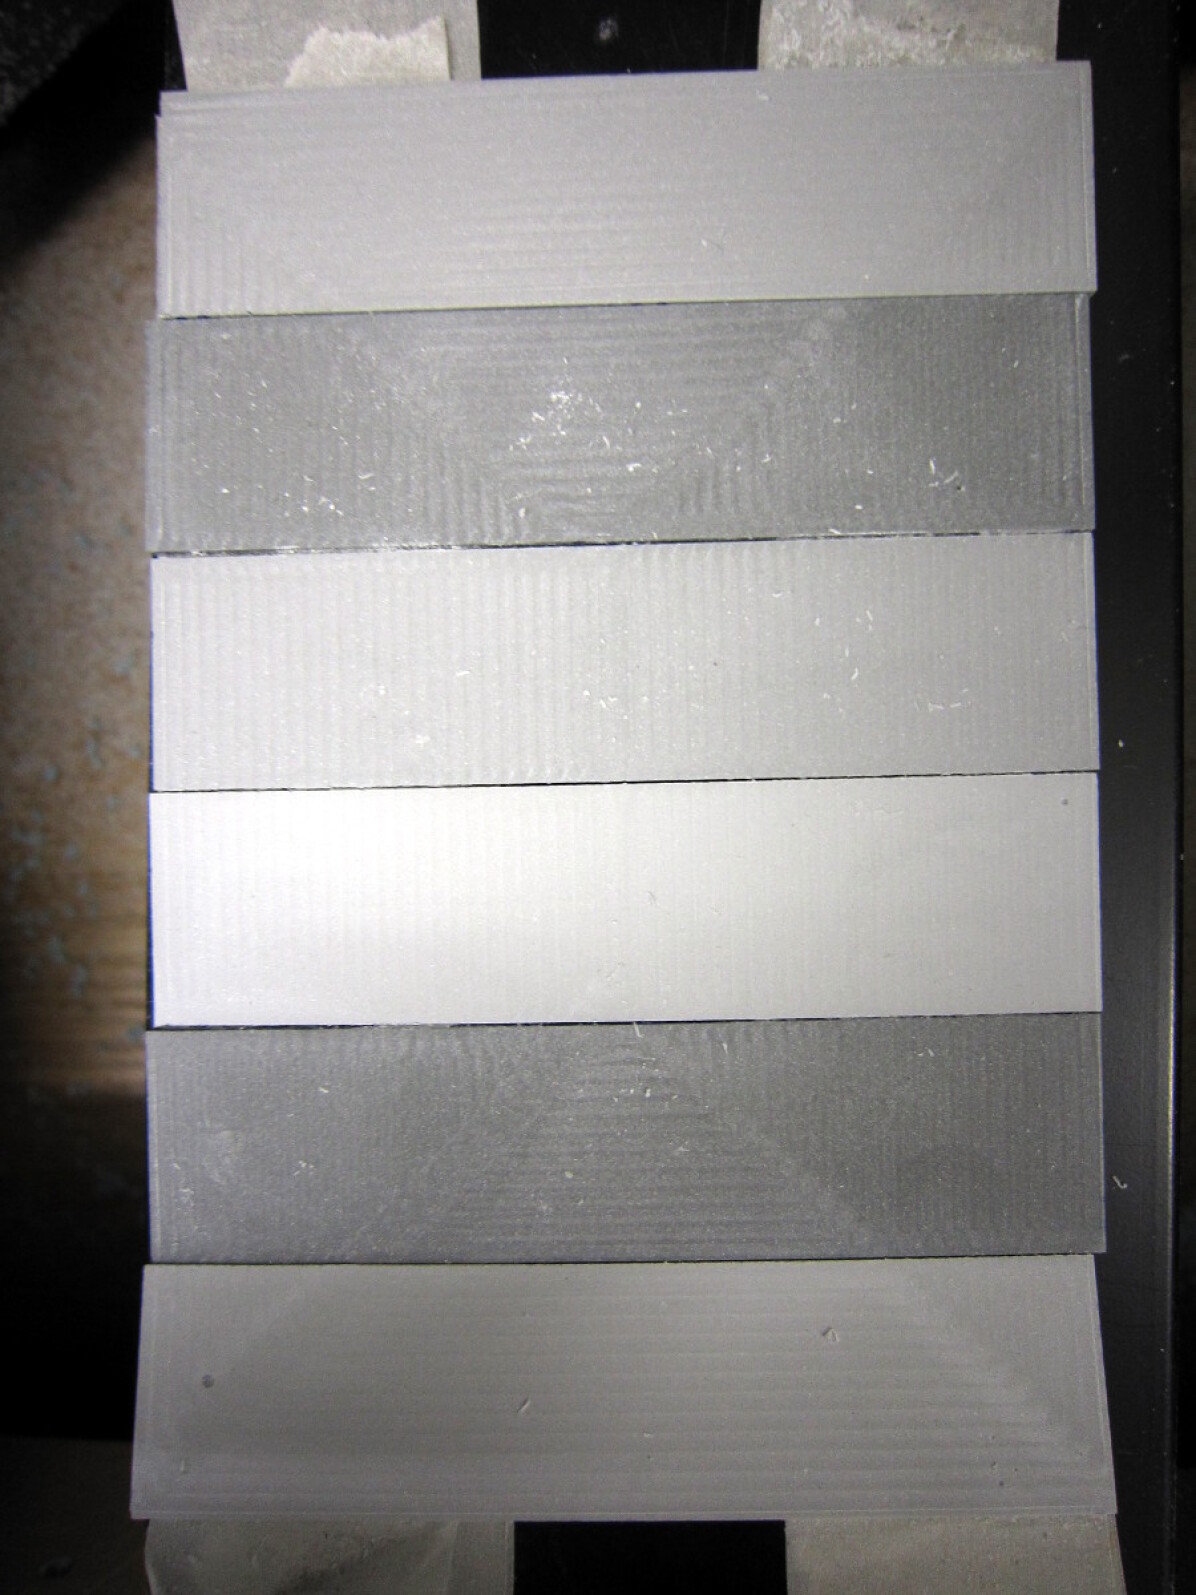
Following these surface treatments, the foreseen use of an image correlation system required the application of a small-scale, high-contrast and random pattern [3], see figure 4. In accordance with good practice recommendations [6], spray paint was used to apply a pattern of small speckles that was
-
•
matt (to minimise reflections)
-
•
resulted in similar numbers of light and dark pixels
-
•
added a layer of material that was thin compared to the overall sample thickness (about 20 m of paint compared to a sample thickness of 2 mm)
3 Moisture absorption
In preparation of CME measurements, all samples were baked out in order to determine their dry weight: all samples were stored in an oven flushed with dry air and baked at a temperature of 30 ∘C. They were weighed daily over a period of up to four weeks (depending on the sample), to find their dry weight (where their weight did not decrease further over a period of several days). The thereby determined dry weight was used for calculations of absorbed water content.
Measurements were performed with fully dried samples, since dry samples absorbed moisture faster and were therefore better suited to study the sample expansion over a larger range of water content.
After performing the measurements, all samples were stored in a closed box next to an open water source in order to quantify the maximum amount of absorbed water (“soaking”). All samples were weighed daily to track their moisture content increase. Figure 5 shows the increase in absorbed moisture for all glue samples over time.
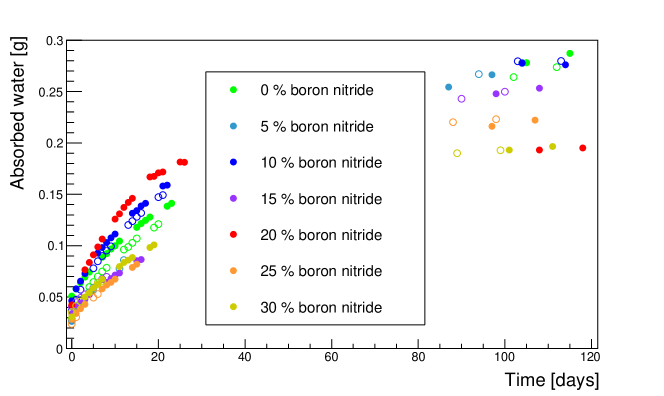
The humidity absorption was found to follow the expected behaviour showing fast absorption initially and slow saturation in the long term [5].
The obtained data was used to calculate the absorbed humidity content at saturation as well as the moisture content the samples had after curing (see table 1).
| Moisture content, % | ||||||
| BN content | Sample | Dry weight | After curing | After soaking | ||
| % | g | -BN | -BN | |||
| 0 | 1 | 3.10 | 0.9 | - | 9.3 | - |
| 0 | 2 | 3.12 | 1.1 | - | 8.8 | - |
| 5 | 1 | 2.87 | 0.8 | 0.9 | 9.3 | 9.8 |
| 5 | 2 | 2.93 | 0.8 | 0.9 | 9.5 | 10.0 |
| 10 | 1 | 2.95 | 0.5 | 0.6 | 9.4 | 10.5 |
| 10 | 2 | 3.00 | 0.6 | 0.6 | 9.3 | 10.3 |
| 15 | 1 | 3.03 | 0.7 | 0.9 | 8.4 | 9.8 |
| 15 | 2 | 3.06 | 0.8 | 0.9 | 8.2 | 9.6 |
| 20 | 1 | 2.22 | 0.6 | 0.7 | 8.8 | 11.0 |
| 20 | 2 | 2.91 | 0.7 | 0.8 | 8.7 | 10.9 |
| 25 | 1 | 3.00 | 0.7 | 0.9 | 7.4 | 9.9 |
| 25 | 2 | 2.98 | 0.7 | 0.9 | 7.5 | 10.0 |
| 30 | 1 | 2.93 | 0.8 | 1.2 | 6.7 | 9.6 |
| 30 | 2 | 2.91 | 0.8 | 1.2 | 6.6 | 9.5 |
Comparing the different glue samples showed that, when correcting for the boron nitride filling content, all samples absorb moisture to a similar degree. After curing, samples had a humidity content of approximately 1 % of their overall glue weight (excluding the boron nitride filling). At saturation, their humidity content was about 10 % of the overall same glue weight. Oven cured samples with boron nitride were found to absorb slightly more moisture (10.3 to 11.0 %) than room temperature cured samples (9.3 to 10.0 %), presumably due to their higher content of entrapped air.
Samples after preparation could therefore be estimated to contain about 10 % of their maximum moisture content at saturation (individual values varied between 6 and 12 %, presumably due to different levels of humidity during sample preparation combined with varying amounts of time between sample preparation and first weighing).
4 Performed measurements
The coefficient of moisture expansion is defined as
| (1) |
where is the relative length change referred to as strain, is the weight of the absorbed water and is the dry weight of the sample.
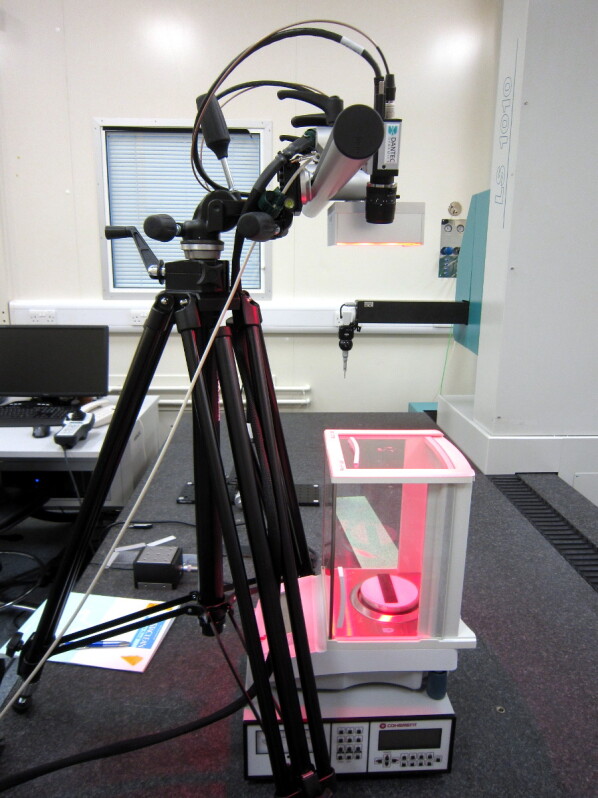
The sample expansion was measured using a DANTEC Dynamics DIC Standard 3D image correlation system, set up according to good practice recommendations for the samples under investigation [6]. Two cameras mounted on a tripod were pointed at a sample under investigation (see figure 6) and images from both cameras were overlayed to compensate for any angular distortion. Since the samples under investigation expanded mainly in-plane with limited strain occurring out-of-plane, the cameras were arranged at a small angle of about 20 ∘ between them. Prior to a measurement, the cameras were warmed up and calibrated under the same lighting conditions as used throughout the measurement.
The associated, commercial software (Istra4D) was used to compare all images to an initial reference picture: at the beginning of each measurement, one reference image was taken. Subsequent images captured after water had been absorbed were compared to the initial reference image, which calculated expansion or contraction with respect to the reference sample based on position changes of the sample speckle pattern.
Since the process of spray painting occasionally led to areas with higher or lower concentrations of speckles (see figure 4), the uniformity of the reconstructed strain was verified as part of each measurement: in addition to calculating the strain over the full sample surface, smaller sample areas were selected for a comparative reconstruction. If the strain reconstructed in a given area deviated too much from the strain determined using the full sample area, the sample’s speckle pattern was removed and re-applied.
Calculating the occuring expansion from an image with respect to the original reference image required the sample under investigation to remain in the same position. Therefore, samples were placed on scales during the measurement (determining the sample weight down to ), see figure 6, with the full sample within the field of view of both cameras for the entire measurement. Samples were placed on a thin sheet of paper to provide the recommended neutral, high-contrast background. The measurement was set up in a cleanroom environment for stable temperature and humidity both to prevent environmental changes from affecting the measured strain and to avoid surface contaminations from impacting the imaging process.
A measurement was conducted by placing each dried out sample on the scales next to an open water container and monitoring the total sample weight. Every time the sample weight had increased by 0.4-0.5 mg, the image system was triggered and five images of the sample were taken through the opened roof of the scales. In order to maintain alignment with the original sample orientation, the sample was not moved throughout the measurement: the scales’ top closure was opened for image recording and closed again for a better weight measurement accuracy. For each sample, the humidity increase was monitored over the course of several hours to include at least 10 mg of absorbed water.
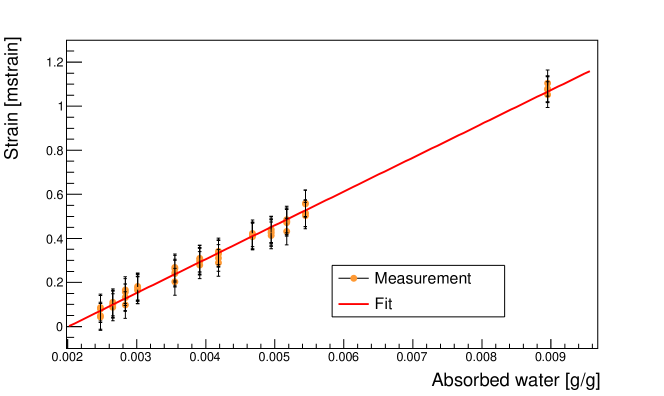
In order to calculate the overall CME, the measured strain was related to the absorbed moisture content (calculated from the measured weight divided by the dry mass of the glue sample) and a linear fit function applied (see figure 7).
5 Results
The determined CME for all samples under investigation are shown in Figure 8.
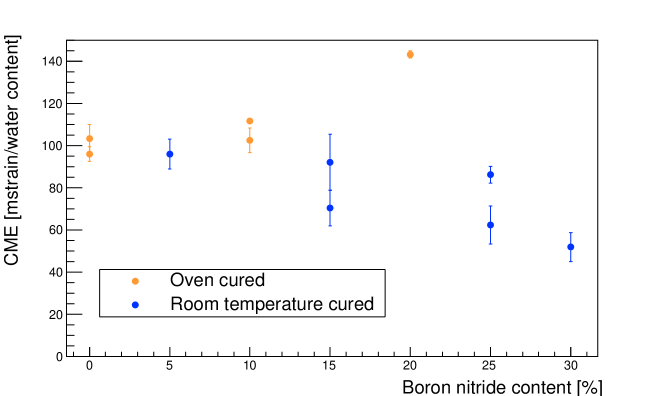
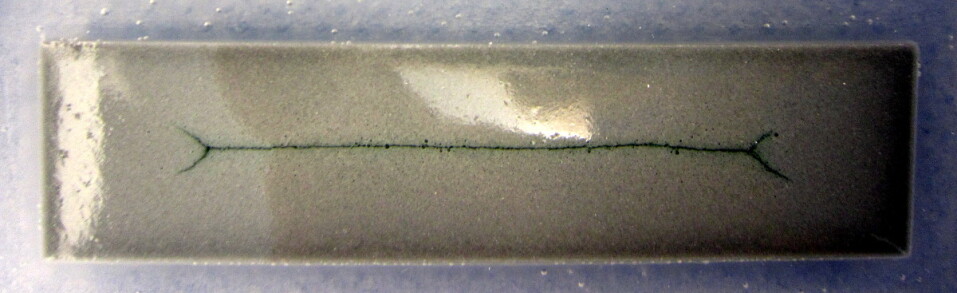
For samples cured at room temperature, a higher boron nitride content resulted in a lower CME as expected. For oven cured samples loaded with boron nitride, the high air content (see figure 2) led to an overall higher CME. Additionally, room temperature cured samples were found to show a larger discrepancy between samples with the same boron nitride content depending on which side had been milled off. This effect matches an observation made for room temperature cured samples, where in the process of curing, air moving through the glue volume led to a movement of the mixed glue, which caused separation of adhesive and boron nitride filling (see figure 9). As a result, different regions of the glue sample can be assumed to have different compositions, which result in larger discrepancies than for oven cured samples, where the shorter curing time prevented a similar extent of separation.
The CME of Hysol 9396 with boron nitride powder filling was measured for filling percentages between 0 and 30 %. It was found to range from 50 to 100 mstrain/(g/g) for room temperature cured samples and to reach up to 140 mstrain/(g/g) for an oven cured sample with high boron nitride content (20 %) that had not been de-gassed after mixing and served as a worst case example.
In order to compare the measured CME with the known CTE of the adhesive under investigation (see table 2), the following assumptions were made:
- •
-
•
during operation in the ATLAS detector, the adhesive would experience a temperature drop of -60 ∘C (from assembly at room temperature to an operating temperature at -40 ∘C [1])
-
•
the CTE of glue samples with boron nitride filling is approximately the CTE of the adhesive multiplied by the adhesive content, since the CTE of boron nitride is negligible compared to the CTE of Hysol 9396 [8]
The CTE for Hysol 9396 was obtained from the datasheet: 70.7 m/m/∘C [9].
| CME | Strain | CTE | Strain | |
|---|---|---|---|---|
| Sample | measured | from 1 % MC | calculated | from -60 ∘C |
| mstrain/(g/g) | mstrain | strain/∘C | mstrain | |
| 0 % I | 71 | 4.24 | ||
| 0 % II | 71 | 4.24 | ||
| 5 % I | 67 | 4.03 | ||
| 10 % I | 64 | 3.82 | ||
| 10 % II | 64 | 3.82 | ||
| 15 % I | 60 | 3.61 | ||
| 15 % II | 60 | 3.61 | ||
| 20 % I | 57 | 3.39 | ||
| 25 % I | 53 | 3.18 | ||
| 25 % II | 53 | 3.18 | ||
| 30 % I | 49 | 2.97 |
6 Conclusion
Measurements were performed to study the moisture absorption of Hysol 9396 samples with different filling percentages of boron nitride powder. It was found that all samples absorbed approximately 10 % of their adhesive weight in moisture until saturation. Samples had absorbed approximately 1 % of their adhesive weight in moisture after curing, independent of the filler content.
In the absence of degassing, the addition of boron nitride powder to a Hysol mix was found to impact the glue homogeneity: oven cured samples showed a high number of air bubbles trapped inside the glue volume during the curing process. Samples with a comparable filler content cured at room temperature showed a lower air content, but the movement of air escaping from the sample during curing was found to lead to a larger degree of filler separation and an inhomogeneous filler distribution in the sample.
The CME of all samples under investigation was measured by simultaneously monitoring the gained weight from moisture absorption and the corresponding strain with an image correlation system. The determined CME values varied between 50 and 140 mstrain/(g/g), depending on boron nitride content and curing method.
A comparison of the hygrometric strain corresponding to samples with 1 % moisture content drying and the thermoelastic strain accompanying a cooling by 60 ∘C was performed. The strain associated with drying was found to be smaller but reaching up to 30 % of the strain associated with cooling. Accordingly, glue samples with a moisture content of more than 1 % would lead to larger strains occurring during drying.
The measurements therefore confirmed that for an accurate description of the strains developing in ITk support structures during operation, the CME of the used adhesives should be included in addition to its CTE.
Acknowledgments
The work presented here was partially funded by the Canada Foundation for Innovation (CFI) and the Natural Sciences and Engineering Research Council (NSERC) of Canada.
References
- [1] ATLAS Collaboration. Technical Design Report for the ATLAS Inner Tracker Strip Detector. Technical Report CERN-LHCC-2017-005. ATLAS-TDR-025, CERN, Geneva, Apr 2017.
- [2] The ATLAS Collaboration. The ATLAS Experiment at the CERN Large Hadron Collider. Journal of Instrumentation, 3(08):S08003, 2008.
- [3] M. Jerabek, Z. Major, and R.W. Lang. Strain determination of polymeric materials using digital image correlation. Polymer Testing, 29(3):407 – 416, 2010.
- [4] Raed Ayoob, Fuad N Alhabill, Thomas Andritsch, and Alun S Vaughan. The effect of water absorption on the dielectric properties of polyethylene hexagonal boron nitride nanocomposites. Journal of Physics D: Applied Physics, 51(6):065307, Jan 2018.
- [5] E. Pérez-Pacheco, J. I. Cauich-Cupul, A. Valadez-González, and P. J. Herrera-Franco. Effect of moisture absorption on the mechanical behavior of carbon fiber/epoxy matrix composites. Journal of Materials Science, 48:1873–1882, Mar 2013).
- [6] E.M.C. Jones and M.A. Iadicola. A Good Practices Guide for Digital Image Correlation. International Digital Image Correlation Society, 2018.
- [7] I. Antcheva et al. ROOT — A C++ framework for petabyte data storage, statistical analysis and visualization. Computer Physics Communications, 182(6):1384 – 1385, 2011.
- [8] Burcu Ertug. Powder Preparation, Properties and Industrial Applications of Hexagonal Boron Nitride. In Burcu Ertug, editor, Sintering Applications, chapter 2. IntechOpen, Rijeka, 2013.
- [9] Henkel Corporation. Hysol EA 9396 - Technical Datasheet.