The Belle Collaboration
Measurement of the mass and width
of the charmed baryon and the branching ratios of
and
Abstract
Using the entire data sample of collected at or near the resonance with the Belle detector operating at the KEKB asymmetric-energy collider , we report the measurement of the mass, width, and the branching ratios of the charmed baryon. The mass difference between and is measured to be . The upper limit on the width is measured to be at 90% confidence level. Based on a full Dalitz plot fit, branching ratios with respect to the mode are measured to be and , where the first and second uncertainties are statistical and systematic, respectively. These measurements can be used to further constrain the parameters of the underlying theoretical models.
I Introduction
The charmed baryons consist of a heavy charm quark and two light () quarks with the ground state having quantum numbers . The and are the two lowest-lying excited states observed, and are generally believed to have and , respectively. The predominantly decays to the states via an -wave decay. The analogous decay for the to the states is kinematically suppressed as it can only happen through the low-mass tail of the . The -wave decay to the states is allowed, but its contribution is known to be small. Thus, the decay is thought to proceed primarily via the direct three-body, -wave decay .
The was first observed in 1993 [1]. The CDF collaboration reported the most recent measurements of properties in 2011 using a data sample of 6.2k events [2]. Their measurement for the mass with respect to the mass is much more precise compared with previous measurements, and an upper limit on the width was reported. The limited decay phase space of makes it difficult to extract the yields by fitting the invariant mass due to the presence of reflection peaks formed by the combination of the and the other final state pion. The large data sample collected by Belle, together with the use of an amplitude model [3] to describe the decay, allows us to use a full Dalitz fit that naturally includes the reflections.
The mass of the , relative to the mass, is already relatively well known, but the large Belle data sample allows for a more precise measurement. No intrinsic width of the has yet been measured, and the current upper limit at 90% confidence level by the Particle Data Group (PDG) [4] is based on the CDF measurement.
II Detector and dataset
The measurement presented here is based on the entire dataset collected by the Belle detector [9, 10] operating at the KEKB asymmetric-energy collider [11, 12]. The total integrated luminosity of the dataset is , which is mostly collected at or near the resonance.
The Belle detector is a large-solid-angle magnetic spectrometer that consists of a silicon vertex detector (SVD), a 50-layer central drift chamber (CDC), an array of aerogel threshold Cherenkov counters (ACC), a barrel-like arrangement of time-of-flight scintillation counters (TOF), and an electromagnetic calorimeter composed of CsI(Tl) crystals (ECL) located inside a super-conducting solenoid coil that provides a 1.5 T magnetic field. An iron flux-return located outside of the coil is instrumented to detect mesons and to identify muons (KLM). The detector is described in detail elsewhere [9]. Two inner detector configurations were used. The first consisted of a 2.0 cm radius beampipe and a 3-layer silicon vertex detector, while the second used a 1.5 cm radius beampipe, a 4-layer silicon detector and a small-cell inner drift chamber.
Monte Carlo (MC) events are generated using EVTGEN [13] to optimize selection criteria and to be used in the Dalitz plot fit. The and samples are generated using a phase space model [14]. A , with , sample is also generated to compare the mass-resolution function in the MC sample and the experimental data, and thus to estimate the systematic uncertainties on the measurements. The detector response is simulated with GEANT3 [15] and the event reconstruction is performed using data converted with the Belle-to-Belle-II (B2BII) software package [16] and then analyzed using Belle II software [17, 18].
III Analysis
The candidate baryons are reconstructed from the decay chain , . The final-state charged particles, , and , are selected based on the likelihood information from the tracking (SVD, CDC) and particle identification (CDC, ACC, TOF) systems into a combined likelihood, , where and are , or [19]. We require the proton candidates to have and , kaon candidates to have and , and pion candidates to have and . Electrons are suppressed by requiring for all candidates; the likelihoods and include information from the ECL in addition to the tracking and particle identification systems [19]. The particle identification efficiency is approximately 87% for protons, 85% for kaons and 96% for pions. Charged tracks are also required to have a point of closest approach with respect to the interaction point less than 3 cm in the beam direction and less than 1 cm in the plane perpendicular to it.
A vertex fit is applied to the daughter particles of the candidates and the resultant probability of the fit is required to be greater than 0.001. Candidates within are selected and mass-constrained to the PDG mass of [4]. Two pions of opposite charge are then combined with the constrained candidate to form a candidate. The daughters are then kinematically fitted to come from a common vertex, with a constraint that the vertex has to be within the beamspot since the is short-lived. The probability of this fit is required to be greater than 0.001 to ensure the quality of the fit. As excited charmed baryons including the typically have a hard momentum distribution, we only keep candidates with , where and is momentum of the in the center of mass frame. As the mass of the is constrained to its PDG value, the reconstructed mass has the resolution of the mass difference .
Correctly calibrating the momentum scale for low momentum pions is critical for this analysis. We calibrate the momentum scale using copious events in the experimental data. Low-momentum tracks are iteratively calibrated as a function of the polar angle and momentum of each track in the laboratory frame by comparing the reconstructed and world-average mass of the meson as a function of the momentum. This correction has been used in a previous study using Belle data [20]. Since the mass-resolution function is crucial for the precise measurement of the mass and width, the MC tracks are smeared using the analysis software during reconstruction, as otherwise the MC mass resolution is known to be better than that of the experimental data. This track smearing affects the width of the mass-resolution function but not its central value. The mass-resolution function of the mass is parameterized as a sum of two Gaussian functions with parameters fixed according to a signal MC sample with both corrections as detailed above.
The consistency between the MC sample and the experimental data is checked by comparing the mass resolution of events, which have similar kinematics to the events under study. The low-momentum track correction ensures that the measured mass in data and MC are independent of the momentum of the soft pion [20]. The resolution of the mass relative to the mass in the experimental data is found by fitting the mass distribution in the experimental data with a Breit-Wigner distribution convolved with a double-Gaussian mass-resolution function, where the width of the Breit-Wigner is fixed to the PDG value of [4]. In this study, without track smearing, the mass resolution in the experimental data is measured to be 114% of the value obtained from the MC sample. However, with track smearing, the mass resolution in the experimental data is measured to be 86% of the value obtained from the MC sample. In all other narrow signals studied, for instance the , the track smearing ensures that the MC and data agree reasonably. The track smearing has negligible effect on the mass measurement. The results of these consistency checks are used in the estimation of the systematic uncertainties described below.
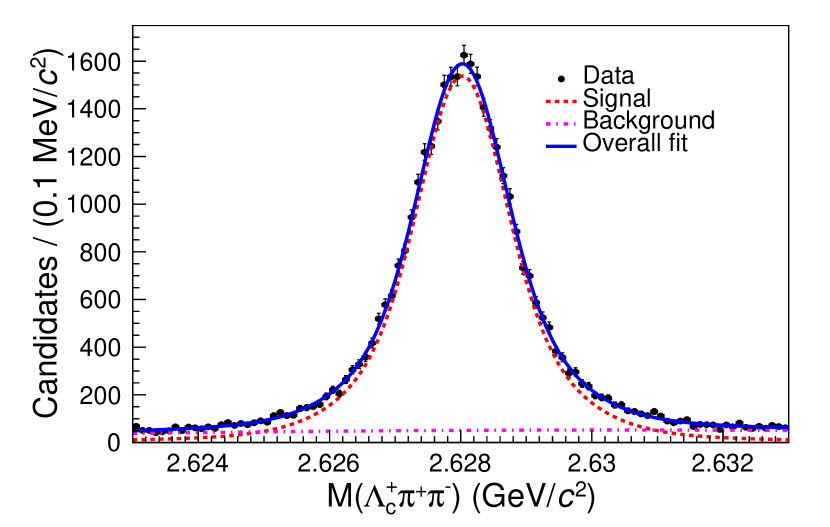
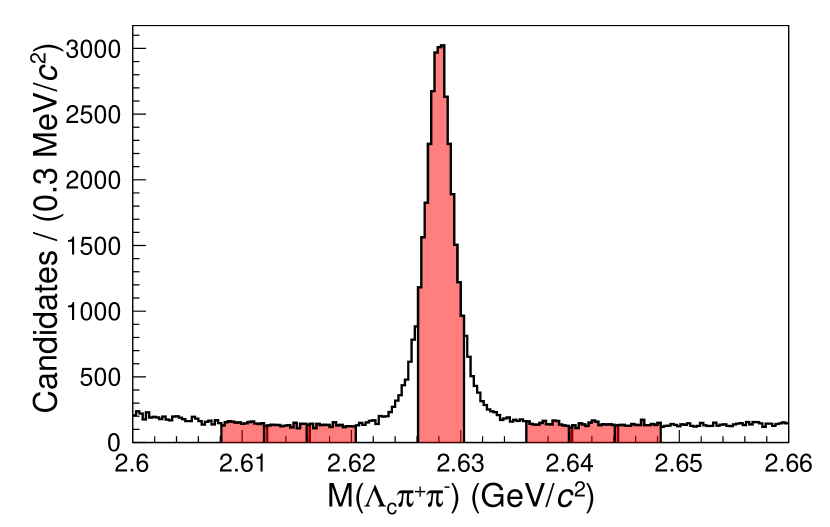
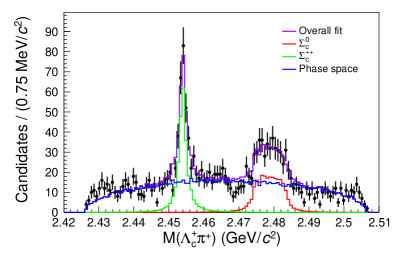
The reconstructed mass distribution in the experimental data is fitted using RooFit [21]. Figure 1 shows the mass distribution in the experimental data overlaid with the fit result. The signal function is a Breit-Wigner distribution convolved with a double-Gaussian mass-resolution function, and the background function is a second-order Chebychev polynomial. The resolution function for the invariant mass distribution is obtained from the MC sample, without track smearing, and scaled by 114% in accordance with the study. The solid line shows the overall fit and the dashed lines show the individual signal and background components of the fit. The fitted mass is , independent of which version of the mass-resolution function we use. The uncertainty is statistical only. If we use the track-smearing correction without any rescaling, the fitted width is found to be zero, so we have no definitive evidence of a non-zero width and will present only an upper limit for the measurement of the intrinsic width of the . If we scale by 114% the mass-resolution function without track smearing, the fitted width is . If we scale by 86% the mass-resolution function with track smearing, the fitted width is . These finite values for the fitted width after scaling the mass resolution are only used to find the limit on the intrinsic width including systematic uncertainties.
The fitted mass of in the signal MC sample is slightly different from the generated value. Applying a bias correction, determined by the mass shift observed in the signal MC sample, the mass of the is measured to be , where the uncertainty is statistical.
Two upper limits on the width are calculated based on the two mass-resolution functions methods described above and the larger upper limit is reported as the final answer. Using the mass-resolution function determined from MC scaled by 114% without track smearing, the upper limit is determined to be
| (1) |
at 90% confidence level by integrating the likelihood function to find the value for which the integral contains 90% of the total area. Using the mass-resolution function scaled by 86% with track smearing would yield a tighter upper limit. Therefore, we conservatively report the former as the upper limit on the width of .
IV Dalitz plot fit
A Dalitz plot fit is made in order to determine the branching ratios of with respect to the mode . For the Dalitz plot fit, only candidates within of the PDG mass are accepted [4]. The invariant mass of the candidates is then constrained to the PDG mass of , and the four-vectors of the daughter particles are updated accordingly. A fit is made to the Dalitz plot using an amplitude model as presented by Arifi et al. [3] using the AmpTools software package [22]. The signal distribution is calculated from the squared amplitude with spin sum of final states and spin average of the initial states
| (2) |
where through are the decay amplitudes through the intermediate states , , , , and the direct three-body decay, respectively. Each amplitude is modeled as a Breit-Wigner function multiplied by a form factor specific to each decay channel. A constant amplitude is used to model the background combinations, which are not decay products of . The yield of each decay channel is calculated using AmpTools by an integration of the individual component over the Dalitz plot. The contribution of the three-body decay in the signal model is different from the background phase space decay in that the former is not flat across the Dalitz plot. During the fit, the masses and widths of these intermediate particles are constrained to their respective PDG values to facilitate the convergence. The small variations of the detector acceptance across the Dalitz plot are taken into account by using the output of a phase space MC sample passed through the GEANT3 detector simulation as input to the AmpTools fitting package.
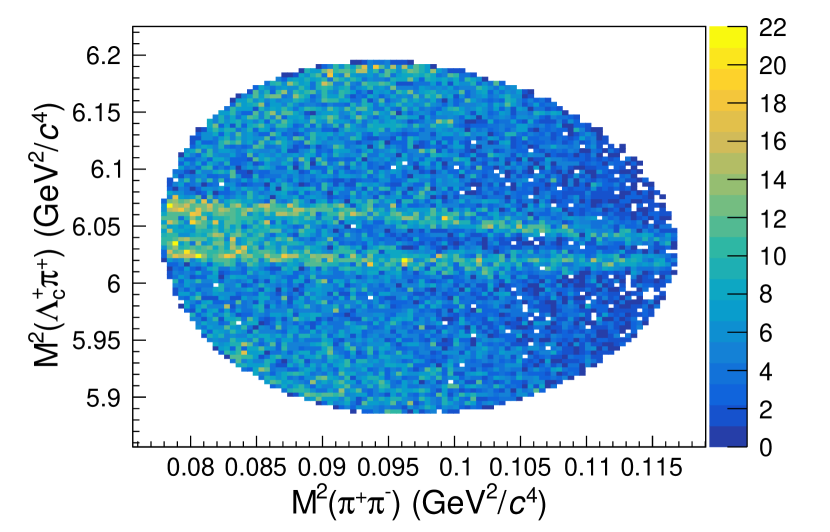
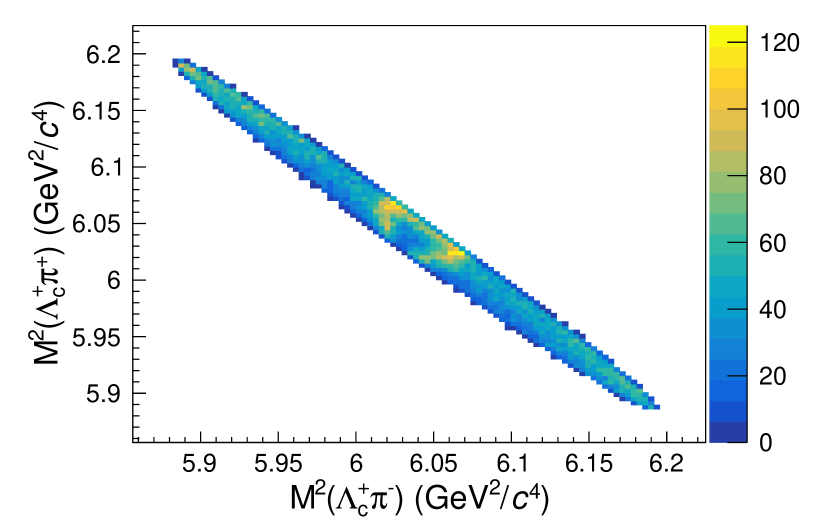
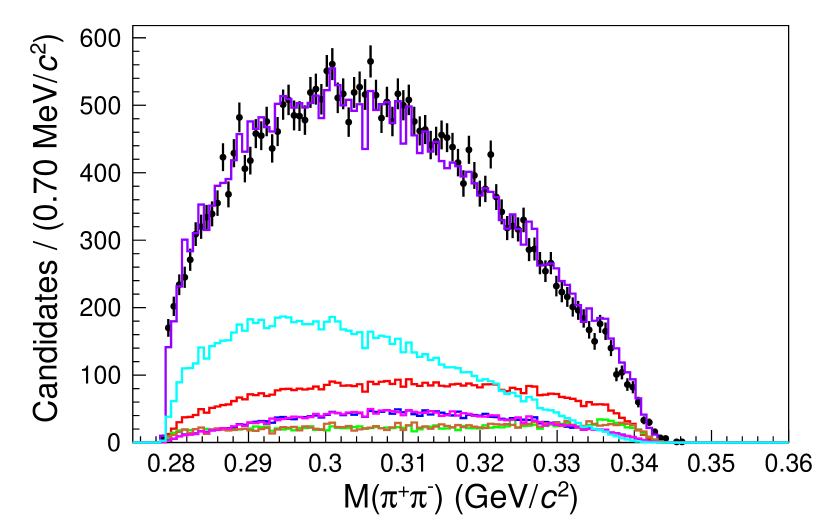
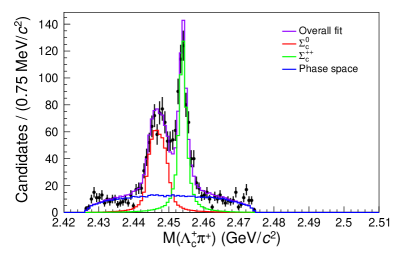
Figure 2 shows the Dalitz plots for candidates in the signal region. On the left subplot, the contributions from and the reflection from constitute the two horizontal stripes. The upper and lower parts of the Dalitz plot show slight excesses due to decays. There is also a clear excess on the left side of the Dalitz plot compared to the right in agreement with the three-body decay taking into account the spin, as predicted in the amplitude model [3]. On the right subplot, the horizontal and vertical stripes indicate the and decays respectively. It is straightforward to see the origin of the reflection peaks on the mass projection from this 2D Dalitz plot.
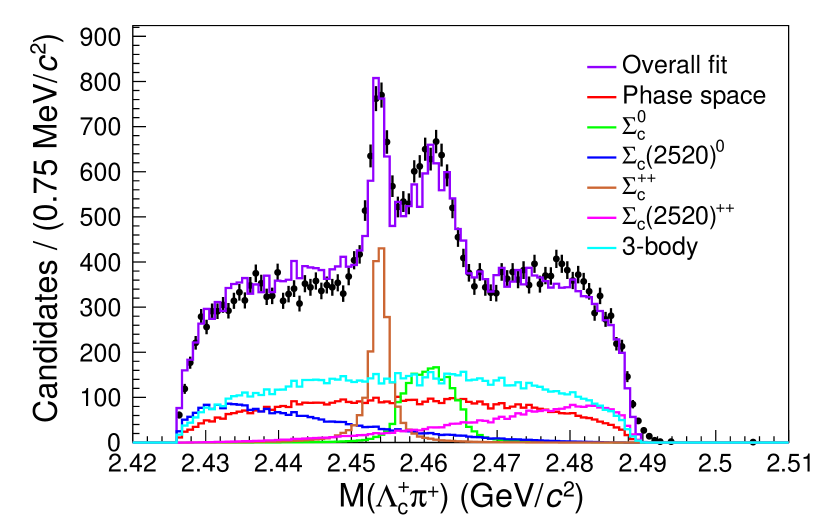
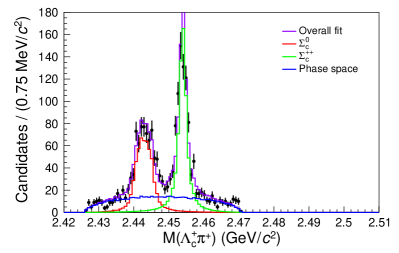
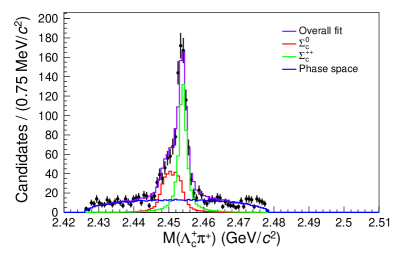
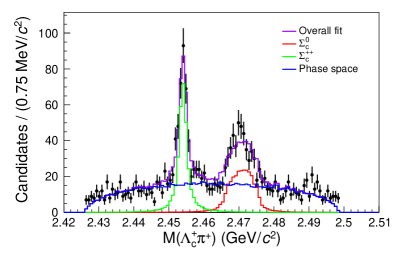
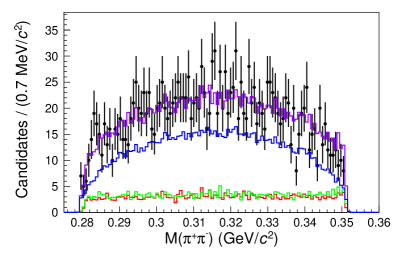
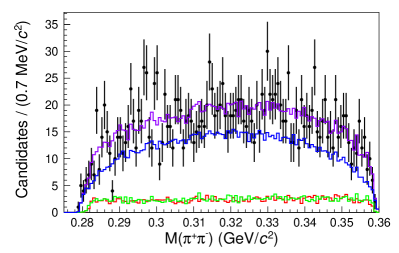
Figure 3 shows the projections of the fitted results with each component labeled on the plot. The peak and the reflection peak from are evident on the mass projection. The shoulders on the left and right side of the mass region are mostly formed by the decays from the off-shell . The three-body -wave decay in the signal model shows up in the mass projection as an asymmetric distribution, in contrast to the symmetric distribution from the background phase space decay. The yield in the signal region is . The yield is and the yield is . The uncertainties are statistical only.
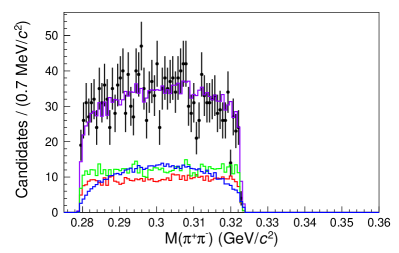
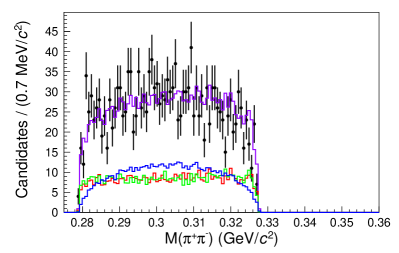
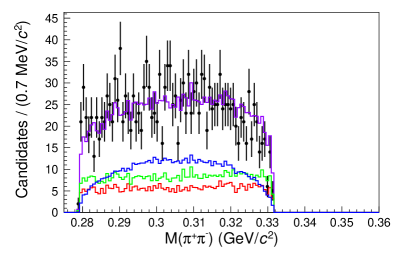
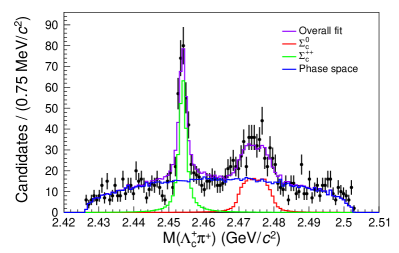
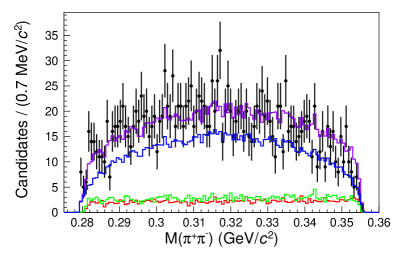
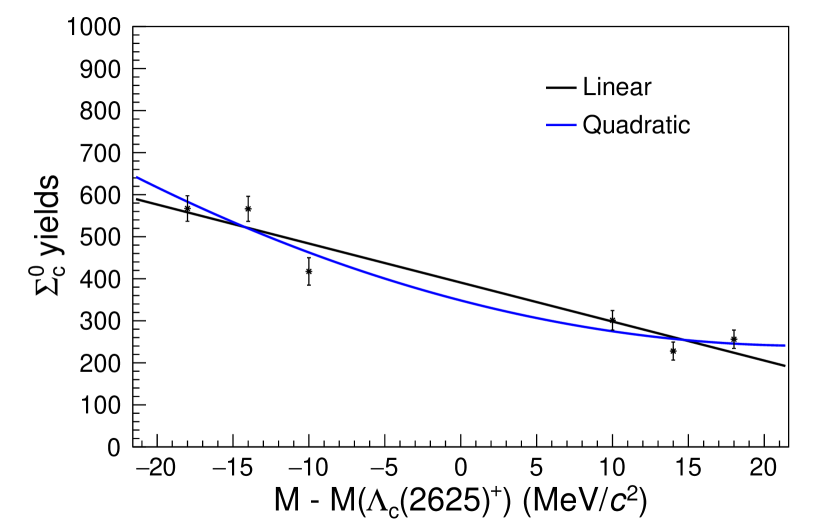
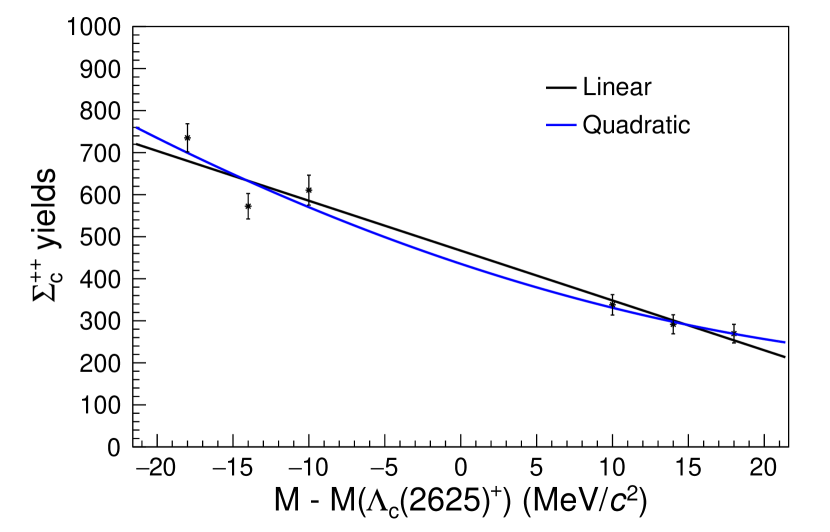
To account for candidates that are not decay products of the , the yields from the sidebands are subtracted from the yields found from the amplitude fit. The sidebands are six regions near the signal region, as shown in Fig. 4. Each sideband region is fitted as an incoherent sum of the contributions from the , the , and the three-body phase space decay. Figures 5 and 6 show the projections of the fit results for each sideband region with each component labeled on the plot. The yields in the signal region are determined by extrapolating the yields from the sidebands according to a linear fit, as shown in Fig. 7 and tabulated in Table 1. The background yields to be subtracted are and . The branching ratio of relative to the reference mode is calculated using
| (3) |
and similarly for the mode. We note that the efficiency over the area of the Dalitz plot is found to be uniform to within the statistical precision of the MC simulation.
We measure the branching ratios to be
| (4) | |||
where the errors are statistical only.
V Systematic uncertainties
The primary source of systematic uncertainty on the width is the inconsistency of the mass-resolution function between the MC sample and the experimental data. We use the decay as a control sample to determine the under- or over-estimation of the mass resolution in the MC sample relative to the experimental data. The mass resolution in the experimental data is found to be 86% of that in the MC sample with track smearing, 114% without track smearing. Both mass-resolution functions are used to determine the upper limit on the width in the experimental data. When applied to the experimental data, the mass resolution without track smearing scaled by 114% results in a more conservative upper limit on the width, thus reported as the final result.
The systematic uncertainty on the mass is not greatly affected by the uncertainty on the mass resolution, but is limited by the precision with which the Belle detector can measure the mass in this range. Studies with decays show that the measured mass difference with respect to the world-average value is . Any imperfection in the soft pion momentum calibration changes the measured mass of the more than that of the . We determine the scale factor required to correct the soft pion momentum such that the mass matches its PDG value, then apply the same scale factor to the daughter pions from candidates. The mass changed by , which we assign as the systematic uncertainty due to the mass scale. The track smearing correction applied to tracks in the MC sample has a negligible effect on the mass measurement. The systematic uncertainty due to the low momentum correction is , which is found by comparing the measured mass with and without the low momentum correction. Summing the contributions from the mass scale and low momentum track correction in quadrature, the total systematic uncertainty on the mass measurement is .
The systematic uncertainties on the branching ratios, which are calculated from Eq. (3), are derived from the uncertainty of the yield in the signal region, the yields fitted in the signal Dalitz plot fit, and the subtracted yields extrapolated from the sideband fits. The systematic uncertainty associated with each is tabulated in Table 2. The signal yield is most affected by the mass-resolution function. We fit the experimental data with a mass-resolution function determined with and without track smearing. The difference in the yields is taken as the systematic uncertainty on the signal yield. The signal yields are determined from the Dalitz plot fit, with their masses and widths fixed to PDG values. The masses, widths, and mass resolutions are systematically varied within the PDG uncertainties, and the maximum change in the fitted yield is taken as the systematic uncertainty. In order to determine the sideband subtracted yield, the six sidebands are fitted individually to determine the yields, with the yield and uncertainty in each sideband region shown in Fig. 7. The extrapolated yield at the nominal mass is a weighted average of the yields of the six sidebands. We take the difference between the linear and quadratic extrapolation as shown in Table 1 as the systematic uncertainty due to the extrapolation. To account for the statistical fluctuation due the finite MC sample sizes in the Dalitz plot fits, we compare the fitted results using two statistically independent MC samples of the same size. The difference is taken as the systematic uncertainty due to the MC sample size. With systematic uncertainties on the yields in Eq. (3) listed in Table 2, the total systematic uncertainties on the branching ratios are calculated from the propagation of error and are listed in Table 3. The total systematic uncertainty on the branching ratios is found to be 0.40% for the channel, and 0.32% for the channel.
| Method | yield | yield |
|---|---|---|
| Linear | ||
| Quadratic | ||
| Difference | 11.00% | 6.64% |
| Source | signal | signal | sideband | sideband | signal |
|---|---|---|---|---|---|
| Resolution | 1.97% | 1.42% | 2.74% | 1.08% | 3.64% |
| width | 4.00% | 2.26% | 2.52% | 2.38% | - |
| mass | 1.25% | 1.11% | 0.08% | 0.08% | - |
| Extrapolation | - | - | 11.00% | 6.64% | - |
| MC sample size | 1.91% | 2.09% | 0.71% | 0.22% | - |
| Total | 5.01% | 3.57% | 11.63% | 7.14% | 3.64% |
| Source | ||
|---|---|---|
| resolution | 0.13% | 0.10% |
| width | 0.26% | 0.16% |
| mass | 0.08% | 0.07% |
| Extrapolation | 0.14% | 0.10% |
| MC sample size | 0.12% | 0.14% |
| resolution | 0.19% | 0.19% |
| Total | 0.40% | 0.32% |
VI Discussion
We report the most precise mass, width, and branching ratio measurements to date. The measured mass is consistent with previous results. The measured upper limit on the width is at the 90% confidence level. Theoretical predictions for the width vary. Arifi et al. predict the width to be 0.570 MeV/ based on chiral and heavy quark symmetry [3]. The width is revised to be between 0.09 and 0.26 MeV/ in a subsequent publication with the inclusion of relativistic corrections [5]. Kawakami et al. predict a width in the range of 0.11 - 0.73 MeV/ based on chiral symmetry [6]. Guo et al. predict a much smaller width of MeV/, based on the model [7].
The branching ratios of and relative to the reference mode are extracted from a full Dalitz plot fit. Backgrounds from non- decays are subtracted from the yields. Our measurements align with the prediction by Arifi et al., who assume is a mode excitation [3]. Kawakami et al. predicted a wide range [6] and Guo et al. predicted the ratio to be 29.9% [7], which is already in contradiction with the previous measurement. Our measurements of the properties of the charmed baryon will be useful to further constrain the parameter space of the quark models and can be applied to other heavy quark systems.
VII Conclusions
We measure the mass of the to be , where the uncertainty on the mass is not included since it is constrained to the PDG value during reconstruction. This is equivalent to
| (5) |
The mass measurement is consistent with the previous CDF measurement but with approximately half the uncertainty [2].
An upper limit on the width is determined to be
| (6) |
at 90% confidence level which is around a factor of two more stringent than the previous limit.
Based on a full Dalitz plot fit and with sideband subtraction of the yields, the branching ratios relative to the mode are obtained:
| (7) | |||
This is the first measurement made of these branching ratios as previously only limits have been presented. These measurements can be used as inputs to theoretical models to generate predictions for other heavy quark baryons.
VIII Acknowledgements
This work, based on data collected using the Belle detector, which was operated until June 2010, was supported by the Ministry of Education, Culture, Sports, Science, and Technology (MEXT) of Japan, the Japan Society for the Promotion of Science (JSPS), and the Tau-Lepton Physics Research Center of Nagoya University; the Australian Research Council including grants DP180102629, DP170102389, DP170102204, DE220100462, DP150103061, FT130100303; Austrian Federal Ministry of Education, Science and Research (FWF) and FWF Austrian Science Fund No. P 31361-N36; the National Natural Science Foundation of China under Contracts No. 11675166, No. 11705209; No. 11975076; No. 12135005; No. 12175041; No. 12161141008; Key Research Program of Frontier Sciences, Chinese Academy of Sciences (CAS), Grant No. QYZDJ-SSW-SLH011; Project ZR2022JQ02 supported by Shandong Provincial Natural Science Foundation; the Ministry of Education, Youth and Sports of the Czech Republic under Contract No. LTT17020; the Czech Science Foundation Grant No. 22-18469S; Horizon 2020 ERC Advanced Grant No. 884719 and ERC Starting Grant No. 947006 “InterLeptons” (European Union); the Carl Zeiss Foundation, the Deutsche Forschungsgemeinschaft, the Excellence Cluster Universe, and the VolkswagenStiftung; the Department of Atomic Energy (Project Identification No. RTI 4002) and the Department of Science and Technology of India; the Istituto Nazionale di Fisica Nucleare of Italy; National Research Foundation (NRF) of Korea Grant Nos. 2016R1D1A1B02012900, 2018R1A2B3003643, 2018R1A6A1A06024970, RS202200197659, 2019R1I1A3A01058933, 2021R1A6A1A03043957, 2021R1F1A1060423, 2021R1F1A1064008, 2022R1A2C1003993; Radiation Science Research Institute, Foreign Large-size Research Facility Application Supporting project, the Global Science Experimental Data Hub Center of the Korea Institute of Science and Technology Information and KREONET/GLORIAD; the Polish Ministry of Science and Higher Education and the National Science Center; the Ministry of Science and Higher Education of the Russian Federation, Agreement 14.W03.31.0026, and the HSE University Basic Research Program, Moscow; University of Tabuk research grants S-1440-0321, S-0256-1438, and S-0280-1439 (Saudi Arabia); the Slovenian Research Agency Grant Nos. J1-9124 and P1-0135; Ikerbasque, Basque Foundation for Science, Spain; the Swiss National Science Foundation; the Ministry of Education and the Ministry of Science and Technology of Taiwan; and the United States Department of Energy and the National Science Foundation. These acknowledgements are not to be interpreted as an endorsement of any statement made by any of our institutes, funding agencies, governments, or their representatives. We thank the KEKB group for the excellent operation of the accelerator; the KEK cryogenics group for the efficient operation of the solenoid; and the KEK computer group and the Pacific Northwest National Laboratory (PNNL) Environmental Molecular Sciences Laboratory (EMSL) computing group for strong computing support; and the National Institute of Informatics, and Science Information NETwork 6 (SINET6) for valuable network support.
References
- Albrecht et al. [1993] H. Albrecht et al. (ARGUS), Observation of a new charmed baryon, Phys. Lett. B 317, 227 (1993).
- Aaltonen et al. [2011] T. Aaltonen et al. (CDF), Measurements of the properties of , , , and baryons, Phys. Rev. D 84, 012003 (2011), arXiv:1105.5995 [hep-ex] .
- Arifi et al. [2018] A. J. Arifi, H. Nagahiro, and A. Hosaka, Three-body decay of and with the inclusion of a direct two-pion coupling, Phys. Rev. D 98, 114007 (2018), arXiv:1809.10290 [hep-ph] .
- Zyla et al. [2020] P. A. Zyla et al. (Particle Data Group), Review of Particle Physics, Prog. Theo. Exp. Phys. 2020, 083C01 (2020).
- Arifi et al. [2021] A. J. Arifi, D. Suenaga, and A. Hosaka, Relativistic corrections to decays of heavy baryons in the quark model, Phys. Rev. D 103, 094003 (2021), arXiv:2102.03754 [hep-ph] .
- Kawakami and Harada [2018] Y. Kawakami and M. Harada, Analysis of , , , based on a chiral partner structure, Phys. Rev. D 97, 114024 (2018), arXiv:1804.04872 [hep-ph] .
- Guo et al. [2019] J.-J. Guo, P. Yang, and A. Zhang, Strong decays of observed baryons in the model, Phys. Rev. D 100, 014001 (2019), arXiv:1902.07488 [hep-ph] .
- Cheng [2015] H.-Y. Cheng, Charmed baryons circa 2015, Front. Phys. (Beijing) 10, 101406 (2015).
- Abashian et al. [2002] A. Abashian et al. (Belle), The Belle Detector, Nucl. Instrum. Meth. A 479, 117 (2002).
- Brodzicka et al. [2012] J. Brodzicka et al. (Belle), Physics Achievements from the Belle Experiment, Prog. Theo. Exp. Phys. 2012, 04D001 (2012), arXiv:1212.5342 [hep-ex] .
- Kurokawa and Kikutani [2003] S. Kurokawa and E. Kikutani, Overview of the KEKB accelerators, Nucl. Instrum. Meth. A 499, 1 (2003).
- Abe et al. [2013] T. Abe et al., Achievements of KEKB, Prog. Theo. Exp. Phys. 2013, 03A001 (2013).
- Lange [2001] D. J. Lange, The EvtGen particle decay simulation package, Nucl. Instrum. Meth. A 462, 152 (2001).
- [14] Reconstruction of charge conjugates is implied unless otherwise stated.
- Brun et al. [1987] R. Brun, F. Bruyant, M. Maire, A. C. McPherson, and P. Zanarini, GEANT3 (1987).
- Gelb et al. [2018] M. Gelb et al., B2BII: Data Conversion from Belle to Belle II, Comput. Softw. Big Sci. 2, 9 (2018), arXiv:1810.00019 [hep-ex] .
- Kuhr et al. [2019] T. Kuhr, C. Pulvermacher, M. Ritter, T. Hauth, and N. Braun (Belle-II Framework Software Group), The Belle II Core Software, Comput. Softw. Big Sci. 3, 1 (2019), arXiv:1809.04299 [physics.comp-ph] .
- [18] Belle II Analysis Software Framework (basf2), https://doi.org/10.5281/zenodo.5574115.
- Nakano [2002] E. Nakano, Belle PID, Nucl. Instrum. Meth. A 494, 402 (2002).
- Lee et al. [2014] S. H. Lee et al. (Belle), Measurements of the masses and widths of the and baryons, Phys. Rev. D 89, 091102 (2014), arXiv:1404.5389 [hep-ex] .
- Verkerke and Kirkby [2003] W. Verkerke and D. P. Kirkby, The RooFit toolkit for data modeling, eConf C0303241, MOLT007 (2003), arXiv:physics/0306116 .
- [22] H. Matevosyan, R. Mitchell, and M. Shepherd, https://github.com/mashephe/AmpTools/wiki.