Measurement of the cross section from 0.7 GeV to 3.0 GeV
via initial-state radiation
Abstract
The cross section of the process is measured with a precision of 1.6% to 25% in the energy range between and 3.0 GeV using the Initial State Radiation method. A data set with an integrated luminosity of taken at the center-of-mass energy of with the BESIII detector at the BEPCII collider is used. The product branching fractions for , , , and are measured to be , , , and , respectively. The branching fraction is measured to be , where is the dileptonic width of . The first errors are of statistical, the second and third ones of systematic nature.
I Introduction
The Standard Model (SM) of particle physics has so far successfully withstood most of the challenges it has been confronted with. However, there are still deficiencies in the SM, and the search for physics beyond the SM (‘New Physics’) is a major effort nowadays. A hint for New Physics might come from the anomalous magnetic moment of the muon, . A discrepancy of , corresponding to 3.7 standard deviations, between the direct measurement c_bnl and the SM prediction c_thomas_2018 has been found. New experiments are expected to reach a precision of 0.14 ppm at Fermilab c_g-2 and at J-PARC c_jparc . At the same time, the theoretical accuracy is completely limited by the hadronic contributions to . The largest of these contributions is due to the hadronic Vacuum Polarization (hVP).
Although perturbative Quantum Chromodynamics (QCD) theory fails in the energy regime relevant for the calculation of , it is possible to relate the leading order hVP contribution to hadronic production rates in annihilations via the dispersion relation
| (1) |
where is the fine-structure constant, is the muon mass, is the center-of-mass energy squared, represents the cross section ratio of to , and is a kernel function c_3pi_Ks , which is monotonously decreasing with increasing . The energy dependence of both the hadronic cross section and the kernel function imply that is more sensitive to the cross section in the low energy region.
In order to improve the SM prediction for , precision measurements of hadronic cross sections at colliders are needed as input to the dispersive calculations. This can be accomplished by a direct, precise measurement of the cross section of in the energy region from to , and this is the main topic for the analysis presented in this report. In addition to the evaluation of the hadronic contributions to , the data allow also the study of the decays of the light vector mesons, , , , and excited states.
The hadronic cross section in annihilations at can be well described by the Vector Meson Dominance (VMD) model. The ground state vector mesons , , and are well understood, and their properties, such as the mass, width, and main decay modes, are precisely measured c_pdg2014 . However, the conventional VMD model, taking only into account the ground states, is not sufficient to describe data above mass region. Contributions from radial excitations of possible vector mesons with quantum numbers , and masses around and need to be taken into account.
At low energies, the spectrum is dominated by the and mesons. The mass region below 1.4 has been studied by SND c_3pi_snd and CMD-2 c_3pi_cmd2 with high statistics. At individual scan points their results show some deviations, however. Above the peak of the resonance, the BABAR experiment has measured the c_g3pi_babar cross section up to , exploiting the Initial State Radiation (ISR) method. The result agrees with the SND measurement c_3pi_snd for and significantly exceeds the cross section measured by DM2 c_3pi_dm2 in the region .
The emission of ISR photons with energies allows the production of the hadronic states at an “effective” center-of-mass energy , well below the actual of the collision. Excluding next-to-leading order and final state radiation effects, the actual and the effective center-of-mass energies are related according to . The large data samples acquired at recent colliders permit measuring the hadronic cross section in a wide range by exploiting the ISR technique, which is complementary to studies at energy scan experiments. The ISR method, originally used both at the KLOE c_kloe experiment at DANE and at the BABAR c_babar experiment at the PEP-II B-factory, has been applied to measure numerous channels of the cross section . This allows for a consistent measurement of the full energy range with the same accelerator and detector conditions. Different reconstruction techniques are applied according to the angular distribution of the ISR photons. Only a small fraction of the photons is emitted with large polar angles and can be reconstructed in the detector. The exclusive reconstruction of such events is referred to as “tagged ISR method” and makes measuring the cross section down to the hadronic mass threshold possible. A tagged ISR measurement of the channel has been performed by BESIII recently c_kloss . Most of the ISR photons are emitted along the beam direction, which is beyond the acceptance of currently existing detection systems at machines. However, it is still possible to reconstruct these events based on energy and momentum conservation, which is referred to as “untagged ISR method”. In this work, candidate events are selected both according to the tagged and untagged ISR selections.
II The BESIII detector and data samples
The BESIII detector is a magnetic spectrometer Ablikim:2009aa located at the Beijing Electron Positron Collider (BEPCII) Yu:IPAC2016-TUYA01 . The cylindrical core of the BESIII detector consists of a helium-based multilayer drift chamber (MDC), a plastic scintillator time-of-flight system (TOF), and a CsI(Tl) electromagnetic calorimeter (EMC), which are all enclosed in a superconducting solenoidal magnet providing a 1.0 T magnetic field. The solenoid is supported by an octagonal flux-return yoke with resistive plate counter muon identifier modules interleaved with steel. The acceptance of charged particles and photons is 93% over the solid angle. The charged-particle momentum resolution at is , and the resolution is for the electrons from Bhabha scattering. The EMC measures photon energies with a resolution of () at GeV in the barrel (end cap) region. The time resolution of the TOF barrel part is 68 ps, while that of the end cap part is 110 ps.
Two collision data samples were collected with the BESIII detector at in 2010 and 2011 and they are referred to as “Data I” and “Data II”. The corresponding integrated luminosities are determined to be and , respectively, by using large-angle Bhabha scattering events c_lum .
The geometry and response of the BESIII detector are modeled in a geant4-based c_geant4 Monte Carlo (MC) simulation software. It is used to produce signal and background MC samples for the determination of the mass resolution and detection efficiency, as well as for the study of background contributions. The signal MC of is modeled in VMD and generated with the phokhara c_phokhara event generator. The contribution from the resonance is not included in this generator. Thus, a MC sample of is generated with the kkmc c_kkmc and EvtGen c_evtgen event generators to study the signal, where the model c_besevtgen is used for the decay of .
The dominating background processes and are generated exclusively with phokhara c_phokhara . Further, generic MC samples including , , , , and are generated with kkmc and EvtGen. The subsequent decays of the resonances are processed according to the branching fractions provided by the Particle Data Group (PDG) c_pdg2014 . Remaining unmeasured decay modes from charmonium states are generated with lundcharm c_lundc . The beam energy spread is considered in all MC simulations. Final-State Radiation (FSR) effects are simulated with photos c_photos .
III Event selection
Event candidates of the final state of interest, denoted hereafter as ISR 3, contain two charged tracks and three photons. For the event selection, exactly two charged tracks are required to pass the interaction point within in the transverse and within in the longitudinal direction relative to the beam axis. Each track is required to be reconstructed within , where is the polar angle with respect to the beam direction. The two tracks in an event candidate must be oppositely charged. Each track is assumed to be a pion. In order to reduce background contributions from Bhabha scattering, both of the tracks are required to satisfy , where is the energy deposited in the EMC and is the magnitude of the momentum measured in the MDC.
Photon candidates are selected from showers in the EMC that are not associated with charged tracks. Good photon candidates reconstructed from the barrel part of the EMC must have a polar angle within and a minimum deposited energy of . To be reconstructed from the end cap, the photon candidates must have a polar angle within and a minimum energy deposit of . Timing information in the EMC is used to suppress electronic noise and energy deposits unrelated to the event. At least two photons matching these criteria are required for an analysis using the untagged ISR method, and at least three are required for the tagged ISR method. From all possible combinations of two photons, those which fulfill in a fit of the photon candidates constrained to the nominal mass () are accepted as candidates.
The criteria of the event selection are optimized for the three-pion invariant mass region , where the discrepancy between BABAR and DM2 is most prominent. The optimization is performed with a figure of merit defined as , where refers to the number of signal events, and refers to the number of events from all background contributions. The signal and background MC samples are normalized to the data by the integrated luminosity.
A kinematic fit is performed to reject background contributions and to improve the mass resolution. The four-momenta of the charged tracks and the photons are constrained to the initial four-momenta. The two photons, which are assigned to the candidate, are constrained to the nominal mass. If there are additional photons or candidates in a single event, the combination with the minimum from the kinematic fit is selected. For the tagged ISR method, the constraints add up to (four-momenta and mass), and is required. In the untagged ISR method, the radiative photon is considered as an unmeasured massless particle in the kinematic fit. Due to the missing momentum information the number of constraints is reduced to a (missing photon mass and mass) kinematic fit, where must be satisfied.
Further reduction of background in the tagged ISR method is achieved by considering the invariant mass distribution of the ISR photon and any other good photon in the event . Asymmetric decays can lead to misidentified ISR photons; these wrongly assigned ISR photons result in a peak in the distribution and are removed by a veto, requiring . In the untagged ISR method, additional background events are suppressed efficiently with a strict requirement on the scattering angle of the ISR photon determined by the kinematic fit, .
Due to the less constrained kinematic fit in the untagged ISR method, a non-negligible contribution of beam-induced background is found. An additional requirement is therefore applied to the untagged ISR method, where the two charged tracks are fitted to a common vertex. The vertex must have a distance to the nominal interaction point of less than in the plane perpendicular to the beams. Background contributions attributed to interactions of the beam halo with the beam pipe are efficiently removed. This additional vertex requirement is not requested in the tagged ISR method because such background is rejected with the four-momentum constraint.
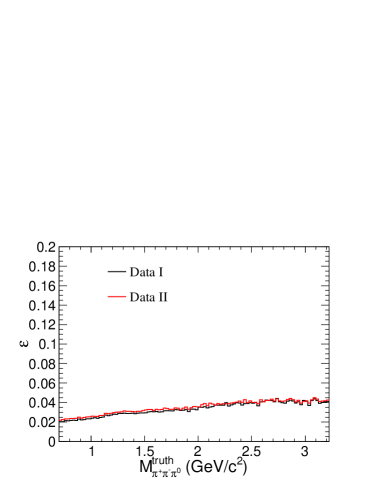
The mass-dependent efficiency is obtained from MC simulations. It varies from 2% to 4% for the tagged ISR method in the mass region , and from 0.3% to 15% for the untagged ISR method for masses between and , as shown in the top row of Fig. 1. The distributions are quite similar for the two data sets.


IV Background subtraction
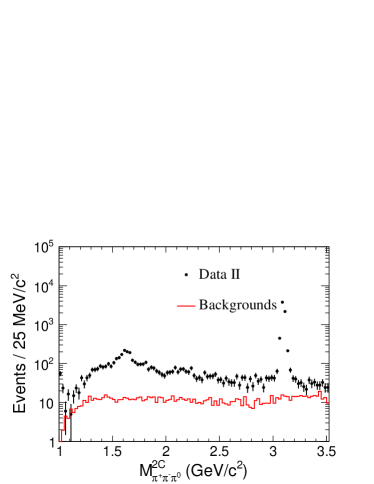
The background contamination of the selected events differs significantly between the tagged and the untagged ISR methods. The mass spectrum obtained from the tagged analysis has a relatively small background contamination at masses below . At larger masses, the spectrum is dominated by background. The untagged method, in comparison, suffers from very low efficiency in the low mass region, but it provides much higher efficiency with much less background contamination in the high mass region. This can be seen from the red lines in Fig. 1(c), 1(d) and lines in Fig. 1(a), 1(b) which show the background levels and the efficiencies for the tagged and untagged methods, respectively.
Using the side bands is an efficient way to estimate the events with wrongly reconstructed candidates. The candidate is constrained to the nominal mass for the signal mass region, and to and for the side bands. The from the mass constraint is required to be for both signal and side bands regions. Contributions from wrongly reconstructed in the signal region are subtracted using the averaged number of events in the side bands.
As mentioned earlier, the dominant backgrounds are due to and (referred to as and ISR 4 hereafter). The 4 events with a lost soft photon mainly contaminate the tagged ISR method, while the ISR 4 events are the dominant background for the untagged ISR method. Other backgrounds contribute to less than 1.3% and are estimated using the generic MC samples. The dominant backgrounds are estimated using a data-driven approach.
First, a clean 4 (ISR 4) sample is selected from data. The same selections of track and photon candidates as described in Sec. III are used, and at least four (five) good photons are required for the 4 (ISR ) sample. At least two candidates are selected from four good photons by a kinematic fit with ( mass constraint). If there are more than two good candidates, the combination with the candidates, which yields the minimum (see below) is selected. The 4 events are selected by constraining the two charged pions and two good candidates to a (four-momenta conservation plus two mass constraints) kinematic fit. A requirement of is imposed to reject background contributions to the 4 sample. In order to select ISR events, the two charged pions, four photons from two candidates, and one missing ISR photon are subjected to a kinematic fit. The number of constraints is reduced by the unknown four-momentum of the ISR photon. The value of the fit is required to be less than 20. The direction of the ISR photon predicted by the kinematic fit is required to satisfy . The reconstructed mass is required to be less than to reduce contribution of 4 events in the ISR 4 sample.
Then, a sample of MC simulated (ISR ) events is produced with the phokhara c_phokhara generator. It is used to determine the efficiency ratio of the ISR selection and the (ISR ) selection. Events of the ISR 4 sample with a generated invariant mass, , larger than are classified as the 4 sample, since they behave quite similar due to the soft ISR photon.
Finally, the efficiency ratio is used to scale the (ISR ) sample selected from data to obtain the background contamination from (ISR ) as a function of the 3 invariant mass.
V Unfolding
The background-subtracted 3 mass spectrum needs to be unfolded to account for effects of FSR and detector response before the cross section can be determined. The simplified Iterative Dynamic Stable method (IDS) c_ids is used to perform the unfolding. It requires the transfer matrix as input, which correlates the number of actually produced events in bin to the number of reconstructed events in bin .
Different bin sizes are used in the mass spectra to account for both the mass resolution and the different widths of the resonances: in the energy region below (low energy region), and in the energy region above (high energy region). According to MC studies, the resolution varies from to in the low energy region. At high energies it increases to a range from to for the tagged and from to for the untagged ISR method. The unfolding is performed separately for each energy region. The and resonances in the low energy region are narrow. To ensure a reliable unfolding result, it is important to consider the differences in the detector resolution between MC and data. In the high energy region, where both the widths of the resonances ( and ) and the bin sizes are much larger than the detector resolution, the differences of the latter between MC and data is negligible to the unfolded spectra.
To study differences between MC and data, the signals of and in data are fitted using the shape of the 3 MC mass distribution to describe the signal. The MC spectrum is convolved with a Gaussian function where the parameters reflect possible mass shifts and differences in the detector resolution between simulation and data. Combined results from the fits to and indicate a shift of the masses by , and a broadening of the mass resolution by for Data I, while a slightly larger mass shift of and a negligible modification of the resolution are found for Data II. These numbers are used to correct the transfer matrix extracted from simulation, and the errors are considered as systematic uncertainty.
The stability of the IDS method is provided by using regularization functions c_ids , which avoid unfolding large fluctuations in data, e.g. due to subtraction of a large background contribution. The parameters of the regularization functions need to be optimized for a specific unfolding task. The optimization is done by first constructing a toy MC distribution from which a ‘reconstructed toy’ is obtained with the transfer matrix from MC. This toy is made to keep the ‘reconstructed toy’ as close to the real data as possible. The errors for the ‘reconstructed toy’ are taken directly from real data and statistically fluctuated, including the uncertainty from background subtraction. Lastly, the ‘reconstructed toy’ is unfolded to compare with the toy, and the difference is measured by a . A scan for the parameters of the regularization functions is performed to find the optimized one with minimum .
The IDS procedure is applied to the 3 mass spectrum obtained after the event selection, the background subtraction, and after applying corrections for data/MC efficiency differences (see Sec. VI below). It provides the distributions unfolded from detector resolutions, distortions, and FSR effects as a function of , and a covariance matrix of the statistical uncertainties and their bin-to-bin correlations. The mass spectra after unfolding in different mass regions are shown in Sec. VII.
VI Systematic uncertainties
The contributions of the tracking efficiency, the photon efficiency, the event selections, and the background subtraction to the systematic uncertainties are studied.
VI.1 Tracking efficiency
The tracking efficiency for pions is studied with tagged events. Each event candidate is required to have at least three good charged tracks, where two of them must be oppositely charged. The information on and TOF is used to identify the tracks as pions.
The most energetic good photon is required have an energy greater than and is assumed to be the ISR photon. If there is more than one good photon, the events with photon pairs yielding invariant masses with are rejected. Additionally, the energy of the second most energetic photon must be less than .
Events with a second moment of the EMC reconstructed cluster of the ISR photon is greater than and an energy of the selected , , less than are rejected to remove fake ISR photons. According to the MC simulation, these events come from interactions of particles inside the EMC. The second moment of the shower is defined as , where is the radial distance of the crystal from the center of the cluster, and is the energy deposited in that crystal.
Exploiting the known initial four-momenta and the measured information of the ISR photon, the pair of oppositely charged tracks, and one of the other charged tracks, one can predict the four-momentum of the fourth charged track in the event by a kinematic fit.
We use the value , where 111 for each particle hypothesis (pion, kaon, and proton). and is the measure of quality from the kinematic fit, to identify the charged particles. Only events identified as with and are kept. Any pair of oppositely charged tracks among the three selected pion candidates is required to have an invariant mass different from the mass of the , i.e. not within .
In the 1C kinematic fit, there is a missing charged track which is used to study the tracking efficiency. The missing track is taken as being reconstructed in the detector only if four charged tracks with zero net charge have survived the basic selections in Sec. III. The tracking efficiency is defined as
| (2) |
where is the number of events with charged tracks reconstructed. The factor two in the formula comes from the multiplicity of the track under study. The contamination to the selected sample by residual background contributions is estimated using the generic MC samples. The main background contribution comes from . It is determined from the continuum MC sample and compared to the corresponding result of the BABAR Collaboration c_sys_trking_5pi_babar . A scaling factor of is applied to correct the contribution of the process to the generic MC sample. Other background processes contribute to less than 1%. The MC samples are subtracted from data after being scaled according to the integrated luminosity. Effects from background contributions to the data-MC efficiency difference are considered by applying a correction , where . Here, is the tracking efficiency in data before background (BG) subtraction, and is the tracking efficiency in signal MC. The difference between MC and data is obtained as:
| (3) |
where is the tracking efficiency of data after background subtraction, is the background ratio, is the tracking efficiency obtained with the generic MC samples, and is the efficiency difference between background and signal. The systematic uncertainties of the tracking efficiency due to the event selection criteria are considered by varying the selection criteria within a small range. The differences in the results are calculated as a function of both transverse momentum and polar angle . The largest deviations are taken as the corresponding systematic uncertainties, which, in total, are less than 0.2%.
Excellent agreement in the tracking efficiency is observed for and independently of the data sets. Thus, the results of both data sets and for and are combined to minimize the statistical uncertainties. A systematic uncertainty of 0.2% is assigned to each charged track with transverse momentum larger than . For tracks with , corrections are applied based on the above results and the uncertainties of the corrections are taken as systematic uncertainties. For , a correction of % is applied for and for . For , a correction of % is used for and for .
VI.2 Photon detection efficiency
The photon efficiency is studied using the process . The strategy is to tag , , , and one photon of the untagged . The other photon of the decay can be predicted with the initial four-momenta of . In each event, there are two candidates in the final state and each decays into two photons. As a result, there will be at most two entries if only one is found, and at most four entries if two candidates are found. Exactly two good charged tracks with zero net charge are required, each with an energy deposited in the EMC of less than . The of the hypothesis should be less than 10 and, additionally, less than the value for other hypotheses (e.g. or ). There must be at least three good photons, from which the best one or two candidates are reconstructed with a from the ( mass) kinematic fit. In addition, a unique assignment of the photons to all the candidates is required. The mass of is required to be less than to reduce the contribution of very soft . The two charged tracks and one are subjected to a kinematic fit, which is performed to select one good photon and to predict the second photon of the decay. In this fit, the four-momenta of all tracks, including the missing photon, are constrained to the initial four-momenta of the system and a mass constraint applied to the candidate. If more than three photons are found in an event, all possible combinations of and of the predicted photons are considered. A signal region () and side band regions ( and ) in the invariant mass of are studied to further remove background contributions to the process . The predicted photons are matched with the remaining good photons by comparing the returned values (, ranging from 0 to 1 to describe the similarity) of the howNear function in the HepLorentzVector class c_clhep , where defines the difference between two vectors and . Due to the resolution difference, requirements are applied as: for photons in the barrel region, and for photons in the end cap of the EMC.
The background contamination to the sample is estimated using the MC sample, which is modified by substituting the events with in phokhara c_phokhara . The background contributions estimated with the generic MC samples is about 1% in the data sample. The photon efficiency is defined as the ratio of the number of entries satisfying the requirement on to all the entries. The raw efficiency of the data is corrected in the same way as done for the tracking efficiency. The efficiency difference between MC and data is assumed to be constant with respect to the photon energy () and the polar angle (). The average values are obtained through fitting, and the largest one is taken as the systematic uncertainty of the photon efficiency.
In order to estimate the corresponding systematic uncertainties, all criteria used to select the control sample are varied by 3% for , by 10% for , and by at least 20% for others. The resulting uncertainty is found to be )%. To be conservative, to each photon is assigned a systematic uncertainty of 0.3%.
VI.3 Uncertainties from the event selection criteria
The event selection criteria determine its efficiency. Understanding the systematic uncertainties of the criteria can be achieved through studies of control samples. These samples can be constructed from data using criteria similar to the ISR 3 event selection discussed above. Since the selection criterion under study is not used, the purity of these control samples is guaranteed by choosing the and signals in the 3 mass spectra and by tightening other selection criteria.
For the tagged ISR method, the control samples are selected from the tagged ISR 3 signal with mass windows () for and () for . The bias is assumed to be linear in the 3 mass and can be obtained for a given 3 mass by fitting. The main background in these two samples is (ISR ), which has been measured in Sec. IV. Thus, the (ISR ) MC is scaled to data according to the mass spectrum in the and the mass windows, respectively. The contribution of other background processes is small and can be estimated with the generic MC sample. The signal efficiency is compared to the value obtained from the control samples after subtracting background contributions.
For the untagged ISR method, the control sample is selected from the untagged ISR 3 signal with 3 mass window () for . The background contamination is much smaller compared to the tagged control samples. Remaining background contributions are removed analogously to the tagged control samples. Since only one single control sample is used, the bias is assumed to be constant from 1.05 to .
To reduce the background contributions in the control samples, some requirements are further tightened: The charged tracks must be identified as pions by means of ; the penetration depth of tracks in the MUC is required to be less than 40 cm to reject muons in the control samples.
For the evaluation of the condition on , the tagged control samples are constructed by requiring and . The biases are determined to be , , and by comparing the efficiencies from signal MC and control samples in data in the mass regions of and for the tagged analysis, and the region for the untagged analysis. The quoted errors include both the statistical and the systematic error due to the uncertainty of scaling the (ISR ) background.
The two photons (, ) in the final state are constrained to the nominal mass, and is required. This is applied on top of the kinematic fit and the requirement . Therefore, the bias of the initial requirement is negligible. However, side bands to the peak are used to remove background contributions and this must be considered. Three control samples are selected analogously to the study. By comparing the distributions after the subtraction of the side bands, biases from and the side bands subtraction are determined to be , , and from the three control samples.
A kinematic fit is used in both ISR methods. Its bias is evaluated for the three data samples. To reduce background contamination, on top of the standard selection criteria, the energy of the tagged ISR photon is required to be and , while the condition on is dropped. For the untagged sample, only events with two good photons are considered. Additionally, the side bands ( and ) are used to subtract background contributions. By comparing the distributions, biases from are determined as , , and from the tagged , tagged , and untagged control samples.
The additional veto in the tagged ISR method is studied by applying more stringent requirements on the values: and . A value of is assigned to the tagged sample, and a correction of for the tagged sample.
The bias due to the condition on of the untagged ISR photon is estimated from a comparison of the angular distributions in MC and data using the untagged sample. The relative efficiency difference between the MC and the data is taken as the systematic uncertainty for the selection . The results of the two data sets are combined yielding as the systematic uncertainty. The main source comes from the uncertainty of the background subtraction.
The vertex position given by the vertex fit is used to reject background contributions. Using a sample, the efficiency difference between MC and data due to the vertex fit is estimated to be less than 0.2%.
VI.4 Systematic uncertainty from background subtraction
The main background contributions are . Its uncertainty is dominated by the statistical uncertainty of the selected data samples, which are scaled by the efficiency ratio obtained from MC. Remaining systematic uncertainties are estimated by varying the event selection criteria, mainly the from kinematic fit, by at least 40%. The maximum difference of the unfolded mass spectra between the standard selection and the variation is taken as a measure for the systematic uncertainty. Other background contributions are subtracted with the generic MC samples. Further sources of systematic uncertainties stem from branching fractions, cross sections, and dileptonic widths c_pdg2014 . The systematic uncertainty of the backgound subtraction is estimated by varying all estimated background contributions by 1. The unfolded mass spectra are compared bin-by-bin after subtracting the background, and the maximum relative difference is taken as the systematic uncertainty in the corresponding bin. A smoothing procedure is applied to reduce the large statistical errors in a few bins with poor statistics. The resulting systematic uncertainty of the background subtraction is shown in Fig. 2 and varies from 0.3% to 26% for the tagged ISR method and from 0% to 12% for the untagged ISR method.


VI.5 Systematic uncertainty from unfolding
The transfer matrix is corrected due to a mass shift and a resolution difference between MC and data. The corrections to the transfer matrix are varied by 1 to study the systematics. Additionally, tests of the unfolding procedure are performed to investigate potential biases introduced by the method. Toy experiments are carried out similarly to the ones described in Sec. V, except for the statistical fluctuation of the ‘reconstructed toy’. The approach allows studying the actual systematics of the unfolding method, avoiding bias from the statistical uncertainty of the data sets. Comparisons are made between the ‘unfolded toy’ and the true toy. The relative difference is taken as the systematic uncertainty. To reduce large statistical effects of individual bins with only a few events, an averaged value is assigned to each bin by fitting the difference with a constant. The systematic uncertainties are estimated to be 0.7% below and 1.2% above for tagged, and 1% for the untagged mass spectrum.
VI.6 Summary of the systematic uncertainties
Biases are corrected for and the uncertainties of the corrections are taken as the remaining systematic uncertainties for the cross section. The individual contributions to the systematic uncertainties are summarized in Table 1. Details about the vacuum polarization can be found in Sec. VIII. The total numbers for the different mass regions are also listed. The average uncertainty in a certain mass range is calculated by weighting the ratio of events in each bin from signal MC.
| Data samples | Data I | Data II | ||
|---|---|---|---|---|
| Source | Tagged | Untagged | Tagged | Untagged |
| Tracking | 0.4-1.0 | 0.4-0.9 | 0.4-0.7 | 0.4-0.7 |
| Photon reconstruction | 0.9 | 0.6 | 0.9 | 0.6 |
| E/P | 0.7-0.9 | 0.4 | 0.4 | 0.4 |
| side band | 0.6-0.9 | 0.4 | 0.4 | 0.4 |
| Kinematic fit ( cut) | 1.0-1.4 | 0.4 | 0.6 | 0.4 |
| Veto for | 0.6 | - | 0.5-1.0 | - |
| - | 1.5 | - | 1.5 | |
| Vertex | - | 0.2 | - | 0.2 |
| BG subtraction | 0.0-19.0 | 0-12.0 | 0.04-26.0 | 0.0-6.1 |
| Vacuum polarization | 0.1-0.3 | 0.1 | 0.1-0.3 | 0.1 |
| Unfolding | 1.0-1.7 | 1.3 | 0.7-1.0 | 0.8 |
| Radiative function | 0.5 | 0.5 | 0.5 | 0.5 |
| Luminosity | 1.1 | 1.1 | 1.1 | 1.1 |
| Total | ||||
| (0.7-1.05)[average] | 2.1-16.0[2.6] | - | 1.8-11.0[2.3] | - |
| (1.05-2.0)[average] | 2.4-5.9[3.5] | 2.0-4.4[2.1] | 1.9-7.4[2.7] | 1.6-4.8[1.7] |
| (2.0-3.0)[average] | 2.8-19.0[8.3] | 1.9-12[2.5] | 3.1-25.0[11] | 1.6-6.3[2.0] |
| (0.76-0.8)[average] | 2.2-3.0[2.3] | - | 1.8-6.5[2.1] | - |
| (1.01-1.03)[average] | 2.1-7.0[2.7] | - | 1.8-5.1[2.0] | - |
| (1.1-1.4)[average] | 2.5-4.7[3.3] | 2.0-4.4[2.6] | 1.9-5.3[2.7] | 1.6-4.8[2.0] |
| (1.40-1.80)[average] | 2.4-5.9[3.8] | 2.0-2.0[2.0] | 1.9-3.6[2.6] | 1.6-2.1[1.7] |
| (3.05-3.15)[average] | - | 1.4-2.2[1.4] | - | 1.4-7.4[1.4] |
VII Combined fit of the 3 mass spectrum
The parameters of the vector resonances , and are determined with a combined fit to the mass spectrum from both the tagged and untagged ISR method in both data sets. The relation
| (4) |
is fitted to the unfolded mass spectrum between 0.7 to , where is the detection efficiency, is the effective luminosity, and is the Born cross section for . The effective luminosity, defined as , relies on the total integrated luminosity and the calculated radiator function c_kuraev . The latter describes the probability to radiate an ISR photon so that the production of hadronic final states with a mass of is possible. According to the VMD model, can be written as the sum of four resonances:
| (5) |
where and are the mass and width of the vector meson is the corresponding phase, and are the branching fractions of decaying into and , respectively, and is the total width. Here, is the partial width of the resonance decay into the final state . The mass-dependent widths of and are calculated taking into account all significant decay modes. The decay is assumed to proceed via the intermediate state, and is the 3 phase space volume calculated under this hypothesis. Details about the formulas can be found in Ref. c_snd25 . A combined binned fit is performed. The results are illustrated in Fig. 3. The mass of and , the mass and width of and , and the branching fractions are free parameters. The relative phase between and is taken from Ref. c_snd25 , , while the phases of , , and are fixed at , , and , respectively c_phase30 . The widths of and are fixed to the PDG c_pdg2014 values.


Table 2 summarizes the results of the fit.
| Parameters | PDG c_pdg2014 | BABAR | This analysis |
|---|---|---|---|
| /NDF | - | 146/148 | 443/390 |
| PDG c_pdg2014 | PDG c_pdg2014 | ||
| PDG c_pdg2014 | PDG c_pdg2014 | ||
| seen | |||
| seen |
The systematic uncertainties of the fitted masses and widths include contributions from the uncertainties of , , , and the corrections of the difference in resolution between MC and data. In order to determine these contributions, the fits are performed varying each of the above parameters by , and the differences between the fitted results and the normal fitted result, shown in Table 2, are taken as the corresponding contributions to the systematic uncertainty. The estimated background contributions may also affect the fit results of the masses and widths of the resonances. To consider this issue, toy samples are produced for the estimated background contributions by randomly fluctuating each bin content according to a Gaussian distribution. Every toy sample is subtracted from data and the remaining mass spectrum is fitted. The distribution of the obtained parameters is fitted with a Gaussian after 100 fits. Its standard deviation is taken as the uncertainty of the respective parameter. Compared to other sources, the uncertainties due to background contamination to the fitted masses and widths are negligible. A similar study is done, except for the background subtraction which has been considered in Table 1, for the branching fractions. To consider the systematics from bin width and fit range, we fit toy MC samples generated with the same model. For each parameter, 100 MC toys are generated, and the largest difference from comparing the values of the input and the fitted parameter is taken as the systematic uncertainty. Table 3 summarizes the total systematic uncertainties from the fit. As for the branching fractions, this table reports the additional systematics besides Table 1.
| Variable | ||||||||||
|---|---|---|---|---|---|---|---|---|---|---|
| Sys. (%) | 1.7 | 4.0 | 9.7 | 13 | 0.03 | 0.04 | 3.9 | 0.4 | 35 | 8.5 |
The result of the untagged ISR method is used to calculate the branching fraction of . As shown in Fig. 4, the strong signals are almost background free. After the side bands and other backgrounds estimated from Sec. IV being subtracted, the number of the signal in the region (3.05-3.15) is obtained by subtracting the side bands, (2.9-3.0) and (3.2-3.3), and it yields signal events for the combined data sets.


To calculate the branching fraction, the total number of in data is determined by the convolution of the effective luminosity with the cross section of ,
| (6) |
where and are the mass and the full width of , is the dileptonic width of c_pdg2014 . The uncertainty of is the main contribution to the total uncertainty of the number of , and a systematic error of 1.8% is assigned. Thus the total number of is determined to be . With the above information, the branching fraction of is calculated according to:
| (7) |
where is the selection efficiency, and the branching fraction is taken from PDG c_pdg2014 . The result is %, where the systematic error is taken from Table 1. This result is consistent with the previous measurements from BABAR : ()% c_g3pi_babar , BES: ()% c_3pi_bes , and BESIII: ()% c_3pi_bes3 , with a slightly improved precision.
VIII Cross section results
The Born cross section is extracted from the unfolded 3 mass spectrum using the relation
| (8) |
where is the vacuum polarization (VP) correction factor, which cannot be calculated from the first principles. Experimental data of annihilating to hadrons is used as input for the calculations. Up to , the VP effects in the propagator of the virtual photon are evaluated with an accuracy better than 0.05%. However, in the vicinity of the narrow and resonances, the errors are 0.08% and 0.3% c_vp_cmd , respectively.
After correcting for the radiator function and the vacuum polarization, the final cross section is obtained. It is measured from 0.7 to using the tagged ISR method, whereas the untagged ISR method is applied from 1.05 to . Figure 5 shows the cross sections as a function of 3 mass. In the region of overlap (1.05-), the results of the tagged and the untagged methods are statistically compatible within , and are therefore combined according to their statistical errors, as shown in Fig. 6 and Table 4. The quoted errors correspond to the statistical (including contribution from side band subtraction) and the systematic uncertainties. To compare the result with other experiments, the dressed cross sections without VP correction are calculated and shown in Fig. 6. The results reported here agree well with the measurement by BABAR , but the values are slightly larger than those of the SND measurement. However, they are all consistent within uncertainties. The two resonances and , as reported by BABAR , are clearly confirmed. The so-called resonance is unusual with respect to the , since the width is expected to increase with a higher excited state.


| (GeV) | (nb) | (GeV) | (nb) | (GeV) | (nb) |
|---|---|---|---|---|---|
| 0.70125 | 0.88375 | 1.21250 | |||
| 0.70375 | 0.88625 | 1.23750 | |||
| 0.70625 | 0.88875 | 1.26250 | |||
| 0.70875 | 0.89125 | 1.28750 | |||
| 0.71125 | 0.89375 | 1.31250 | |||
| 0.71375 | 0.89625 | 1.33750 | |||
| 0.71625 | 0.89875 | 1.36250 | |||
| 0.71875 | 0.90125 | 1.38750 | |||
| 0.72125 | 0.90375 | 1.41250 | |||
| 0.72375 | 0.90625 | 1.43750 | |||
| 0.72625 | 0.90875 | 1.46250 | |||
| 0.72875 | 0.91125 | 1.48750 | |||
| 0.73125 | 0.91375 | 1.51250 | |||
| 0.73375 | 0.91625 | 1.53750 | |||
| 0.73625 | 0.91875 | 1.56250 | |||
| 0.73875 | 0.92125 | 1.58750 | |||
| 0.74125 | 0.92375 | 1.61250 | |||
| 0.74375 | 0.92625 | 1.63750 | |||
| 0.74625 | 0.92875 | 1.66250 | |||
| 0.74875 | 0.93125 | 1.68750 | |||
| 0.75125 | 0.93375 | 1.71250 | |||
| 0.75375 | 0.93625 | 1.73750 | |||
| 0.75625 | 0.93875 | 1.76250 | |||
| 0.75875 | 0.94125 | 1.78750 | |||
| 0.76125 | 0.94375 | 1.81250 | |||
| 0.76375 | 0.94625 | 1.83750 | |||
| 0.76625 | 0.94875 | 1.86250 | |||
| 0.76875 | 0.95125 | 1.88750 | |||
| 0.77125 | 0.95375 | 1.91250 | |||
| 0.77375 | 0.95625 | 1.93750 | |||
| 0.77625 | 0.95875 | 1.96250 | |||
| 0.77875 | 0.96125 | 1.98750 | |||
| 0.78125 | 0.96375 | 2.01250 | |||
| 0.78375 | 0.96625 | 2.03750 | |||
| 0.78625 | 0.96875 | 2.06250 | |||
| 0.78875 | 0.97125 | 2.08750 | |||
| 0.79125 | 0.97375 | 2.11250 | |||
| 0.79375 | 0.97625 | 2.13750 | |||
| 0.79625 | 0.97875 | 2.16250 | |||
| 0.79875 | 0.98125 | 2.18750 | |||
| 0.80125 | 0.98375 | 2.21250 | |||
| 0.80375 | 0.98625 | 2.23750 | |||
| 0.80625 | 0.98875 | 2.26250 | |||
| 0.80875 | 0.99125 | 2.28750 | |||
| 0.81125 | 0.99375 | 2.31250 | |||
| 0.81375 | 0.99625 | 2.33750 | |||
| 0.81625 | 0.99875 | 2.36250 | |||
| 0.81875 | 1.00125 | 2.38750 | |||
| 0.82125 | 1.00375 | 2.41250 | |||
| 0.82375 | 1.00625 | 2.43750 | |||
| 0.82625 | 1.00875 | 2.46250 | |||
| 0.82875 | 1.01125 | 2.48750 | |||
| 0.83125 | 1.01375 | 2.51250 | |||
| 0.83375 | 1.01625 | 2.53750 | |||
| 0.83625 | 1.01875 | 2.56250 | |||
| 0.83875 | 1.02125 | 2.58750 | |||
| 0.84125 | 1.02375 | 2.61250 | |||
| 0.84375 | 1.02625 | 2.63750 | |||
| 0.84625 | 1.02875 | 2.66250 | |||
| 0.84875 | 1.03125 | 2.68750 | |||
| 0.85125 | 1.03375 | 2.71250 | |||
| 0.85375 | 1.03625 | 2.73750 | |||
| 0.85625 | 1.03875 | 2.76250 | |||
| 0.85875 | 1.04125 | 2.78750 | |||
| 0.86125 | 1.04375 | 2.81250 | |||
| 0.86375 | 1.04625 | 2.83750 | |||
| 0.86625 | 1.04875 | 2.86250 | |||
| 0.86875 | 1.06250 | 2.88750 | |||
| 0.87125 | 1.08750 | 2.91250 | |||
| 0.87375 | 1.11250 | 2.93750 | |||
| 0.87625 | 1.13750 | 2.96250 | |||
| 0.87875 | 1.16250 | 2.98750 | |||
| 0.88125 | 1.18750 |
In order to calculate the contribution to , the cross section including FSR, , is obtained by the formula
| (9) |
where is the fine-structure constant, and is the FSR correction factor from Ref. c_FSRamu . Using the cross section as input for Eq. (1), the contribution to from the process is calculated to be . This result is larger than previous calculations c_thomas_2018 which are using both measurement and fits. However, the difference is less than 2.
IX Summary
Based on of collision data taken at with the BESIII detector, is studied using the ISR method. The cross section of is obtained for from 0.7 to , and is calculated to be . This is the first calculation using data from a single experiment, and the uncertainty of is reduced by 40%. In this energy region, a clear indication of the around is found. This agrees with BABAR c_g3pi_babar but is significantly higher than the DM2 c_3pi_dm2 result. The 3 mass spectrum below can be well described by the coherent sum of the resonances , , and . Product branching fractions are extracted from the fit and are consistent with both the PDG c_pdg2014 values and the BABAR c_g3pi_babar result. A study of is performed with untagged data above . The branching fraction is calculated, showing good agreement with previous results c_g3pi_babar ; c_3pi_bes ; c_3pi_bes3 with slightly improved precision.
Acknowledgement
The BESIII collaboration thanks the staff of BEPCII and the IHEP computing center for their strong support. This work is supported in part by National Key Basic Research Program of China under Contract No. 2015CB856700; National Natural Science Foundation of China (NSFC) under Contracts Nos. 11625523, 11635010, 11735014, 11822506, 11835012; the Chinese Academy of Sciences (CAS) Large-Scale Scientific Facility Program; Joint Large-Scale Scientific Facility Funds of the NSFC and CAS under Contracts Nos. U1532257, U1532258, U1732263, U1832207; CAS Key Research Program of Frontier Sciences under Contracts Nos. QYZDJ-SSW-SLH003, QYZDJ-SSW-SLH040; 100 Talents Program of CAS; INPAC and Shanghai Key Laboratory for Particle Physics and Cosmology; ERC under Contract No. 758462; German Research Foundation DFG under Contracts Nos. Collaborative Research Center CRC 1044, FOR 2359; Istituto Nazionale di Fisica Nucleare, Italy; Koninklijke Nederlandse Akademie van Wetenschappen (KNAW) under Contract No. 530-4CDP03; Ministry of Development of Turkey under Contract No. DPT2006K-120470; National Science and Technology fund; STFC (United Kingdom); The Knut and Alice Wallenberg Foundation (Sweden) under Contract No. 2016.0157; The Royal Society, UK under Contracts Nos. DH140054, DH160214; The Swedish Research Council; U. S. Department of Energy under Contracts Nos. DE-FG02-05ER41374, DE-SC-0010118, DE-SC-0012069; University of Groningen (RuG) and the Helmholtzzentrum fuer Schwerionenforschung GmbH (GSI), Darmstadt.
References
- (1) G. W. Bennett, et al. , Phys. Rev. Lett. 92, 161802 (2004).
- (2) M. Davier, A. Hoecker, B. Malaescu and Z. Zhang, Eur. Phys. J. C77, 827 (2017) [arXiv:1706.09436 [hep-ph]]; A. Keshavarzi, D. Nomura, and T. Teubner, Phys. Rev. D97, 114025 (2018); M. Hoferichter, B. L. Hoid and B. Kubis, JHEP 1908, 137 (2019) [arXiv:1907.01556 [hep-ph]]; M. Hoferichter, B. L. Hoid, B. Kubis, S. Leupold and S. P. Schneider, Phys. Rev. Lett. 121, 112002 (2018) [arXiv:1805.01471 [hep-ph]].
- (3) J. Grange et al. (Muon g-2 Collaboration), FERMILAB-FN-0992-E, FERMILAB-DESIGN-2014-02, arXiv:1501.06858.
- (4) Muon g-2/EDM experiment at J-PARC, http: //g-2.kek.jp/portal/index.html.
- (5) S. J. Brodsky, E. de Rafael, Phys. Rev. 168, 1620 (1968).
- (6) M. Tanabashi et al. (Particle Data Group), Phys. Rev. D98, 030001 (2018).
- (7) M. N. Achasov et al. , Phys. Rev. D68, 052006 (2003); Phys. Rev. D66, 032001 (2002);V. M. Aulchenko et al. ,JETP 148, p. 34 (2015).
- (8) R. R. Akhmetshin et al. , Phys. Lett. B476, 33 (2000); Phys. Lett. B434, 426 (1998).
- (9) B. Aubert et al. (BABAR Collaboration), Phys. Rev. D70, 072004 (2004).
- (10) A. Antonelli et al. (DM2 Collaboration), Z. Phys. C56, 15 (1992).
- (11) G. Amelino-Camelia et al. (KLOE-2 Collaboration), Eur. Phys. J. C68, 619 (2010).
- (12) B. Aubert et al. (BABAR Collaboration), Nucl. Inst. Meth. A479, 1 (2002).
- (13) M. Ablikim et al. (BESIII Collaboration), Phys. Lett. B753, 629-638 (2016).
- (14) M. Ablikim et al. (BESIII Collaboration), Nucl. Inst. Meth. A614, 345 (2010).
- (15) C. H. Yu et al. , Proceedings of IPAC2016, Busan, Korea, 2016, doi:10.18429/JACoW-IPAC2016-TUYA01.
- (16) M. Ablikim et al. (BESIII Collaboration), Chin. Phys. C37, 123001 (2013); Phys. Lett. B753, 629 (2016).
- (17) S. Agostinelli et al. (GEANT4 Collaboration), Nucl. Inst. Meth. A506, 2003 (250).
- (18) H. Czyż, M. Gunia, J. H. Kühn, JHEP 1308, 110 (2013) [arXiv:1306.1985 [hep-ph]].
- (19) S. Jadach, B. F. L. Ward and Z. Was, Comput. Phys. Commun. 130, 260 (2000); Phys. Rev. D63, 113009 (2001).
- (20) D. J. Lange, Nucl. Inst. Meth. A462, 152 (2001).
- (21) R. G. Ping, Chin. Phys. C 32, 599 (2008).
- (22) J. C. Chen, G. S. Huang, X. R. Qi, D. H. Zhang and Y. S. Zhu, Phys. Rev. D62, 034003 (2000).
- (23) E. Barberio, B. van Eijk and Z. Was, Comput. Phys. Commun. 66, 115 (1991).
- (24) B. Malaescu, [arXiv:1106.3107v1 [physics.data-an]].
- (25) B. Aubert et al. (BABAR Collaboration), Phys. Rev. D76, 092005 (2007).
- (26) L. Lonnblad, Comput. Phys. Commun. 84, 307-316 (1994).
- (27) E. A. Kuraev and V. S. Fadin, Yad. Fiz. 41, 733-742 (1985).
- (28) M. N. Achasov et al. (SND Collaboration), Phys. Rev. D68, 052006 (2003).
- (29) A. B. Clegg and A. Donnachie, Z. Phys. C62, 455 (1994).
- (30) J. Z. Bai et al. (BES Collaboration), Phys. Rev. D70, 012005 (2004).
- (31) M. Ablikim et al. (BESIII Collaboration), Phys. Lett. B710, 594-599 (2012).
- (32) F. Ignatov, talk “Calculation of the VP effects with pro mille accuracy” in The 4th Meeting of the Working Group on Rad. Corrections and MC Generators for Low Energies [http://cmd.inp.nsk.su/~ignatov/vpl/].
- (33) K. Melnikov, Int. J. Mod. Phys. A 16, 4591-4612 (2001) [arXiv:hep-ph/0105267v2].