MarsQE: Semantic-Informed Quality Enhancement for Compressed Martian Image
Abstract
Lossy image compression is essential for Mars exploration missions, due to the limited bandwidth between Earth and Mars. However, the compression may introduce visual artifacts that complicate the geological analysis of the Martian surface. Existing quality enhancement approaches, primarily designed for Earth images, fall short for Martian images due to a lack of consideration for the unique Martian semantics. In response to this challenge, we conduct an in-depth analysis of Martian images, yielding two key insights based on semantics: the presence of texture similarities and the compact nature of texture representations in Martian images. Inspired by these findings, we introduce MarsQE, an innovative, semantic-informed, two-phase quality enhancement approach specifically designed for Martian images. The first phase involves the semantic-based matching of texture-similar reference images, and the second phase enhances image quality by transferring texture patterns from these reference images to the compressed image. We also develop a post-enhancement network to further reduce compression artifacts and achieve superior compression quality. Our extensive experiments demonstrate that MarsQE significantly outperforms existing approaches for Earth images, establishing a new benchmark for the quality enhancement on Martian images.
Index Terms:
Martian images, quality enhancement, compressed images, deep learning.I Introduction
Recently, there has been growing interest in Mars exploration, due to the similarity between Mars and Earth [1, 2]. For example, from 2020 onwards, the NASA’s Perseverance Mars rover and the Chinese TianWen-1 rover have successfully landed on Mars. These rovers have captured a lot of valuable images, e.g., images of the Martian terrain, which are crucial for scientific research of Mars. To address the challenge of images transmission from Mars to Earth given the limited bandwidth and energy, the lossy image compression techniques, such as Joint Photographic Experts Group (JPEG) [3], have been employed in the Mars Rover’s encoder [4, 5, 6]. However, the compression process inevitably incurs compression artifacts, e.g., ringing, blocking and blurring effects [7], which severely degrade the quality of Martian images. Figure 1 shows an example of compressed Martian image captured by the TianWen-1 rover. As can be observed in this figure, the compression artifacts pose a significant challenge for geologic scientists in their analysis of the Martian surface. To address this issue, a feasible solution is to leverage the abundant computational resources available in Earth stations to enhance the quality of compressed Martian images.

Meanwhile, the past few years have witnessed many approaches for quality enhancement on compressed images captured on Earth [8, 9, 10, 11, 12]. Specifically, the Resource-efficient Blind Quality Enhancement (RBQE) approach [10] is designed, trained and evaluated over the DIVerse 2K (DIV2K) dataset [13], which includes eight diverse categories of content on Earth, i.e., people, flora & fauna, handmade, cityscapes, landscapes, indoor, outdoor, and underwater. However, Martian images are significantly different from Earth images, and possess much fewer semantics, as illustrated in Figure 2. Two main characteristics of Martian images can be observed in this figure. (1) Martian images display notably greater inter-image and intra-image similarities compared with Earth images. (2) Martian images exhibit more compact texture representation characterized by a limited number of semantic classes compared with Earth images. These characteristics are not applicable to Earth images, since the Earth images display a substantial diversity in texture patterns and semantics. Consequently, the existing quality enhancement approaches designed for Earth images are inadequate for enhancing the quality of Martian images.
In this paper, we propose a novel approach for enhancing the quality of compressed Martian images by considering two characteristics discussed above. First, we analyze the Martian Image Compression (MIC) dataset [14] to obtain the findings about these two characteristics. Based on our findings, we propose a Martian images quality enhancement approach, named MarsQE. Specifically, our MarsQE approach is designed with a two-stage quality enhancement network that utilizes notably greater pixel similarity within Martian images. At the first stage, our network transfers texture features of pre-matched reference patches to restore texture details of compressed images in a patch-wise manner, such that the inter-image similarities can be utilized for quality enhancement. Here, the Semantic-based Matching Module (SMM) is developed to search the reference patches across training images. At the second stage, our network leverages similar texture features of distinct regions to reduce block effects and furthermore restore details, such that the intra-image similarities can be utilized. Finally, we conduct extensive experiments on Martian image datasets to validate the state-of-the-art performance of our MarsQE approach. In summary, the contributions of this paper are as follows:
-
(1)
We conduct comprehensive analyses and present two key findings on Martian images, i.e., semantic-based similarity and compact texture representation. Theses findings are pivotal for quality enhancement and serve as the foundation of our MarsQE approach.
-
(2)
We propose a novel MarsQE approach for enhancing the quality of compressed Martian images. In this task, the framework of MarsQE can effectively leverage the semantic-based texture similarity in Martian images through semantic-based reference matching and semantic-informed quality enhancement.
-
(3)
We conduct extensive experiments to validate the state-of-the-art performance of our MarsQE approach. We also verify its generalization capability on the Martian images from several Martian missions, e.g., Mars Science Laboratory (MSL) mission, without fine-tuning MarsQE, demonstrating the robustness of our approach.

II Related Works
II-A Quality Enhancement for Earth Images
Recently, extensive works [8, 15, 16, 9, 17, 10, 18, 11] have reached remarkable performance for enhancing the quality of Earth images, due to the booming development of Convolutional Neural Networks (CNNs). Concretely, as the pioneer of CNN-based approach, a shallow four-layer Artifacts Reduction Convolutional Neural Network (AR-CNN) [8] was proposed to enhance the quality of JPEG-compressed images. AR-CNN processively performs feature extraction, feature enhancement, feature mapping, and image reconstruction. Motivated by dual-domain sparse coding and quantization prior of JPEG compression, the Deep Dual-Domain (D3) [15] approach and Deep Dual-domain Convolutional neural Network (DDCN) [16] were proposed to mitigate JPEG compression artifacts. To be more specific, D3 and DDCN improve the quality of compressed images by incorporating Discrete Cosine Transform (DCT) priors into network branches. Notably, as a milestone of CNN-based approaches, Denoising Convolutional Neural Network (DnCNN) [9] was proposed, which utilizes some effective techniques including the residual learning [19] and batch normalization [20]. With a 20-layer deep network, DnCNN can remove both Additive White Gaussian Noise (AWGN) and JPEG artifacts, surpassing most traditional approaches such as Block Matching and 3-D filtering (BM3D) [21]. Afterwards, Liu et al. [17] presented a Multi-level Wavelet CNN (MWCNN) by utilizing Discrete Wavelet Transform (DWT) and Inverse Wavelet Transform (IWT). Specifically, DWT and IWT are introduced to replace pooling and upsampling operations to enlarge receptive field.
More recently, Xing et al. [10] proposed a RBQE approach for the purpose of enhance quality in a resource-efficient manner. By utilizing dynamic inference structure, RBQE approach can effectively and efficiently remove both compressed artifacts. Guo et al. [18] proposed Convolutional Blind Denoising Network (CBDNet) to improve the generalization capability for real-world degradations. The CBDNet was designed with an estimation subnetwork and a non-blind denoising subnetwork, such that effective blind quality enhancement can be achieved. Later, the Defocus-Aware Quality Enhancement (DAQE) approach [11] was proposed to improve the quality of compressed images with a region-wise divide-and-conquer strategy, which utilizes image defocus to discern region-wise quality differences.
The aforementioned quality enhancement approaches for Earth images have employed datasets such as Berkeley Segmentation Data Set and Benchmarks 500 (BSDS500) [22] and DIV2K [13]. These datasets comprise a large variety of contents with natural and artificial scenes, e.g., plants, man-made objects, cityscapes, etc. With these datasets, the aforementioned approaches can take advantage of the rich semantics in Earth images. In fact, different from Earth images, Martian images have limited semantics due to the simpler scene. Therefore, we propose utilizing the limited-semantic characteristics to enhance the quality of Martian images.

II-B Vision Works for Martian Images
Some vision works have been conducted on Martian images to assist Mars exploration. These vision works mainly focus on high-level vision tasks [23, 24, 25, 26], including terrain classification and semantic segmentation. Specifically, Michael et al. [23] employed a deep CNN architecture, called DeepLabV3+, for semantic segmentation on Martian terrain images. The classification accuracy achieves over 96%, showing the potential of auto-driving Mars rovers using deep-learning. To make a step forward, Hu et al. [24] presented a hybrid network (DeepLabV3+/EfficientNet) to further improve the classification accuracy, such that the different areas of Mars can be judged. From the perspective of geological taxonomy, Tejas et al. [25] developed a self-supervised deep clustering algorithm to support rapid and robust terrain categorization. By filtering data with high confidence of labels, Gagan et al. [26] designed SegFormer, a semantic segmentation framework utilizing vision transformer, for segmenting and identifying the terrain images of Mars. In this way, the SegFormer can effectively segment terrain into three categories, i.e., sand, soil, and rock. In addition to the high-level vision works, a few works focus on low-level vision tasks, such as image super-resolution and image compression [27, 14]. Wang et al. [27] addressed the challenge of reconstructing high-resolution Martian images from low-resolution ones by estimating the blur kernels. Specifically, they proposed a novel degradation network specifically designed for Martian images. Ding et al. [14] proposed a deep Martian image compression network with a non-local block to explore both local and non-local dependencies among Martian image patches.
To the best of our knowledge, no prior work has been dedicated to the vital task of enhancing the quality of Martian images. This becomes particularly significant for geologic analysis and science popularization, since Martian images invariably undergo compression for transmission, leading to the presence of noticeable artifacts [4]. Therefore, this paper makes the pioneering effort of enhancing the quality of Martian images. Moreover, by leveraging the distinct and limited semantics inherent to Martian images, this paper effectively enhances the quality of Martian images, which may inspire further advancement in the domain of Martian vision processing.
| Size | ||||
|---|---|---|---|---|
| Data | Mars | Earth | Mars | Earth |
| NCC | 0.73/0.87 | 0.01/0.64 | 0.75/0.90 | 0.01/0.71 |
| MAE | 39.28/18.26 | 82.30/27.05 | 38.82/16.36 | 82.29/21.11 |
| RMSE | 32.06/13.05 | 95.85/35.89 | 32.11/11.81 | 94.34/28.29 |
| Size | ||||
|---|---|---|---|---|
| Data | Mars | Earth | Mars | Earth |
| NCC | 0.75/0.85 | 0.12/0.55 | 0.77/0.87 | 0.14/0.66 |
| MAE | 25.16/15.58 | 67.53/30.22 | 25.29/13.97 | 67.20/22.56 |
| RMSE | 32.23/21.28 | 81.29/41.25 | 31.88/18.98 | 79.16/31.03 |
III Findings
This section presents our findings on spatial similarity and texture characteristics of Martian images in comparison with Earth images. We first investigate the inter-image and intra-image similarities inherent in Martian images, which notably surpass those in Earth images. Then, we investigate the texture patterns of Martian images, and find that their regions can be categorized into a few texture-distinct classes based on semantics. These findings motivate our quality enhancement approach for Martian images, in particular the reference-based and semantic-informed quality enhancement as introduced in the next section.
Finding 1: Martian images display significantly higher levels of both inter-image and intra-image similarity in comparison to Earth images.
Analysis: Our analysis is based on the Martian images from the MIC dataset [14] and the Earth images from the DIV2K dataset [13]. To assess inter-image similarity, we partition all images into non-overlapping patches with sizes of ; Subsequently, we pair patches from different images and assess their similarity using Mean Absolute Error (MAE), Root Mean Squared Error (RMSE), and Normalized Correlation Coefficient (NCC). For the evaluation of intra-image similarity, we pair patches from the same image and assess them using the same similarity metrics.
The evaluation results are shown in Figure 3. Note that smaller MAE/RMSE values and higher NCC values signify a higher degree of similarity between two image patches. As seen in Figure 3, Martian image patches exhibit significantly higher similarity compared to Earth images, for both inter-image and intra-image comparisons. For instance, the average inter-image RMSE for Martian images stands at 40, representing only 40.8% of the corresponding value for Earth images (i.e., 98). Similarly, the average intra-image RMSE for Martian images is 33, accounting for just 40.7% of the corresponding value for Earth images (i.e., 81). We also conduct analysis on patches with sizes of and . As shown in Table I, similar trends are observed across other metrics and patch sizes. In conclusion, it is evident that Martian images exhibit markedly greater inter-image and intra-image similarity, compared with Earth images. This concludes the analysis of Finding 1.

Finding 2: Compared with Earth images, Martian images exhibit a higher degree of compactness in their texture representation.
Analysis: For both Martian and Earth images, we employ the widely-recognized texture descriptor, i.e., Local Binary Pattern (LBP) [28], to capture texture patterns from image patches. Subsequently, we project the high-dimensional LBP textures to a two-dimensional feature space using Principal Component Analysis (PCA) [29], which extracts the two most significant and representative textural features, denoted by PC-1 and PC-2. Consequently, this two-dimensional feature space serves as a powerful representation for Martian and Earth texture patterns. As depicted in Figure 4, the texture representation of Martian images is noticeably more concentrated compared to that of Earth images. Furthermore, we provide a frequency histogram of the texture representation in this figure. Specifically, the Martian texture representation exhibits only 36.3% and 44.9% of the range observed in Earth texture representation along the PC-1 and PC-2 dimensions, respectively. These results indicate that the texture representations of Martian images are more compact than those of Earth images. This concludes the analysis of Finding 2.
Finding 3: By leveraging the semantic classification, the regions of Martian images can be categorized into a limited number of texture-distinct semantic classes.

Analysis: Finding 2 highlights the simpler texture representation of Martian images compared to Earth images. Building upon this insight of Finding 2, we delve deeper to explore the potential categorization of Martian regions into texture-distinct semantic classes. Following existing works on Martian terrain segmentation [23, 26], we first categorize Martian regions into four semantic classes, i.e., sand, soil, rock, and sky, as illustrated in Figure 5 (a). Subsequently, we measure the average texture dissimilarity between patches belonging to the same or different semantic classes, by evaluating their Jensen–Shannon (JS) divergence of LBP patterns. Note that a smaller JS divergence value indicates a higher similarity of the texture patterns between two patches. Figure 5 (b) illustrates that the JS divergence values between patches from different semantic classes are notably greater than those between patches from the same class. For instance, the average JS divergence value between two patches categorized as rock is 0.017, which is 96.2% lower than the corresponding value between two patches from the sky and rock categories (i.e., 0.452). Therefore, we can conclude that Martian images can be effectively represented by a small number of semantic classes that exhibit distinct texture patterns. Finally, the analysis of Finding 3 is accomplished.

IV Proposed Approach
In this section, we propose the MarsQE approach for enhancing the quality of compressed Martian images. Leveraging the similarity among Martian images as observed in our findings, MarsQE consists of two primary steps: 1) Semantic-based reference matching (Section IV-A) and 2) Semantic-informed quality enhancement (Section IV-B). Additionally, a post-enhancement network is proposed to further mitigate blocking artifacts and refine texture details (Section IV-C). Figure 6 shows the overall framework of our MarsQE approach. More details are presented in the following.
IV-A Semantic-based Reference Matching
Given the significant inter-image similarity in Martian images (as noted in Finding 1), MarsQE take advantages of texture-similar reference images for quality enhancement. As shown in the dot-dash box of Figure 6, the Semantic-based Matching Module (SMM) is designed to efficiently obtain these reference images.
Reference dictionary construction: Findings 2 and 3 reveal that Martian images can be efficiently categorized into a few texture-distinct semantic classes. Inspired by this characteristic, SMM constructs a compact but comprehensive semantic-based dictionary. Specifically, SMM first divides the raw images into non-overlapping patches. Then, these patches are categorized into semantic classes, utilizing Martian terrain segmentation [26]. Finally, for the -th semantic class where ranges from to , SMM selects patches to construct a reference dictionary . The corresponding compressed patches are also included for reference.
Reference patch matching: SMM conducts patch-wise reference matching using the obtained reference dictionary. Specifically, the input compressed image is divided into non-overlapping patches. Each compressed patch is semantically classified and matched with the appropriate patches in the same-semantic-class dictionary. The matching process is formulated as:
| (1) |
In the above formulation, denotes the Kullback-Leibler (KL) divergence [30] between vectors and ; denotes the LBP [28] texture descriptor. As a result, the semantically consistent reference patches and are selected for each compressed patch as and , respectively.


IV-B Semantic-informed Quality Enhancement
Given the obtained raw and compressed reference patches, the MarsQE approach performs semantic-informed quality enhancement in a patch-wise manner. According to Findings 2 and 3, patches from the same semantic classes exhibit similar texture patterns. Thus, MarsQE uses semantic-related textures from reference patches to guide the enhancement of input patches. Specifically, the overall network is designed with a -level encoder-decoder architecture. The network initially extracts transferable features with semantic-related textures at various scales, and then fuses these features with decoded features to restore texture details. Finally, the fused features are enhanced through the Supervised Attention Module (SAM) [31], allowing for efficient feature propagation to the post-enhancement network.
Semantic-related texture extraction: In fact, reference patches are rich in semantic-related texture details, crucial for enhancing the quality of input compressed patches. As depicted in the yellow box of Figure 6, the network employs an encoder to extract multi-scale semantic-related textures from the compressed input, raw reference, and compressed reference patches. The extraction flows for these patches are represented by blue, yellow, and red lines, respectively. Texture Extracting Modules (TEMs) are integral to this process, designed to extract transferable features at each scale. Consider one input patch for example as shown in Figure 7(a). The encoded features of , , and , denoted as , , and , are fed into TEM as query, key and value. TEM unfolds these features into non-overlapping feature blocks, resulting in , , and . For each block , TEM identifies the most relevant block in as follows,
| (2) | |||
| (3) |
where indicates the index and represents the similarity score. The transferable feature blocks are then generated from :
| (4) |
Finally, we aggregate to form the transferable features , thereby extracting the semantic-related textures.
Semantic-related texture fusion: After extracting the semantic-related textures, the learnable decoder employs these textures to enrich the decoded feature. This process is visually detailed in the red box of Figure 6. At each decoder level, the decoded features are up-sampled and combined with corresponding encoded features via skip connections. These features are then fused with the extracted transferable features using the Texture Fusing Module (TFM), as depicted in Figure 7(b). TFM initially calculates the residual , which represents the difference between transferable features and decoded features . Subsequently, TFM generates attention maps to filter informative features from for subsequent fusion. The process culminates with the fusion of and the filtered features, output through a convolution layer, resulting in the fused features . Mathematically, the above process is represented by
| (5) |
In the above, represents a convolution layer with a kernel size of , and signifies a channel attention layer [32]. At the output side of the network, the final decoded features are spatially recombined to the input image size and fed into SAM [31] to generate an enhanced image . This way, the semantic-related textures from reference patches are effectively utilized to produce a semantically enriched enhanced image.
IV-C Post-enhancement of MarsQE
The main network of MarsQE has produced a high-quality enhanced image. In addition, we develop a post-enhancement network to mitigate blocking effects caused by patch-wise enhancement, such that semantic details can be enriched. It is also designed with an encoder-decoder architecture. In the encoder stage, the features from the main network are combined with the encoded features of the input compressed image . These features are further refined at each level by the Quality Enhancement Module (QEM), as illustrated in Figure 7(c). QEM is mainly composed of Layer Normalization (LN) [33], Gaussian Error Linear Unit (GELU) [34], and Channel Attention (CA) [32].
To exploit the intra-image similarity in Martian images (highlighted in Finding 1), the network incorporates the Non-Local Module (NLM) for each compressed image. Given the texture-distinct semantic classes obtained in Section IV-A, we apply NLMs within each semantic class, significantly accelerating the post-enhancement process. The functionality of NLM is mathematically represented as
| (6) |
Here, and represent the input and output features of NLM, respectively. The notations , , , and correspond to a convolution layer with a kernel size of , a non-local attention layer, a LN layer, and a GELU activation layer, respectively. The features produced by NLM are then fed into the decoder, resulting in a final enhanced image , exhibiting higher quality than . The overall framework of MarsQE is trained in an end-to-end manner with the loss function of Mean Squared Error (MSE) between the ground truth image and two enhanced images:
| (7) |
In summary, our MarsQE approach effectively enhances the quality of compressed Martian images by leveraging semantic-related intra- and inter-image similarities.
V Experiment
V-A Experimental Setup
In this section, we present details about the datasets, hyper-parameters, and training strategy of our experiments for evaluating the effectiveness of MarsQE.
Martian image datasets. Several Martian image datasets [23, 35, 14] have been established through the cameras mounted on Mars rovers. In particular, Mars32K [35] consists of 32,368 color Martian images collected by the Curiosity rover. Moreover, a notable large-scale labeled dataset, AI4MARS [23], collects over 35K images from the Curiosity, Opportunity, and Spirit rovers of NASA. With crowd-sourced labels annotated by the rover planners and scientists, AI4MARS was proposed as a high-quality dataset for training and evaluating models for terrain classification on Mars. Recently, Ding et al. [14] have presented a Martian image dataset, i.e., MIC, which consists of high-resolution and large-scale Martian color images captured by the latest Perseverance rover [36]. Specifically, the MIC dataset comprises 3,860 raw colorful Martian images captusred by the left Mastcam-Z camera on the Perseverance rover, all at a resolution of . These images are randomly divided into 3,088 images for training, 386 images for validation, and 386 images for testing. As detailed in Table II, we adopt the training, validation, and test sets of MIC as the same usage in our experiments. Moreover, the AI4MARS and Mars32K datasets are used as our test sets, since they have no ground-truth images and can only be used for qualitative evaluation.
Martian image compression. The image compression codec of JPEG [3] has been widely used for Martian images transmission in recent missions, e.g., MSL mission [4]. Therefore, our experiments mainly focus on enhancing the quality of JPEG-compressed Martian images. In addition, we include the High-Efficiency Video Coding with Main Still image Profile (HEVC-MSP)/Better Portable Graphics (BPG) [37, 38] codec for Martian image compression, considering its prevalence in quality enhancement approaches for natural images [39, 40, 10, 11, 41].
We adopt four compression settings for each codec, with the quality factor (QF) being 20, 30, 40, and 50 for JPEG, and the quantization parameter (QP) being 27, 32, 37, and 42 for BPG. Note that these settings have also been adopted by prevalent quality enhancement approaches for natural images.
Hyper-parameters and training. In the MarsQE approach, parameters , , and are set to 128, 4, and 3, respectively. All convolution operators are with a stride of 1 and a padding of 1. To classify the input patches, we adopt an off-the-shelf Transformer-based method for Martian terrain segmentation [26]. This method classifies image patches into 4 classes, and the parameter is thus set to 4. When constructing the dictionary for reference matching, we select 6 patches for each semantic class; therefore, the parameters are all set to 6. As for the loss function, we set to 1. During the training process, the Adam [42] optimizer is applied with an initial learning rate of . The cosine annealing schedule [43] is also applied to automatically decrease the learning rate. We set the training batch size to 16. A workstation with one CPU (12th Gen Intel Core i9-12900KF) and four GPUs (NVIDIA GeForce RTX 4090) is adopted in our experiments.
V-B Evaluation
We evaluate the performance of our MarsQE approach on the quality enhancement of compressed Martian images. Since there exist no quality enhancement approaches for Martian images, we compare MarsQE with widely-used approaches for natural images, including AR-CNN [8], DCAD [39], DnCNN [9], CBDNet [18], RBQE [10], and DAQE [11]. For fair comparison, all approaches are re-trained on our training set in a non-blind manner, i.e., one model is trained for each compression setting.
| JPEG | BPG | ||||||||||
|---|---|---|---|---|---|---|---|---|---|---|---|
| Approach | PSNR | PSNR-B | SSIM | MS-SSIM | LPIPS | Approach | PSNR | PSNR-B | SSIM | MS-SSIM | LPIPS |
| QF | 31.10 | 29.26 | 0.822 | 0.928 | 0.318 | QP | 30.33 | 30.19 | 0.755 | 0.900 | 0.439 |
| AR-CNN | 32.43 | 32.14 | 0.840 | 0.948 | 0.272 | AR-CNN | 30.67 | 30.66 | 0.758 | 0.906 | 0.383 |
| DCAD | 32.75 | 32.33 | 0.847 | 0.951 | 0.252 | DCAD | 30.77 | 30.74 | 0.759 | 0.907 | 0.374 |
| DnCNN | 32.78 | 32.41 | 0.847 | 0.951 | 0.252 | DnCNN | 30.80 | 30.76 | 0.760 | 0.907 | 0.373 |
| RBQE | 33.06 | 32.64 | 0.852 | 0.954 | 0.237 | RBQE | 31.02 | 30.96 | 0.766 | 0.911 | 0.359 |
| CBDNet | 33.14 | 32.75 | 0.854 | 0.955 | 0.230 | CBDNet | 31.07 | 31.00 | 0.768 | 0.912 | 0.357 |
| DAQE | 33.03 | 32.63 | 0.850 | 0.953 | 0.243 | DAQE | 30.98 | 30.92 | 0.764 | 0.910 | 0.364 |
| MarsQE | 33.36 | 32.96 | 0.857 | 0.957 | 0.223 | MarsQE | 31.21 | 31.13 | 0.772 | 0.915 | 0.346 |
| QF | 32.44 | 30.54 | 0.859 | 0.951 | 0.253 | QP | 32.21 | 31.96 | 0.835 | 0.940 | 0.319 |
| AR-CNN | 33.63 | 33.15 | 0.875 | 0.963 | 0.214 | AR-CNN | 32.66 | 32.57 | 0.839 | 0.946 | 0.266 |
| DCAD | 33.98 | 33.43 | 0.881 | 0.965 | 0.197 | DCAD | 32.86 | 32.71 | 0.843 | 0.947 | 0.257 |
| DnCNN | 34.02 | 33.45 | 0.882 | 0.965 | 0.197 | DnCNN | 32.96 | 32.79 | 0.845 | 0.948 | 0.252 |
| RBQE | 34.28 | 33.70 | 0.886 | 0.968 | 0.182 | RBQE | 33.21 | 33.01 | 0.850 | 0.951 | 0.237 |
| CBDNet | 34.36 | 33.82 | 0.888 | 0.968 | 0.178 | CBDNet | 33.26 | 33.06 | 0.852 | 0.951 | 0.234 |
| DAQE | 34.28 | 33.70 | 0.885 | 0.967 | 0.188 | DAQE | 33.20 | 33.00 | 0.849 | 0.950 | 0.244 |
| MarsQE | 34.61 | 34.03 | 0.891 | 0.970 | 0.171 | MarsQE | 33.46 | 33.25 | 0.855 | 0.953 | 0.227 |
| QF | 33.24 | 31.33 | 0.878 | 0.962 | 0.211 | QP | 34.36 | 33.91 | 0.896 | 0.965 | 0.202 |
| AR-CNN | 34.37 | 33.80 | 0.893 | 0.971 | 0.179 | AR-CNN | 35.00 | 34.66 | 0.903 | 0.970 | 0.157 |
| DCAD | 34.82 | 34.12 | 0.901 | 0.973 | 0.160 | DCAD | 35.42 | 34.92 | 0.909 | 0.972 | 0.151 |
| DnCNN | 34.86 | 34.15 | 0.901 | 0.973 | 0.162 | DnCNN | 35.55 | 35.02 | 0.910 | 0.972 | 0.147 |
| RBQE | 35.13 | 34.40 | 0.905 | 0.975 | 0.151 | RBQE | 35.76 | 35.22 | 0.913 | 0.974 | 0.137 |
| CBDNet | 35.22 | 34.54 | 0.906 | 0.975 | 0.148 | CBDNet | 35.90 | 35.44 | 0.915 | 0.975 | 0.135 |
| DAQE | 35.13 | 34.41 | 0.905 | 0.974 | 0.154 | DAQE | 35.78 | 35.28 | 0.913 | 0.974 | 0.142 |
| MarsQE | 35.43 | 34.72 | 0.909 | 0.976 | 0.140 | MarsQE | 36.07 | 35.58 | 0.917 | 0.976 | 0.131 |
| QF | 33.84 | 31.94 | 0.892 | 0.968 | 0.181 | QP | 36.77 | 35.95 | 0.937 | 0.981 | 0.096 |
| AR-CNN | 34.96 | 34.32 | 0.906 | 0.976 | 0.154 | AR-CNN | 37.82 | 36.93 | 0.946 | 0.985 | 0.077 |
| DCAD | 35.47 | 34.67 | 0.914 | 0.977 | 0.138 | DCAD | 38.46 | 37.29 | 0.951 | 0.986 | 0.073 |
| DnCNN | 35.52 | 34.69 | 0.915 | 0.977 | 0.138 | DnCNN | 38.55 | 37.34 | 0.952 | 0.986 | 0.071 |
| RBQE | 35.78 | 34.97 | 0.918 | 0.979 | 0.128 | RBQE | 38.77 | 37.59 | 0.954 | 0.987 | 0.070 |
| CBDNet | 35.92 | 35.10 | 0.920 | 0.979 | 0.122 | CBDNet | 38.89 | 37.91 | 0.954 | 0.987 | 0.068 |
| DAQE | 35.81 | 34.97 | 0.918 | 0.979 | 0.130 | DAQE | 38.75 | 37.58 | 0.953 | 0.987 | 0.072 |
| MarsQE | 36.09 | 35.26 | 0.921 | 0.980 | 0.119 | MarsQE | 39.03 | 38.04 | 0.955 | 0.988 | 0.066 |
Quantitative performance. To quantify the efficacy of our and compared approaches, we measure the performance of quality enhancement in terms of several metrics, including Peak Signal-to-Noise Ratio (PSNR), Peak Signal-to-Noise Ratio including Blocking effects (PSNR-B) [44], Structural Similarity Index Measure (SSIM) [45], Multi-Scale Structural Similarity (MS-SSIM) index [46], and Learned Perceptual Image Patch Similarity (LPIPS) [47]. As shown in Table III, our MarsQE achieves the best performance over the MIC test set in terms of all metrics. Specifically, for the JPEG-compressed Martian images with QF , the average PSNR of MarsQE is 34.61 dB, which is 2.17 dB higher than the JPEG baseline, and 0.25 dB higher than that of the second-best approach. In addition, the average PSNR-B is 34.03 dB, which is 3.49 dB higher than the JPEG baseline, and 0.21 dB higher than that of the second-best approach. Similar results can be found for other QF settings and metrics. For the BPG-compressed Martian images with QP , the average PSNR of MarsQE is 33.46 dB, which is 1.25 dB higher than the BPG baseline, and 0.20 dB higher than that of the second-best approach. In addition, the average PSNR-B is 33.25 dB, which is 1.29 dB higher than the BPG baseline, and 0.19 dB higher than that of the second-best approach. Similar results can be found for other QP settings and metrics. In summary, our MarsQE approach achieves state-of-the-art quality enhancement performance on both JPEG and BPG-compressed Martian images.
| BPP-PSNR | BPP-SSIM | ||||
|---|---|---|---|---|---|
| Approach | JPEG | BPG | Approach | JPEG | BPG |
| AR-CNN | -24.19 | -16.14 | AR-CNN | -15.13 | -6.76 |
| DCAD | -29.60 | -22.70 | DCAD | -19.76 | -10.82 |
| DnCNN | -30.15 | -24.98 | DnCNN | -19.91 | -12.35 |
| CBDNet | -35.74 | -32.05 | CBDNet | -25.04 | -19.00 |
| RBQE | -34.20 | -30.30 | RBQE | -23.44 | -17.45 |
| DAQE | -33.92 | -30.19 | DAQE | -22.49 | -16.49 |
| MarsQE | -38.94 | -35.93 | MarsQE | -27.18 | -22.36 |
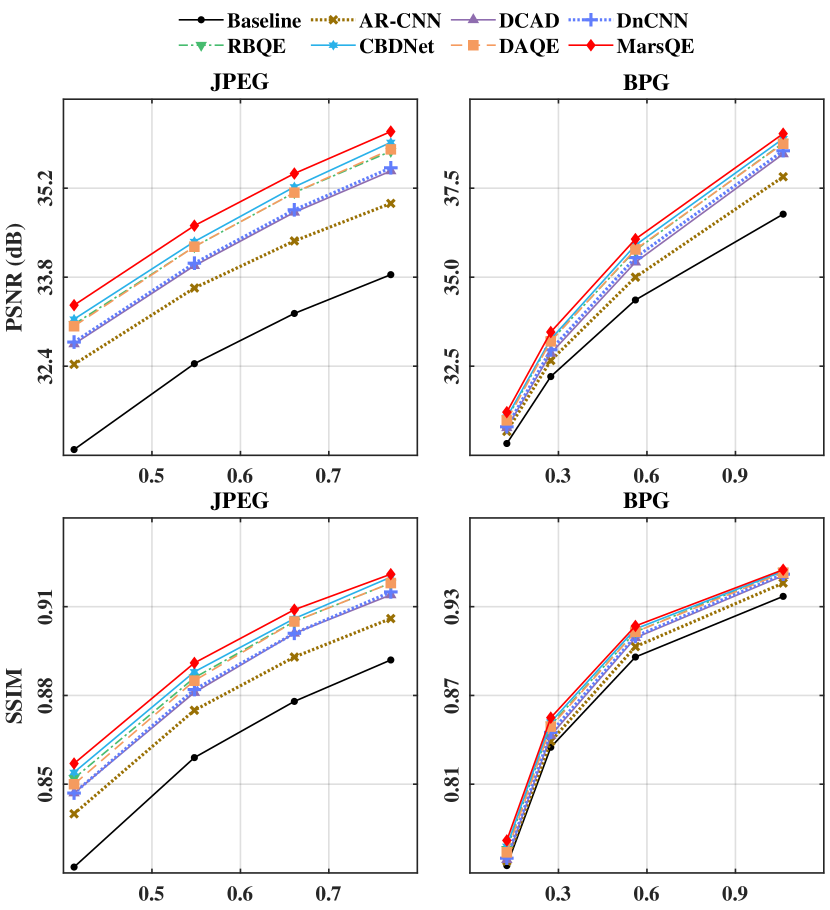
Rate-distortion performance. We further evaluate the rate-distortion performance of our MarsQE approach in Figure 8 and Table IV. Figure 8 shows the rate-distortion curves of different approaches over the MIC test set. As can be seen from this figure, the rate-distortion curves of MarsQE are higher than those of other approaches, indicating a better rate-distortion performance of MarsQE. Then, we quantify the rate-distortion performance by evaluating the reduction of Bjontegaard-rate (BD-rate) [48]. The results are presented in Table IV. As can be seen, for JPEG-compressed Martian images, the BD-rate reductions of our MarsQE approach on the MIC test set are averagely 38.94% and 27.18% with the distortion measured by PSNR and SSIM, respectively, considerably better than other approaches. Similar results can be seen for BPG-compressed Martian images. In summary, our MarsQE approach significantly advances the state-of-the-art rate-distortion performance for quality enhancement on Mars images.


Qualitative performance. Figure 9 compares the visual results of our MarsQE and compared approaches over the MIC test set with ground-truth images. It can be seen in Figure 9, our MarsQE approach successfully restores the ground-truth color and edge texture of Martian surface. To be specific, the color of stones (a) and the edge of sands (b) recovered by our MarsQE are significantly better than those recovered by other enhancement approaches. Besides, our MarsQE approach suppresses the compression artifacts around these edges, while these artifacts can hardly be reduced by other compared approaches. We also present the visual results of residual-to-raw images in Figure 10. It is evident that our MarsQE approach effectively restores the clear sky with the smallest residual values among all approaches. To summarize, our MarsQE approaches outperforms the compared approaches in subjective quality, especially in restoring details and suppressing compression artifacts.

Efficiency. We measure the efficiency of our MarsQE approach in terms of the number of parameters and FLoating point OPerations (FLOPs). Notably, our MarsQE approach outputs an enhanced image without the need for post-processing, as detailed in Section IV-B. This version is referred to as MarsQE-lite. As depicted in Figure 11, MarsQE-lite surpasses the second-best, CBDNet, by 0.08 dB in PSNR while having 67.0% fewer parameters. Even when compared with RBQE and DAQE, which have fewer parameters than CBDNet, MarsQE-lite stands out both in terms of PSNR performance and parameter efficiency. To achieve a higher PSNR improvement, MarsQE further enhances the PSNR score by an additional 0.25 dB using only 26.6% more parameters compared to CBDNet. Although some approaches, like AR-CNN and DCAD, have fewer parameters than both our MarsQE approach and CBDNet, their PSNR performance lags by at least 0.40 dB behind MarsQE-lite and 0.59 dB behind MarsQE, respectively. We also assess computational complexity in terms of FLOPs. Compared to the second-best, CBDNet, our MarsQE-lite achieves a higher PSNR with 10.3% fewer FLOPs, whereas MarsQE achieves a 0.25 dB higher PSNR score with just 30.7% more FLOPs. Specifically, for an input image at a resolution of , CBDNet requires 1.10 TMACs, while MarsQE-lite requires only 0.99 TMACs and MarsQE requires 1.44 TMACs. In summary, our MarsQE-lite approach outperforms other compared approaches in both efficiency and enhancement performance, while our MarsQE secures higher-performance results with a modest increase in computational resources.
V-C Ablation Study
| Module | MarsQE | (A) | (B) | MarsQE-lite | (C) | (D) |
|---|---|---|---|---|---|---|
| TEM | ✓ | ✓ | ✓ | ✓ | ||
| TFM | ✓ | ✓ | ||||
| PSNR (dB) | 34.61 | 34.57 | 34.47 | 34.44 | 34.35 | 34.31 |
Network modules. In our MarsQE approach, we have introduced several crucial components. First, TEM is designed to extract semantic-related texture pattern from reference patches. In addition, TFM is developed to fuse semantic-related texture pattern for quality enhancement. To assess the significance of these reference-based modules, we conduct systematic ablation studies by removing TEM and TFM from the MarsQE framework, resulting in two distinct networks labeled as (A) and (B), as illustrated in Table V. Similarly, we apply a gradual module ablation strategy to the MarsQE-lite approach, generating two additional networks, denoted by (C) and (D). These ablations involved the removal of TEM and the substitution of TFM with a simple addition operator. Following these modifications, we re-train and evaluate all these networks using our dataset compressed by JPEG at QF .
The results, as shown in Table V, reveal that (1) the removal of TFM degrades PSNR by 0.04 dB for MarsQE, and (2) the further removal of TEM leads to an additional PSNR degradation of 0.10 dB. Similar degradation can also be observed for MarsQE-lite. These results indicate that the reference-based modules, i.e., TEM and TFM, positively contribute to the overall performance of image quality enhancement, underscoring their importance in our approach.


Semantics-based reference. During the construction of the reference dictionaries, we introduce four semantically distinct reference dictionaries for MarsQE, encompassing sky, sand, soil, and rock reference patches. To validate the effectiveness of these dictionaries, we adopt each dictionary independently for reference, rather than using all dictionaries collectively. For fair comparison, all validations are performed on our test set compressed by JPEG at QF . The exclusive use of sky, sand, soil, and rock reference dictionaries results in a degradation of PSNR values over our test set from 34.61 to 34.53, 34.57, 34.59, and 34.56 dB, respectively. Moreover, we evaluate the PSNR results for each semantic class of patches. As presented in Figure 12, when the semantic class of patches is consistent with that of dictionary, the PSNR values achieve their highest. The PSNR degradation of semantically mismatched references reaches up to 0.15 dB when sky reference patches are provided to soil test patches (i.e., from 1.98 to 1.83 dB). We also provide visual results with different reference in Figure 13. It can be seen that using reference patches with differing semantics can significantly impair the restoration of color and edges in rocks. In summary, the semantics-based reference pose a positive effect on our semantic-informed quality enhancement in terms of both quantitative and qualitative performance.

V-D Generalization Capability Evaluation
We further validate our MarsQE approach to the datasets beyond the MIC dataset [14], i.e., AI4MARS [23] and Mars32K [35], without fine-tuning the MarsQE network. Recall that MarsQE is trained on the MIC dataset with ground-truth RAW images captured by the Perseverance rover. In comparison, the AI4MARS and Mars32K datasets contain only compressed images captured by Curiosity, Opportunity, and Spirit rovers, without ground-truth counterparts. As a result, this extended validation poses a significant challenge to MarsQE with unseen data that lack ground-truth images and with unknown compression settings. Notably, in AI4MARS, 25.7% of the images, captured by Curiosity’s Navigation camera (Navcam), are grey-scale, posing a further challenge due to the absence of color information.
To be specific, we test our MarsQE model, which is pre-trained on MIC compressed by JPEG with QF , on images from Mars32K and AI4MARS. Given the absence of ground-truth data, we present the qualitative results and no-reference quality assessment results of MarsQE. The qualitative results, as illustrated in Figure 14, underscore MarsQE’s proficiency in suppressing compression artifacts, particularly the ringing effect observed at the boundaries of stones, sand, and rovers. In addition, we evaluate the quality of these images in terms of two widely-used no-reference quality metrics, i.e., Perceptual Index (PI) [49] and Blind/Referenceless Image Spatial Quality Evaluator (BRISQUE) [50]. Note that smaller PI and BRISQUE signify a higher degree of perceptual quality. As shown in Figure 14, both metrics demonstrates the effectiveness of MarsQE on enhancing unseen compressed images with improved quality. To summarize, the MarsQE approach not only showcases its adaptability and robustness through these assessments but also confirms the potential applicability across a spectrum of Martian exploration missions, evidencing a broad generalization capability of our MarsQE approach.
VI Conclusion
In this paper, we have proposed the MarsQE approach for enhancing the quality of compressed Martian images. Specifically, we first obtained two main findings about Martian image by analyzing over a large-scale Martian image dataset, i.e., a notable similarity both within and between images, and compact texture representation characterized by a limited number of semantic classes. Inspired by these findings, we developed the framework of our MarsQE approach with two phases: semantic-based reference matching and semantic-informed quality enhancement. The semantic-based reference matching phase is powered by SMM, which identifies reference images with similar textures based on their semantic content. In the phase of semantic-informed quality enhancement, we implemented TEM and TFM to extract and integrate transferable features, respectively. Additionally, we introduced a post-enhancement network that aims at reducing the blocking artifacts caused by patch-wise enhancement. The experimental results demonstrated the superior performance of our MarsQE approach on the quality enhancement of Martian images.
References
- [1] W. Wan, C. Wang, C. Li, and Y. Wei, “China’s first mission to mars,” Nature Astronomy, vol. 4, no. 7, pp. 721–721, 2020.
- [2] S. S. Board, N. R. Council et al., Vision and voyages for planetary science in the decade 2013-2022. National Academies Press, 2012.
- [3] G. Wallace, “The JPEG still picture compression standard,” IEEE Transactions on Consumer Electronics, vol. 38, no. 1, pp. xviii–xxxiv, 1992. [Online]. Available: https://doi.org/10.1109%2F30.125072
- [4] M. C. Malin, M. A. Ravine, M. A. Caplinger, F. Tony Ghaemi, J. A. Schaffner, J. N. Maki, J. F. Bell III, J. F. Cameron, W. E. Dietrich, K. S. Edgett et al., “The mars science laboratory (msl) mast cameras and descent imager: Investigation and instrument descriptions,” Earth and Space Science, vol. 4, no. 8, pp. 506–539, 2017.
- [5] J. F. Bell III, A. Godber, S. McNair, M. Caplinger, J. Maki, M. Lemmon, J. Van Beek, M. Malin, D. Wellington, K. Kinch et al., “The mars science laboratory curiosity rover mastcam instruments: Preflight and in-flight calibration, validation, and data archiving,” Earth and Space Science, vol. 4, no. 7, pp. 396–452, 2017.
- [6] Q. Meng, D. Wang, X. Wang, W. Li, X. Yang, D. Yan, Y. Li, Z. Cao, Q. Ji, T. Sun et al., “High resolution imaging camera (hiric) on china’s first mars exploration tianwen-1 mission,” Space Science Reviews, vol. 217, pp. 1–29, 2021.
- [7] M.-Y. Shen and C.-C. Kuo, “Review of postprocessing techniques for compression artifact removal,” Journal of Visual Communication and Image Representation, vol. 9, no. 1, pp. 2–14, mar 1998. [Online]. Available: https://doi.org/10.1006%2Fjvci.1997.0378
- [8] C. Dong, Y. Deng, C. C. Loy, and X. Tang, “Compression artifacts reduction by a deep convolutional network,” in 2015 IEEE International Conference on Computer Vision (ICCV). IEEE, dec 2015. [Online]. Available: https://doi.org/10.1109%2Ficcv.2015.73
- [9] K. Zhang, W. Zuo, Y. Chen, D. Meng, and L. Zhang, “Beyond a gaussian denoiser: Residual learning of deep CNN for image denoising,” IEEE Transactions on Image Processing, vol. 26, no. 7, pp. 3142–3155, jul 2017. [Online]. Available: https://doi.org/10.1109%2Ftip.2017.2662206
- [10] Q. Xing, M. Xu, T. Li, and Z. Guan, “Early exit or not: Resource-efficient blind quality enhancement for compressed images,” in Computer Vision – ECCV 2020. Springer International Publishing, 2020, pp. 275–292. [Online]. Available: https://doi.org/10.1007%2F978-3-030-58517-4_17
- [11] Q. Xing, M. Xu, X. Deng, and Y. Guo, “Daqe: Enhancing the quality of compressed images by exploiting the inherent characteristic of defocus,” IEEE Transactions on Pattern Analysis and Machine Intelligence, 2023.
- [12] Q. Xing, M. Xu, S. Li, X. Deng, M. Zheng, H. Liu, and Y. Chen, “Enhancing quality of compressed images by mitigating enhancement bias towards compression domain,” CoRR, vol. abs/2402.17200, 2024. [Online]. Available: https://doi.org/10.48550/arXiv.2402.17200
- [13] E. Agustsson and R. Timofte, “NTIRE 2017 challenge on single image super-resolution: Dataset and study,” in 2017 IEEE Conference on Computer Vision and Pattern Recognition Workshops (CVPRW). IEEE, jul 2017. [Online]. Available: https://doi.org/10.1109%2Fcvprw.2017.150
- [14] Q. Ding, M. Xu, S. Li, X. Deng, Q. Shen, and X. Zou, “A learning-based approach for martian image compression,” in 2022 IEEE International Conference on Visual Communications and Image Processing (VCIP). IEEE, 2022, pp. 1–5.
- [15] Z. Wang, D. Liu, S. Chang, Q. Ling, Y. Yang, and T. S. Huang, “D3: Deep dual-domain based fast restoration of JPEG-compressed images,” in 2016 IEEE Conference on Computer Vision and Pattern Recognition (CVPR). IEEE, jun 2016. [Online]. Available: https://doi.org/10.1109%2Fcvpr.2016.302
- [16] J. Guo and H. Chao, “Building dual-domain representations for compression artifacts reduction,” in Computer Vision – ECCV 2016. Springer International Publishing, 2016, pp. 628–644. [Online]. Available: https://doi.org/10.1007%2F978-3-319-46448-0_38
- [17] P. Liu, H. Zhang, K. Zhang, L. Lin, and W. Zuo, “Multi-level wavelet-cnn for image restoration,” in Proceedings of the IEEE conference on computer vision and pattern recognition workshops, 2018, pp. 773–782.
- [18] S. Guo, Z. Yan, K. Zhang, W. Zuo, and L. Zhang, “Toward convolutional blind denoising of real photographs,” in 2019 IEEE/CVF Conference on Computer Vision and Pattern Recognition (CVPR). IEEE, jun 2019. [Online]. Available: https://doi.org/10.1109%2Fcvpr.2019.00181
- [19] K. He, X. Zhang, S. Ren, and J. Sun, “Deep residual learning for image recognition,” in 2016 IEEE Conference on Computer Vision and Pattern Recognition (CVPR). IEEE, jun 2016. [Online]. Available: https://doi.org/10.1109%2Fcvpr.2016.90
- [20] S. Ioffe and C. Szegedy, “Batch normalization: Accelerating deep network training by reducing internal covariate shift,” in Proceedings of the 32nd International Conference on Machine Learning, ICML 2015, Lille, France, 6-11 July 2015, ser. JMLR Workshop and Conference Proceedings, F. R. Bach and D. M. Blei, Eds., vol. 37. JMLR.org, 2015, pp. 448–456. [Online]. Available: http://proceedings.mlr.press/v37/ioffe15.html
- [21] K. Dabov, A. Foi, V. Katkovnik, and K. Egiazarian, “Image denoising by sparse 3-d transform-domain collaborative filtering,” IEEE Transactions on Image Processing, vol. 16, no. 8, pp. 2080–2095, aug 2007. [Online]. Available: https://doi.org/10.1109%2Ftip.2007.901238
- [22] D. Martin, C. Fowlkes, D. Tal, and J. Malik, “A database of human segmented natural images and its application to evaluating segmentation algorithms and measuring ecological statistics,” in Proc. 8th Int’l Conf. Computer Vision, vol. 2, July 2001, pp. 416–423.
- [23] R. M. Swan, D. Atha, H. A. Leopold, M. Gildner, S. Oij, C. Chiu, and M. Ono, “Ai4mars: A dataset for terrain-aware autonomous driving on mars,” in Proceedings of the IEEE/CVF Conference on Computer Vision and Pattern Recognition, 2021, pp. 1982–1991.
- [24] S. Hu, J. Liu, and Z. Kang, “Deeplabv3+/efficientnet hybrid network-based scene area judgment for the mars unmanned vehicle system,” Sensors, vol. 21, no. 23, p. 8136, 2021.
- [25] T. Panambur, D. Chakraborty, M. Meyer, R. Milliken, E. Learned-Miller, and M. Parente, “Self-supervised learning to guide scientifically relevant categorization of martian terrain images,” in Proceedings of the IEEE/CVF Conference on Computer Vision and Pattern Recognition, 2022, pp. 1322–1332.
- [26] G. Goutham, H. Juneja, C. Ankitha, and V. B. Prasad, “Semantic segmentation on martian terrain for navigation using transformers,” in 2022 IEEE 7th International Conference on Recent Advances and Innovations in Engineering (ICRAIE), vol. 7. IEEE, 2022, pp. 276–282.
- [27] C. Wang, Y. Zhang, Y. Zhang, R. Tian, and M. Ding, “Mars image super-resolution based on generative adversarial network,” IEEE Access, vol. 9, pp. 108 889–108 898, 2021.
- [28] T. Ojala, M. Pietikainen, and D. Harwood, “Performance evaluation of texture measures with classification based on kullback discrimination of distributions,” in Proceedings of 12th international conference on pattern recognition, vol. 1. IEEE, 1994, pp. 582–585.
- [29] S. Wold, K. Esbensen, and P. Geladi, “Principal component analysis,” Chemometrics and intelligent laboratory systems, vol. 2, no. 1-3, pp. 37–52, 1987.
- [30] S. Kullback and R. A. Leibler, “On information and sufficiency,” The annals of mathematical statistics, vol. 22, no. 1, pp. 79–86, 1951.
- [31] S. W. Zamir, A. Arora, S. H. Khan, M. Hayat, F. S. Khan, M. Yang, and L. Shao, “Multi-stage progressive image restoration,” in IEEE Conference on Computer Vision and Pattern Recognition, CVPR 2021, virtual, June 19-25, 2021. Computer Vision Foundation / IEEE, 2021, pp. 14 821–14 831. [Online]. Available: https://openaccess.thecvf.com/content/CVPR2021/html/Zamir_Multi-Stage_Progressive_Image_Restoration_CVPR_2021_paper.html
- [32] J. Hu, L. Shen, and G. Sun, “Squeeze-and-excitation networks,” in Proceedings of the IEEE conference on computer vision and pattern recognition, 2018, pp. 7132–7141.
- [33] J. L. Ba, J. R. Kiros, and G. E. Hinton, “Layer normalization,” arXiv preprint arXiv:1607.06450, 2016.
- [34] D. Hendrycks and K. Gimpel, “Gaussian error linear units (gelus),” arXiv preprint arXiv:1606.08415, 2016.
- [35] NASA/JPL-Caltech, https://dominikschmidt.xyz/mars32k/, 2018.
- [36] NASA, https://mars.nasa.gov/mars2020/, 2020.
- [37] F. Bellard, “Better portable graphics (bpg),” https://bellard.org/bpg/, 2018, [Online; accessed 10-Match-2021].
- [38] G. J. Sullivan, J.-R. Ohm, W.-J. Han, and T. Wiegand, “Overview of the high efficiency video coding (HEVC) standard,” IEEE Transactions on Circuits and Systems for Video Technology, vol. 22, no. 12, pp. 1649–1668, dec 2012. [Online]. Available: https://doi.org/10.1109%2Ftcsvt.2012.2221191
- [39] T. Wang, M. Chen, and H. Chao, “A novel deep learning-based method of improving coding efficiency from the decoder-end for HEVC,” in 2017 Data Compression Conference (DCC). IEEE, apr 2017. [Online]. Available: https://doi.org/10.1109%2Fdcc.2017.42
- [40] Z. Guan, Q. Xing, M. Xu, R. Yang, T. Liu, and Z. Wang, “MFQE 2.0: A new approach for multi-frame quality enhancement on compressed video,” IEEE Trans. Pattern Anal. Mach. Intell., vol. 43, no. 3, pp. 949–963, 2021. [Online]. Available: https://doi.org/10.1109/TPAMI.2019.2944806
- [41] M. Zheng, Q. Xing, M. Qiao, M. Xu, L. Jiang, H. Liu, and Y. Chen, “Progressive training of a two-stage framework for video restoration,” in Proceedings of the IEEE/CVF Conference on Computer Vision and Pattern Recognition (CVPR) Workshops, June 2022, pp. 1024–1031.
- [42] D. P. Kingma and J. Ba, “Adam: A method for stochastic optimization,” 2017.
- [43] I. Loshchilov and F. Hutter, “SGDR: stochastic gradient descent with warm restarts,” in 5th International Conference on Learning Representations, ICLR 2017, Toulon, France, April 24-26, 2017, Conference Track Proceedings. OpenReview.net, 2017. [Online]. Available: https://openreview.net/forum?id=Skq89Scxx
- [44] C. Yim and A. C. Bovik, “Quality assessment of deblocked images,” IEEE Transactions on Image Processing, vol. 20, no. 1, pp. 88–98, 2010.
- [45] Z. Wang, A. Bovik, H. Sheikh, and E. Simoncelli, “Image quality assessment: From error visibility to structural similarity,” IEEE Transactions on Image Processing, vol. 13, no. 4, pp. 600–612, apr 2004. [Online]. Available: https://doi.org/10.1109%2Ftip.2003.819861
- [46] Z. Wang, E. P. Simoncelli, and A. C. Bovik, “Multiscale structural similarity for image quality assessment,” in The Thrity-Seventh Asilomar Conference on Signals, Systems & Computers, 2003, vol. 2. Ieee, 2003, pp. 1398–1402.
- [47] R. Zhang, P. Isola, A. A. Efros, E. Shechtman, and O. Wang, “The unreasonable effectiveness of deep features as a perceptual metric,” in 2018 IEEE/CVF Conference on Computer Vision and Pattern Recognition. IEEE, jun 2018. [Online]. Available: https://doi.org/10.1109%2Fcvpr.2018.00068
- [48] G. Bjontegaard, “Calculation of average psnr differences between rd-curves,” VCEG-M33, 2001.
- [49] Y. Blau, R. Mechrez, R. Timofte, T. Michaeli, and L. Zelnik-Manor, “The 2018 pirm challenge on perceptual image super-resolution,” in Proceedings of the European conference on computer vision (ECCV) workshops, 2018, pp. 0–0.
- [50] A. Mittal, A. K. Moorthy, and A. C. Bovik, “No-reference image quality assessment in the spatial domain,” IEEE Transactions on Image Processing, vol. 21, no. 12, pp. 4695–4708, dec 2012. [Online]. Available: https://doi.org/10.1109%2Ftip.2012.2214050