Magnetic-domain-dependent pseudogap induced by Fermi surface nesting in a centrosymmetric skyrmion magnet
Skyrmions in non-centrosymmetric materials are believed to occur due to the Dzyaloshinskii-Moriya interaction. In contrast, the skyrmion formation mechanism in centrosymmetric materials remains elusive. Among those, Gd-based compounds are the prototype compounds; however, their electronic structure is not uncovered, even though it should be the foundation for elucidating the skyrmion mechanism. Here, we reveal the intrinsic electronic structure of GdRu2Si2 for the first time by magnetic domain selective measurements of angle-resolved photoemission spectroscopy (ARPES). In particular, we find the robust Fermi surface (FS) nesting, consistent with the q-vector detected by the previous resonant X-ray scattering (RXS) measurements. Most importantly, we find that the pseudogap is opened at the nested portions of FS at low temperatures. The momentum locations of the pseudogap vary for different magnetic domains, most likely having a direct relationship with the screw-type spin modulation that changes direction for each domain. Intriguingly, the anomalous pseudogap disconnects the FS to generate Fermi arcs with 2-fold symmetry. These results indicate the significance of Ruderman-Kittel-Kasuya-Yosida (RKKY) interaction, in which itinerant electrons mediate to stabilize the local magnetic moment, as the mechanism for the magnetism in the Gd-based skyrmion magnets. Our data also predict that the momentum space where the pseudogap opens is doubled (or Fermi arcs shrink) and thereby stabilizes the skyrmion phase under a magnetic field. Furthermore, we demonstrate the flexible nature of magnetism in GdRu2Si2 by manipulating magnetic domains with a magnetic field and temperature cyclings, providing a possibility of future application for data storage and processing device with centrosymmetric skyrmion magnets.
Magnetic skyrmions are generated as particles with spiral spin textures due to the non-trivial topology in real space. Since their discovery about a decade ago, magnetic skyrmions have attracted enormous research interest because they exhibit various exotic phenomena and a high potential for the spintronic device application neubauer2009a ; Yu2010 ; schulz2012 ; romming2013 ; Nagaosa2013 . While most magnetic skyrmion materials are non-centrosymmetric muhlbauer2009 ; seki2012 ; kezsmarki2015 ; tokunaga2015 , several centrosymmetric systems yielding skyrmion lattice have been discovered in the past few years Kurumaji2018 ; Hirschberger2019 ; Khanh2020 ; ishiwata2020a ; gao2020 ; takagi2022 . One significant feature of skyrmions in centrosymmetric systems is their tiny size (<4 nm), much smaller than that in non-centrosymmetric systems (generally around several tens of nanometers) Tokura2020 . Such a smaller size of skyrmion can generate more robust electrodynamic responses originating from the quantum mechanical Berry phase, being desirable for future high-density data storage and processing devices takashima2016 ; fert2017 ; psaroudaki2017 ; yokouchi2020 ; psaroudaki2021 .
The most well-acknowledged family of centrosymmetric skyrmion magnets are Gd-based skyrmion materials: Gd2PdSi3 Kurumaji2018 , Gd3Ru4Al12 Hirschberger2019 , and GdRu2Si2 Khanh2020 . In particular, GdRu2Si2 is known as the material forming the smallest size (1.9 nm) of skyrmions among all materials hosting skyrmions. While the formation mechanism of skyrmions in non-centrosymmetric materials is widely agreed to be the Dzyaloshinski-Moriya interaction, it remains a challenge to clarify the corresponding mechanism in the centrosymmetric Gd-based materials.
Several theoretical works have proposed geometrical frustration okubo2012 ; leonov2015 or orbital frustration Nomoto2020 as key for the skyrmion lattice state in Gd-based skyrmion materials; some others believe the requirement of RKKY interaction Inosov2009 ; wang2020 ; mitsumoto2021 ; Bouaziz2022 or higher-order spin interactions ozawa2017 ; Hayami2017 ; Hayami2021a . Either of these mechanisms would significantly modify the electronic structure, thus its detailed observation could bring the breakthrough to the argument of the skyrmion formation mechanism in centrosymmetric materials. Such a study, however, has not been done to date while strongly desired. ARPES measurements are the most direct way of determining the electronic structure of matter, which, however, is not straightforward in the investigation of the Gd-based skyrmion materials. The difficulty is that structural terminations on the sample surface and magnetic domains can greatly complicate the ARPES signals. Extremely careful measurements solving these complications are required to unveil the intrinsic electronic structure associated with the fascinating magnetic order in those compounds.
In this study, we reveal the electronic structure in the Gd-based centrosymmetric skyrmion magnets for the first time by using the ARPES technique which solves the difficulties due to both surface terminations and magnetic domains. Among the three Gd-based skyrmion materials, in particular, we selected GdRu2Si2 as a research target because not only of its simplest crystal structure garnier1995 ; garnier1996 ; Samanta2008b but also of a fascinating property that can form the smallest skyrmion ever Khanh2020 . Magnetic phases of GdRu2Si2 have previously been studied by RXS and scanning tunneling microscope (STM) experiments Khanh2020 ; Yasui2020 ; Khanh2022 . The emergence of a topologically non-trivial skyrmion lattice state (Phase II) requires both low temperatures (below 20 K) and a magnetic field (within a narrow range above 2 T). The magnetic field is not allowed in ARPES measurements, so we investigate the electronic structure only of the ground state at a zero magnetic field (Phase I). Nevertheless, it is crucial to investigate the ground state for elucidating the skyrmion mechanism because the ground and skyrmion phases (Phase I and Phase ll, respectively) share similar magnetic modulation q-vectors: (0.22, 0, 0) and (0, 0.22, 0). Here, 0.22 r.l.u. corresponds to about 0.33 Å-1. Note that the skyrmion is thought to be formed by the superposition of multiple q-vectors. The formation mechanism of these q-vectors should be reflected in the electronic structure at the ground state, and thus its direct observation by ARPES is critical to understanding the skyrmion mechanism in centrosymmetric materials.
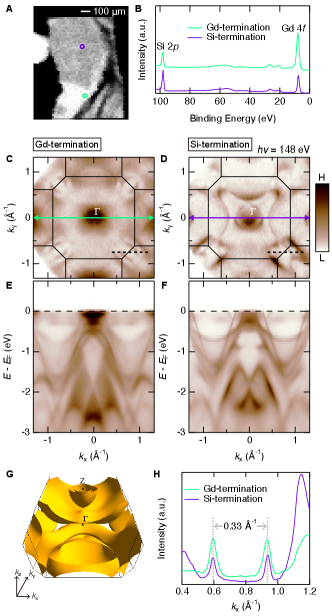
We selectively observe Si-termination and Gd-termination on the crystal surface of GdRu2Si2 cleaved along the (001) plane by ARPES using synchrotron light of a small beam spot ( 40 10 m2). Figure 1A maps the photoemission intensity near obtained by scanning the beam spot every 20 m over the cleavage surface. Here, we use the photon energy of 148 eV allowing the resonant photoemission Mishra1998 to obtain a better contrast in the intensity map. This photon energy also corresponds to the value at the point. A clear contrast of bright or dark indicates different local densities of states (LDOS) near , distinguishing two kinds of areas either for Gd-termination or Si-termination. To identify the correspondence between each area and termination, core-level photoemission is performed (Fig. 1B) for these two areas: the green spot (bright area) and the purple spot (dark area) marked in Fig. 1A. The intensity of the Si 2 peak is lower than that of the Gd 4 peak at the green spot. Inversely, the former is higher than the latter at the purple spot. This result identifies the green and purple spots as Gd-termination and Si-termination, respectively.
Next, we conduct ARPES measurements for these two terminations separately. The Si-termination (Fig. 1D) exhibits two circle-shaped FS sheets within a large windmill-shaped FS sheet centered at point. In contrast, these characteristic features are not observed for the Gd-termination (Fig. 1C). Instead, much higher intensities are detected at the center point. Apparent discrepancies between the two domains are also found in the band dispersion. Figure 1E,F is the band dispersions of Gd-termination and Si-termination, respectively, passing through the point. The overall difference between the two is apparent; for instance, there are some sharp bands near in Si-termination (Fig. 1F) while these bands are missing in Gd-termination (Fig. 1E). These discrepancies allow us to easily distinguish the two domains during ARPES measurements.
For a study of the skyrmion mechanism in GdRu2Si2, it is crucial to extract the intrinsic bulk information from these data. As a reference, the bulk-state FS calculated with density functional theory (DFT) is displayed in Fig. 1G. The FS of terminations is composed of surface and bulk signals. Therefore, the common part of FS observed from Gd-termination and Si-termination should be for the intrinsic bulk state. Such features are indeed found in the data. The ones particularly remarkable are the parallel FS observed at the corner of the Brillouin zone (BZ) in both terminations. Figure 1H overlays the momentum distribution curves (MDCs) at along crossing the BZ corner (dotted lines in Fig. 1C and Fig. 1D) for Gd-termination and Si-termination. A good agreement is obtained in the peak positions between the two curves, validating that the parallel FS is for the bulk state. We focus our study on this part of FS.
We compare side by side the in-plane FS map at = 0 by the ARPES measurements with 94 eV photons (Fig. 2A) and the DFT calculations (Fig. 2B). The agreement between the two is excellent, particularly in the parallel segments around the BZ corner. Most importantly, we find robust FS nesting which almost perfectly matches the q-vectors of magnetic modulation reported (green and blue arrows in Fig. 2B). In Fig. 2C, we plot an ARPES dispersion measured along a momentum cut connecting two BZ corners (black arrow in Fig. 2A). On the top panel, the MDC at is extracted. Sharp spectral peaks pointing to the locations allow us to precisely determine the nesting vector (green arrows in Fig. 2C). Similarly, we observe band dispersions along at different positions marked by green circles in the zoomed FS map (Fig. 2D) of the red rectangular region in Fig. 2A. In Fig. 2E, the nesting wave vectors determined by ARPES (green circles) are compared with those of our DFT calculations (red line), and the lengths of q-vectors reported by RXS measurements Khanh2020 . These three are found to almost perfectly match each other at q-vector of 0.33 Å-1 along .
Next, we examine the FS nesting along the direction. The value of the in-plane FS observed can be controlled by changing photon energies. In Fig. 2F,G, we plot in-plane FS maps around the zone corner measured at photon energies over a wide range from 94 eV to 67 eV covering the entire BZ along . The direction of the parallel FS is rotated by 90∘ when the observed is shifted by half the BZ distance (Fig. 2F). This variation justifies that the ARPES signals are indeed for the bulk state. At the same time, it may worsen the nesting condition along the direction. Importantly, however, the FS nesting of the same q-vector is valid in the entire BZ along , as long as focusing on the center cut of the nested segments (dashed white lines in Fig. 2G). This is more clearly demonstrated in Fig. 2H by plotting the corresponding MDCs at different photon energies covering the entire BZ along . The nesting wave vector marked by the green arrow is almost constant in length at different positions. Our DFT calculations reproduce the FS which is almost perfectly nested along the entire (Fig. 2I). These results along are summarized in Fig. 2J; all three of the nesting wave vectors determined by ARPES and DFT calculations, and q-vector observed by RXS show almost perfect agreement with each other. Our results, therefore, evidence the robust FS nesting in both the in-plane and out-of-plane directions, indicating that itinerant electrons near play an important role; more specifically, the interaction between the magnetic moments would be mediated by the RKKY interaction in which the FS nesting essentially involves. This notion will be further solidified in the experimental investigations presented below.
Temperature-dependent behavior of the electronic structure is investigated to understand the phase transition in GdRu2Si2 across the Néel temperature () of 46 K. Figure 3A shows a band dispersion across the nested FS at a low temperature (10 K) deep below . Here, we use 148 eV photons, which correspond to = 0. The magnified band map in Fig. 3B (a green-dotted rectangular region in Fig. 3A) exhibits two band dispersions. The band on the left (red arrow) participates in the FS nesting, while the other on the right (blue arrow) does not. Interestingly, we find a weight loss of spectra near in the nesting band due to the opening of the pseudogap, as schematically illustrated in Fig. 3D. The intensity loss toward results in a penpoint-like shape in the color map. The pseudogap is, in contrast, absent in the non-nesting band. We also confirm in Fig. 3B that the pseudogap is closed at a high temperature ( K) above . Note here that the data do not exhibit band splitting at low temperatures below as proposed by orbital frustration theory Nomoto2020 . If there were band splitting, the nesting wave vector should change between low and high temperatures; it, however, does not occur. This result is extremely important in identifying the appropriate one from several proposed theories of the skyrmion mechanism in this compound.
To better understand the relationship between the pseudogap and the phase transition, we examine in Fig. 3F the detailed temperature dependence of energy distribution curves (EDCs) at for the nesting band (red arrow in Fig. 3B,C). The pseudogap magnitude is estimated to be about 100 meV at 10 K. With increasing temperature, the pseudogap decreases and eventually closes at high temperatures (Fig. 3F). This gets clearer by symmetrizing EDCs about (Fig. 3G). Two peaks merge into one peak at elevated temperatures, indicating that the gap closes. In contrast, the spectra at for the non-nesting band (blue arrow in Fig. 3B,C) do not open a gap and they only get broadened at elevated temperatures due to the thermal broadening (Fig. 3H,I). These results are further examined in Fig. 3E by extracting the spectral weight near (color-hatched area in Fig. 3G,I), which is most sensitive to the gap filling and the thermal broadening. The spectral weight of the nesting band (red) remarkably increases up to , saturating in the paramagnetic (PM) phase. In contrast, the spectral weight for the non-nesting band (blue) decreases in a rather monotonic fashion as temperature increases due to the thermal broadening. The pseudogap is, therefore, closely related to the magnetic order in GdRu2Si2. It also explains the upturn in the resistivity behavior previously reported Samanta2008b and for our samples (Supplementary Fig. S4).
We perform the magnetic domain-selective measurements to fully understand the magnetic band structure of GdRu2Si2. Such measurements require instrumental technology that combines a focused beam and a sophisticated sample manipulator enabling stable scan over the sample surface, and those became available only recently in the ARPES research. Very intriguingly, we find that the pseudogap has a domain dependence: only one of two q-vectors (either or ) involve the pseudogap opening.
Figure 4A shows the spatial mapping of photoemission intensity near on the sample surface of GdRu2Si2. One can distinguish Si-termination and Gd-termination from high and low intensities, respectively. We select 20 spots that are evenly spaced and cover both terminations for the ARPES measurements. In Fig. 4D-K, we display the nesting bands measured at 10 K along the BZ corners for 4 spots (Position I, II, III, IV, marked in Fig. 4A) as examples. Here, the left two rows are for Gd-termination and the right two rows are for Si-termination. For each spot, we measured two different momentum cuts: the horizontal cut along (cut H) and the vertical cut along (cut V), which are separately displayed on the top and low panels. We note here that these two cuts were measured at the same experimental geometry for a fair comparison (Supplementary Section V and Fig. S5). The pseudogap is observed for all the spots. Interestingly, however, we find that only one of the paired two cuts (cut H or cut V) shows the opening of the pseudogap; that is, some spots (Position I, III) open the pseudogap only on cut H, but the others (Position II, IV) only on cut V, as illustrated in Fig. 4B,C with schematic FSs, respectively.
These data provide two implications. One is that the abnormal Fermi arc emerges due to the pseudogap that opens only in partial momentum space. Second is that the electronic structure breaks the 4-fold symmetry of the crystal structure, becoming the 2-fold symmetry in the ground state (Phase I). This causes two kinds of magnetic domains with the pseudogap opened in different directions. Importantly, both the red situation of Fig. 4B (Position I, III) and the blue situation of Fig. 4C (Position II, IV) can be observed in the same termination either of Gd-termination (Position I, II) or Si-termination (Position III, IV). Therefore, the two kinds of magnetic domains are independent of terminations and they should originate from the intrinsic bulk property. This is more clearly demonstrated in Fig. 4A by distinguishing all the measured 20 spots with red and blue. It is revealed that magnetic domains are quite large and their shapes and locations are independent of the terminations.
The two-fold electronic structure revealed by ARPES is compatible with the anisotropic magnetic double-q state observed by RXS. The previous RXS measurements uncovered that the magnetic structure of Phase I at a zero magnetic field is formed by the superposition of the screw spin modulation = (0.219, 0, 0) [or equivalent = (0, 0.219, 0)] and the sinusoidal spin modulation = (0, 0.224, 0) [or equivalent = (0.224, 0, 0)] Khanh2022 . The difference in the length of these two perpendicular q-vectors is so tiny that it is within the measurement error of the nesting wave vector by ARPES. Each parallel part of FS can, therefore, be connected by both and . Our ARPES results that the pseudogap opens along only one of or direction (green arrows in Fig. 4B,C) means that only one of the magnetic modulations (either screw-type or sinusoidal-type ) generates the pseudogap.
We conjecture that the pseudogap is generated by the screw spin modulation, not the sinusoidal spin modulation. The spin moments of the screw-type modulation have equal lengths and they oscillate not only in the (001) plane but also along the [001] direction (Fig. 5H). On the other hand, the spin moments of sinusoidal-type modulation have a shorter length on average than the screw-type and they oscillate only in the (001) plane but not along the [001] direction (Fig. 5H). Therefore, the screw spin modulation should be more strongly coupled with the electronic structure than the sinusoidal spin modulation ozawa2016 . The skyrmion lattice is formed as the superposition of two perpendicular screw spin modulations. Hence, our results suggest that the pseudogap opens at a large portion of the nested FS simultaneously connected by two screw-type q-vectors of each vertical and horizontal direction, energetically stabilizing the skyrmion state under a magnetic field.
To investigate the properties of the magnetic domains further, we perform polarizing microscopy measurements. We use the same sample pieces measured by ARPES for the measurements to clarify the correspondence between the results of these two different experimental techniques. Figure 5A,C show the spatial mapping of photoemission intensity obtained from two sample pieces (sample #1 and sample #2). The red and blue spots mark different magnetic domains distinguished by ARPES via observing the pseudogap which opens at different momenta. For the same sample pieces, we also took the polarizing microscopy images (Fig. 5B,D for sample #1 and sample #2, respectively). Each image plots the intensity difference between 10 K (Phase I) and 50 K (PM) to extract only the signals due to the magnetic order. The magnetic domains determined by ARPES match perfectly well those by the polarizing microscopy image.
Finally, we demonstrate unique manipulations of the magnetic domains in GdRu2Si2 by a magnetic field and temperature cyclings in Phase I. Figure 5E shows a schematic phase diagram with Fig. 5F-I representing magnetic ordering in each phase, adopted from previous RXS research Khanh2022 . Both of the magnetic field and temperature cyclings excite the system to the one with a 4-fold symmetry and then take back it to the one with a 2-fold symmetry. For the magnetic field cycling, we used a pulsed field with a width of 4.6 ms. The polarizing microscopy images obtained by a series of experiments are shown in Fig. 5J-5M. All the images are subtracted by the image at 50 K (PM) as background. As the first procedure, the temperature was decreased from 50 K (PM) to 10 K (Phase I) without a magnetic field (Fig. 5J: \small{4}⃝\small{1}⃝). Two domains (blue and white areas) clearly appear at 10 K in Phase I. Secondly, the magnetic state was excited from Phase I to Phase II (skyrmion state) by a pulsed magnetic field, which comes back to Phase I in a short time (Fig. 5K: \small{1}⃝\small{2}⃝\small{1}⃝). We find a large number of domain bubbles to appear near the original domain boundary, although the main parts of the domains remain almost unchanged. This indicates a competition between the flexibility of the skyrmion state and the stiffness of the memorized magnetic order during the magnetic field cycling. Thirdly, the magnetic state was excited from Phase I to Phase III and then taken back to Phase I again by a pulsed magnetic field (Fig. 5L: \small{1}⃝\small{3}⃝\small{1}⃝). Much smaller bubble-like domains appear and their distribution is completely random, indicating that the memory of the original domains is erased. Lastly, the temperature is increased from 10 K (Phase I) to 50 K (PM) and then decreased to 10 K (Phase I) again without an external magnetic field (Fig. 5M: \small{1}⃝\small{4}⃝\small{1}⃝). Intriguingly, the profile and distribution of magnetic domains are perfectly restored to the original ones (Fig. 5J).
Notably, the bubbles of magnetic domains are found to appear not only by using a pulsed field but also by using a static field as the magnetic field cycling (supplementary Fig. S8). Our results, therefore, demonstrate that the magnetic domain patterns in Phase I can be easily manipulated by applying magnetic fields (regardless of static and pulsed magnetic fields), while they are robust against temperature cycling and can be perfectly restored. The dual character of magnetism which can erase and restore the memorized domain patterns by magnetic field and temperature cyclings is unknown in other magnetic materials. Hence, this should be a unique feature of GdRu2Si2 and should be tightly related to the skyrmion formation mechanism, perhaps due to the higher-order spin interactions between different magnetic modulations. Our findings about the magnetic domain manipulation with field and temperature would be insightful for future engineering applications for data storage and processing with centrosymmetric skyrmion magnets.
Acknowledgements
We thank K. Kuroda and T. Taniuchi for fruitful discussion on the results, and also thank T. Yajima for XRD measurements. Use of the Synchrotron Radiation Lightsource, SLAC National Accelerator Laboratory, is supported by the U.S. Department of Energy, Office of Science, Office of Basic Energy Sciences under Contract No. DE-AC02-76SF00515.
This work was supported by the JSPS KAKENHI (Grants Numbers. JP21H04439, JP19H00651, JP22K03517, JP21H01037, and JP23H04869), by the Asahi Glass Foundation, by MEXT Q-LEAP (Grant No. JPMXS0118068681), by JST PRESTO (Grant No. JPMJPR20L8), by The Murata Science Foundation, and by Tokyo Metropolitan Government Advanced Research (Grant Number. H31-1).
References
- (1) A. Neubauer, et al., Physical Review Letters 102, 186602 (2009).
- (2) X. Z. Yu, et al., Nature 465, 901 (2010).
- (3) T. Schulz, et al., Nature Physics 8, 301 (2012).
- (4) N. Romming, et al., Science 341, 636 (2013).
- (5) N. Nagaosa, Y. Tokura, Nature Nanotechnology 8, 899 (2013).
- (6) S. Mühlbauer, et al., Science 323, 915 (2009).
- (7) S. Seki, S. Ishiwata, Y. Tokura, Physical Review B 86, 060403 (2012).
- (8) I. Kézsmárki, et al., Nature Materials 14, 1116 (2015).
- (9) Y. Tokunaga, et al., Nature Communications 6, 7638 (2015).
- (10) T. Kurumaji, et al., Science 365, 914 (2018).
- (11) M. Hirschberger, et al., Nature Communications 10, 5831 (2019).
- (12) N. D. Khanh, et al., Nature Nanotechnology 15, 444 (2020).
- (13) S. Ishiwata, et al., Physical Review B 101, 134406 (2020).
- (14) S. Gao, et al., Nature 586, 37 (2020).
- (15) R. Takagi, et al., Nature Communications 13, 1472 (2022).
- (16) Y. Tokura, N. Kanazawa, Chemical Reviews 121, 2857 (2020).
- (17) R. Takashima, H. Ishizuka, L. Balents, Physical Review B 94, 134415 (2016).
- (18) A. Fert, N. Reyren, V. Cros, Nature Reviews Materials 2, 17031 (2017).
- (19) C. Psaroudaki, S. Hoffman, J. Klinovaja, D. Loss, Physical Review X 7, 041045 (2017).
- (20) T. Yokouchi, et al., Nature 586, 232 (2020).
- (21) C. Psaroudaki, C. Panagopoulos, Physical Review Letters 127, 067201 (2021).
- (22) T. Okubo, S. Chung, H. Kawamura, Physical Review Letters 108, 017206 (2012).
- (23) A. O. Leonov, M. Mostovoy, Nature Communications 6, 8275 (2015).
- (24) T. Nomoto, T. Koretsune, R. Arita, Physical Review Letters 125, 117204 (2020).
- (25) D. S. Inosov, et al., Physical Review Letters 102, 046401 (2009).
- (26) Z. Wang, Y. Su, S.-Z. Lin, C. D. Batista, Physical Review Letters 124, 207201 (2020).
- (27) K. Mitsumoto, H. Kawamura, Physical Review B 104, 184432 (2021).
- (28) J. Bouaziz, E. Mendive-Tapia, S. Blügel, J. B. Staunton, Physical Review Letters 128, 157206 (2022).
- (29) R. Ozawa, S. Hayami, Y. Motome, Physical Review Letters 118, 147205 (2017).
- (30) S. Hayami, R. Ozawa, Y. Motome, Physical Review B 95, 224424 (2017).
- (31) S. Hayami, T. Okubo, Y. Motome, Nature Communications 12, 6927 (2021).
- (32) A. Garnier, et al., Journal of Magnetism and Magnetic Materials 140–144, 899 (1995).
- (33) A. Garnier, D. Gignoux, D. Schmitt, T. Shigeoka, Physica B: Condensed Matter 222, 80 (1996).
- (34) T. Samanta, I. Das, S. Banerjee, Journal of Applied Physics 104, 123901 (2008).
- (35) Y. Yasui, et al., Nature Communications 11, 5925 (2020).
- (36) N. D. Khanh, et al., Advanced Science 9, 2105452 (2022).
- (37) S. R. Mishra, et al., Physical Review Letters 81, 1306 (1998).
- (38) R. Ozawa, et al., Journal of the Physical Society of Japan 85, 103703 (2016).