Vol.0 (20xx) No.0, 000–000
22institutetext: Guangxi Key Laboratory for Relativistic Astrophysics, School of Physical Science and Technology, Guangxi University, Nanning 530004, China; [email protected]
\vs\noReceived 20xx month day; accepted 20xx month day
relation in Active Galactic Nucleus Jets and Implication for the physical origin of the relation of Gamma-Ray Bursts
Abstract
High energy photon radiations of gamma-ray bursts (GRBs) and active galactic nuclei (AGNs) are dominated by their jet radiations. We examine wether the synchrotron radiations of jets in BL Lacs, flat spectrum radio quasars (FSRQs), and Narrow Line Seyfert 1 galaxies (NLS1s) follow the relation between the prompt gamma-ray emission and the initial Lorentz factor () of GRBs. It is showed that the AGNs sample does not agree with the of GRBs. In addition, we obtain a tight relation of for FSRQs and NLS1 galaxies, where is the luminosity at peak photon energy of the synchrotron radiations. This relation is different from the relation of GRBs. The dependence of to is consistent with the expectation of the Doppler boosting effect for the FSRQs and NLS1 galaxies, but it is not for GBRs. We argue that may be a representative of the kinetic power of the radiating region and the tight relation is shaped by the radiation physics and the jet power together.
keywords:
Gamma-Ray Bursts; Active Galactic Nuclei; Relativistic Jets; Non-thermal Radiation1 Introduction
Relativistic jets are ubiquitous in the Universe and have been detected in a very diverse range of black hole (BH) systems ranging from stellar mass to supermassive scale. It is believed that gamma-ray bursts (GRBs) are produced by an ultra-relativistic jet powered by stellar black holes from core collapses of massive stars (e.g. Woosley 1993) or mergers of two compact stars (e.g. Eichler et al. 1989; Paczynski 1991; Kumar & Zhang 2015), and the high energy photon radiations of active galactic nuclei (AGNs) are dominated by radiations from a mildly relativistic jet fed by accretion of their central super-massive BHs (Urry & Padovani 1995; Ghisellini et al. 2009; Zhang et al. 2012, 2015; Liang et al. 2015; Sun et al. 2015; Zhu et al. 2016).
The observed radiations from a jet are boosted by the Doppler effect in case of the jet toward the earth. It is generally believed that typical GRBs and blazars, including flat spectrum radio quasars (FSRQs) and BL Lacs, as well as GeV-selected Seyfert 1 galaxies, are on-axis or small angle off-axis observed to their jets (Urry & Padovani 1995; Kumar & Zhang 2015; Sun et al. 2015). Therefore, the Doppler boosting factor () is mainly dependent on the the Lorentz factor () of a relativistic jet. There are three methods to estimate the initial Lorentz factor () of a GRB fireball. The first one is to use the fireball deceleration time derived from the onset peaks observed in early optical afterglow lightcurves (Sari & Piran 1999; Kobayashi et al. 1999; Liang et al. 2010). The second one is based on the ”compactness” argument by analysing the high energy spectral cutoffs or breaks of the prompt emission of GRBs (Lithwick & Sari 2001; Tang et al. 2015). The third method is to use the photosphere radiation in some GRBs (Pe’er et al. 2007; Peng et al. 2014; Zou et al. 2015). By deriving the values with the first method for a sample of GRBs, Liang et al. (2010) discovered a relation between and the isotropic gamma-ray energy of GRBs. Lü et al. (2012) showed that the isotropic luminosity also depends on .
Most of confirmed extra-galactic GeV-TeV sources are blazars. The bimodal feature of their broadband SEDs is generally represented with the leptonic models of the synchrotron radiation and the inverse Compton (IC) scattering process (e.g. Ghisellini et al. 1996; Urry et al. 1999). The seed photons for the IC process can be from the synchrotron radiation photon field (SSC, Maraschi et al. 1992; Ghisellini et al. 1996; Urry et al. 1999; Zhang et al. 2012) or the external photon field(EC; Sikora et al. 1994, 2009). NLS1 galaxies were identified as a new class of GeV AGNs by the /LAT (Abdo et al. 2009). Their broadband SEDs can be also explained with synchrotron+IC leptonic jet model (Abdo et al. 2009), which are similar to that in FSRQs. In addition, their radiation physics and jet properties are also similar to that in FSRQs (Sun et al. 2015). By modeling the SEDs of 3C 279 (a typical FSRQ) and two NLS1s (PMN J0948+0022 and 1H 0323+342) in different stages, Zhu et al. (2016) found a universal correlation between Doppler factors () and peak luminosities () of external Compton scattering bump.
Comparative studies the similarity between the jet radiations from GRBs and AGN outbursts have been presented. A uniform correlation between synchrotron luminosity () and in GRBs and blazars is found by Wu et al. (2011). Wang & Wei (2011) showed similar spectral energy distribution between GRB and AGN jet. Nemmen et al. (2012) illustrated that AGN jets and GRB jets exhibit the same correlation between the jet power and the gamma-ray luminosity, (see also Zhang et al. 2013a; Wang et al. 2014). Such a correlation may be also extended to the jets in black hole X-ray binaries (BXBs) in hard/quiescent states and low-luminosity active galactic nuclei, making this correlation may exist for jets with luminosity spreading more than 20 orders of magnitude, i.e., from to erg s-1 (Ma et al. 2014). Further more, Zhu et al. (2019) found that the gamma-ray luminosity and power of outflows of short GRBs and pulsar wind nebulae follow that same relation, and the radiation efficiency is independent of the gamma-ray luminosity for various relativistic jet systems. They suggested that the acceleration and emission mechanisms or efficiencies may be similar in all relativistic outflows regardless of their central engines. Lyu et al. (2014) presented a unified picture for the radiation physics of relativistic jets in GRBs and blazars within the framework of the leptonic synchrotron radiation models. Zhang et al. (2017) proposed a potential fundamental plane for low-synchrotron-peak blazar and GRBs.
The distribution of blazars in the plane illustrate as a blazar sequence, i.e., high-luminosity FSRQs tend to have a low peak frequency and low-luminosity BL Lacs tend to have a high peak frequency. This sequence may be related to the different environments of emitting regions for different types of blazars (e.g. Ghisellini et al. 1998). However, positive correlation between and is observed for outbursts in individuals (Massaro et al. 2008; Tramacere et al. 2009; Zhang et al. 2013a). It is quite similar to that the relation in individual GRBs (Amati et al. 2002; Yonetoku et al. 2004; Liang et al. 2004; Ghirlanda et al. 2004; Lu et al. 2012). Interestingly, Liang et al. (2015) found a tight correlation among the isotropic peak luminosity (), the peak energy () of the spectrum in the GRBs rest frame, and of GRBs jets. This relation is much tighter than the relation. This paper investigates whether or not GeV-TeV selected AGNs have a similar relation, and explore the possible implications for the physical origin of the relation of GRBs. We present our samples in Section 2. Our analysis results are present in Section 3. Discussion and conclusions are given in section 4.
2 Sample and Data
Our samples of GeV/TeV-selected FSRQs, BL Lacs, and NLS1s are taken from Zhang et al. (2012, 2015) and Sun et al. (2015). They presented systematical broadband SED fits to these AGNs with the single-zone lepton model. Viewing angle effect significantly influences the measurement of the Doppler factor of a radiating region. Since the jets in these AGNs are only middle relativistic and the viewing angle to the jet axis of blazars is through to be small, it is usually set in modeling the SEDs of blazars (e.g. Zhang et al. 2012, 2014). Using the model parameters reported by Zhang et al. (2012, 2015) and Sun et al. (2015), we obtain the values of , the peak luminosity () and the peak photon energy () in the source frame of the synchrotron emission. The bolometric luminosity () of these sources are also calculated with the SED fit results. Note that the model parameters for the BL Lacs are poorly constrained, and no error bars of the parameters are reported in Zhang et al. (2012). Thus, no error is available for our data of BL Lacs. There are 18 FSRQs, 19 BL Lac objects, and 5 NLS1s are included in our AGN samples. Since these sources are variable, several SEDs in different outbursts are derived for some sources. The data of our AGN samples are reported in Tables 1-3. Thirty-four GRBs are included in our GRB sample. They are taken from Liang et al. (2015). Liang et al. (2015) calculated the fireball initial Lorentz factors of these GRBs with the observed onset bump in the early optical afterglow lightcurves assuming that the onset bump is due to the deceleration of the fireballs by their ambient medium Sari et al. (1999). The peak luminosity () and the corresponding photon energy () of these GRBs are derived from the fits to the observed spectra accumulated in 1-second peak time slice with the Band function or a power law with an exponential cutoff model. The bolometric luminosity in keV is calculated with the flux from spectral fits to the time-integrated spectra of these GRBs. The data are reported in Table 4.
| Name | |||||
|---|---|---|---|---|---|
| FSRQs | |||||
| 3C 279 | 0.536 | 12.00.5 | |||
| 3C 273 | 0.158 | 7.40.9 | |||
| 3C 454.3 | 0.859 | ||||
| PKS 1454-354 | 1.424 | ||||
| PKS 0208-512 | 1.003 | ||||
| PKS 0454-234 | 1.003 | ||||
| PKS 0727-11 | 1.589 | ||||
| PKS 0528+134 | 2.07 | ||||
| 4C 66.2 | 0.657 | ||||
| 4C 29.45 | 0.729 | ||||
| B2 1520+31 | 1.487 | ||||
| PKS 0420-01 | 0.916 | ||||
| 1Jy 1308+326 | 0.997 | ||||
| PKS 1510-089 | 0.36 | ||||
| 4C 28.07 | 1.213 | ||||
| PMN 2345-1555 | 0.621 | ||||
| S3 2141+17 | 0.213 | ||||
| S4 0133+47 | 0.859 | ||||
| S4 0917+44 | 2.19 | ||||
| PKS 0227-369 | 2.115 | ||||
| PKS 0347-211 | 2.944 | ||||
| PKS 2325+093 | 1.843 | ||||
| PKS 1502+106 | 1.839 |
a is the Doppler boosting factor, is the synchrotron peak photon energy in the source frame, and are the synchrotron peak luminosity and bolometric luminosity, respectively. They are derived from the SED fits with the single-zone leptonic model as reported in Zhang et al. (2015).
| Name | |||||
|---|---|---|---|---|---|
| BL Lacs | |||||
| Mkn 421L | 0.031 | 29 | |||
| Mkn 501L | 0.034 | 14 | |||
| Mkn 501H | 0.034 | 15 | |||
| W ComL | 0.102 | 15 | |||
| W ComH | 0.102 | 14 | |||
| BL LacertaeL | 0.069 | 19 | |||
| BL LacertaeH | 0.069 | 20 | |||
| PKS 2005-489H | 0.071 | 42 | |||
| 1ES 1959+650L | 0.048 | 11 | 0.038 | ||
| 1ES 1959+650H | 0.048 | 12 | 1.786 | ||
| 1ES 2344+514L | 0.044 | 13 | |||
| PKS 2155-304L | 0.116 | 50 | |||
| PKS 2155-304H | 0.116 | 26 | |||
| 1ES 1101-232L | 0.186 | 12 | |||
| 3C 66A | 0.44 | 24 | |||
| PG 1553+113 | 0.3 | 32 | |||
| 1ES 1218+30.4 | 0.182 | 20 | |||
| 1ES 1011+496 | 0.212 | 13 | |||
| PKS 1424+240 | 0.5 | 33 | |||
| 1ES 0806+524 | 0.138 | 12 | |||
| Mkn 180 | 0.045 | 6 | |||
| RGB J0152+017 | 0.08 | 5 | |||
| H1426+428 | 0.129 | 8.5 | 0.472 | ||
| PKS 0548-322 | 0.069 | 6 | 0.263 |
a is the Doppler boosting factor, is the synchrotron peak photon energy in the source frame, and are the synchrotron peak luminosity and bolometric luminosity, respectively. They are derived from the SED fits with the single-zone leptonic model as reported in Zhang et al. (2012). Sources marked with “H” or “L” indicate the high and low states as defined in Zhang et al. (2012).
| Name | |||||
|---|---|---|---|---|---|
| NLS1 | |||||
| 1H 0323+342(1) | 0.0629 | ||||
| 1H 0323+342(2) | 0.0629 | ||||
| 1H 0323+342(3) | 0.0629 | ||||
| 1H 0323+342(4) | 0.0629 | ||||
| 1H 0323+342(5) | 0.0629 | ||||
| PMN J0948+0022(1) | 0.5846 | ||||
| PMN J0948+0022(2) | 0.5846 | ||||
| PMN J0948+0022(3) | 0.5846 | ||||
| PMN J0948+0022(4) | 0.5846 | ||||
| PMN J0948+0022(5) | 0.5846 | ||||
| PMN J0948+0022(6) | 0.5846 | ||||
| PMN J0948+0022(7) | 0.5846 | ||||
| PMN J0948+0022(8) | 0.5846 | ||||
| PMN J0948+0022(9) | 0.5846 | ||||
| SBS 0846+513 | 0.5835 | ||||
| PKS 1502+036 | 0.409 | ||||
| PKS 2004-447 | 0.24 |
a is the Doppler boosting factor, is the synchrotron peak photon energy in the source frame, and are the synchrotron peak luminosity and bolometric luminosity, respectively. They are derived from the SED fits with the single-zone leptonic model as reported in Sun et al. (2015). Different flux states of two Narrow Line Seyfert 1 galaxies, 1H 0323+342 and PMN J0948+0022, are also reported in Sun et al. (2015).
| GRB | ||||||
|---|---|---|---|---|---|---|
| (s) | ||||||
| 990123 | 1.6 | |||||
| 090924 | 0.544 | |||||
| 080810 | 3.35 | |||||
| 060605 | 3.78 | |||||
| 050820A | 2.615 | |||||
| 060607A | 3.082 | |||||
| 060418 | 1.489 | |||||
| 070208 | 1.165 | |||||
| 081203A | 2.1 | |||||
| 070419A | 0.97 | |||||
| 060904B | 0.703 | |||||
| 080710 | 0.845 | |||||
| 080319C | 1.95 | |||||
| 071010B | 0.947 | |||||
| 070110 | 2.352 | |||||
| 060210 | 3.91 | |||||
| 061007 | 1.261 | |||||
| 061121 | 1.314 | |||||
| 090812 | 2.452 | |||||
| 060218 | 0.0331 | |||||
| 100621A | 0.542 | |||||
| 050922C | 2.198 | |||||
| 091029 | 2.752 | |||||
| 071112C | 0.822 | |||||
| 080129 | 4.394 | |||||
| 081109A | 0.98 | |||||
| 081008 | 1.967 | |||||
| 091024 | 1.092 | |||||
| 090102 | 1.547 | |||||
| 110205A | 2.22 | |||||
| 121217A | 3.1 | |||||
| 100728B | 2.106 | |||||
| 110213A | 1.46 | |||||
| 100906A | 1.727 |
a is the GRB duration, is the initial Lorentz factor of the GRB firballs, is the peak photon energy of the GRBs derived from the fits with the Band function (Band et al. 1993) in the burst frame, and are the luminosity at the 1-second peak time slice and the time-integrated luminosity in the burst duration, respectively.
3 Correlation Analysis Results
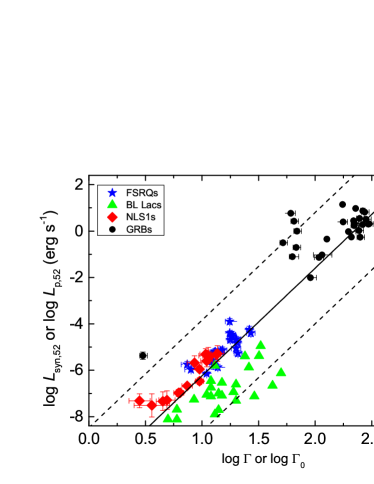
We make Spearman pair correlation analysis between the luminosity and Doppler boosting factor for each sub-groups of the ANGs and for the entire samples of the AGNs and GRBs. Our results are reported in Table 5. It is found that both (or ) and depend on (or ) with a power-law index ranging from to for different sub-classes of AGNs. We make correlation analysis for the entire AGN and GRB samples, as shown in Figure 1, the BL Lacs are separated from the FSRQs and NLS1 galaxies, and BL Lacs tend to be dimmer than the FSRQs and NLS1 galaxies with the same . Both GRBs and AGNs shape a clear sequence in the and planes. Our correlation analysis yields , and (see also Wu et al. 2011). However, this relation has very large dispersion (). Our Spearman correlation analysis between and does not reveal any statistical correlation with a chance probability between the two quantities in each sub-class of the AGNs.
Physically, the observed luminosity and photon energy are boosted by the jet bulk Doppler effect. As shown in Liang et al. (2015), by incorporating the Doppler boosting factor the derived relation is much tighter than the relation. We first examine whether the synchrotron radiations of the selected AGNs follow the relation of GRBs, i.e., (Liang et al. 2015). We calculate the synchrotron peak luminosity () with this relation for the AGNs by using their and values. Figure 2 shows as a function of the observed . It is found that the BL Lacs are in the low luminosity end of this relation with a very large scatter, and the derived of FSRQs and NLS1 galaxies are 4-5 orders of magnitude lower than the relation of GRBs. The FSRQs and NLS1 seem to follow another tight relation which is different from that of GRBs.
We explore relation for each sub-classes of the AGNs, using the stepwise regression analysis method. Our model is . Our results are reported in Table 6 and shown in Figure 3. We do not find a relation with for the BL Lacs, where is the probability of the F-test for our regression analysis. Similar and relations are found for the FSRQs and NLS1 galaxies. Our regression analysis for the combined sample of the FSRQs and NLS1 galaxies yields and , as shown in Figure 4. One can find that the dispersion of the three parameter relations are significantly tighter than the relations.
| relations | Source | ||||
| FSRQs | 0.79 | 0.39 | |||
| BL Lacs | 0.69 | 0.64 | |||
| NLS1 | 0.93 | 0.34 | |||
| AGN+GRB | 0.92 | 1.20 | |||
| FSRQs | 0.93 | 0.26 | |||
| BL Lacs | 0.66 | 0.71 | |||
| NLS1 | 0.93 | 0.36 | |||
| AGN+GRB | 0.89 | 1.03 | |||
| FSRQs | 0.02 | 0.94 | - | ||
| BL Lacs | -0.38 | 0.06 | - | ||
| NLS1 | -0.24 | 0.34 | - | ||
| FSRQs | 0.36 | 0.09 | - | ||
| BL Lacs | -0.08 | 0.71 | - | ||
| NLS1 | -0.06 | 0.81 | - | ||
| FSRQs | 0.07 | 0.76 | - | ||
| BL Lacs | -0.22 | 0.30 | - | ||
| NLS1 | -0.20 | 0.44 | - |
| relations | Source | |||||
|---|---|---|---|---|---|---|
| FSRQs | 0.86 | |||||
| BL Lacs | 0.71 | |||||
| NLS1 | 0.94 | |||||
| FSRQs+NLS1 | 0 | 0.94 | ||||
| FSRQs | 0.94 | |||||
| BL Lacs | 0.67 | |||||
| NLS1 | 0.93 | |||||
| FSRQs+NLS1 | 0 | 0.96 |
a is the probability of the F-test for our linear regression analysis results.
b and are the linear correlation coefficient and chance probability derived from the Spearman correlation analysis for each pairs of and . is the dispersion of the pair correlation.


4 Conclusion and Discussion
We have presented analysis on the Doppler boosting effect on the observed luminosity and photon energy in AGNs and GRBs. Our analysis show for the individual samples of the FSRQs, BL Lacs, and NLS1 galaxies. Similar relations are also found for . They are also globally follow the same relation as together with the GRBs. A tight relation is found in the combined sample of FSRQs and NLS1 galaxies. This relation is different from that derived from the GRB sample.
As shown in Lyu et al. (2014), the different distributions of GRBs and blazars in the plane may be due to both different radiation physics and jet environments. In addition, blazars have violent variability and a tentative flux- positive correlation is found in some blazars, such as 3C 279 and Mkn 501 (e.g. Zhang et al. 2013b; Wang et al. 2019). Taking the , , and values of Mkn 501 from Zhang et al. (2013b), we show Mkn 501 in four bright outbursts in Figure 2. One can find that it deviates the relation of GRBs in these outbursts. Wang et al. (2019) studied the - relation for the Mkn 501 in different outbursts in a broad temporal coverage. They found that a weak correlations in some outbursts. We further examine whether it follows the the relation within individual GRBs (Liang et al. 2004; Lu et al. 2012) in these outbursts. As shown in Figure 5, it still does not follow the relation of GRBs.
The observed luminosity is boosted by a factor of , where for a continuous jet, for a moving sphere, and is spectral index of the synchrotron radiation emission (Ghisellini et al. 1993). Our analysis results for the different sub-classes of AGNs are consistent with the prediction of the Doppler boosting effect. The dependence of on in the relation of the FSRQs and NLS1 galaxies is still consistent with this prediction. However, the dependence of on for the GRBs significantly deviate this prediction. This may be due to the initial Lorentz factor is not a true representative of the bulk motion of the radiating region. The values in this analysis are the Lorentz factor of the forward shocked medium derived from the fireball deceleration time (the afterglow onset peak time) based on the standard afterglow model (e.g. Sari et al. 1998). In addition, GRB jets are episodic. They are composed of erratic shells with different initial Lorentz factor since their energy input and baryon matter loaded may be different. Therefore, the values derived form the afterglow data may not be the true Lorentz factor of the radiating region of the prompt gamma-rays. For example, Wang et al. (2000) inferred that the initial Lorentz factor of the fireball of GRB 990123 is 1200 and the Lorentz factor at its prompt optical emission peak time is 300.
Nemmen et al. (2012) illustrated that GRB jet luminosity is correlated with the jet power, and this relation is consistent with the correlation between jet power and the synchrotron peak luminosity of some AGNs (see also Zhang et al. 2013a; Wang et al. 2014). Note that a substantial fraction of the kinetic energy of the baryons should transferred to a non-thermal population of relativistic electrons through Fermi acceleration in the shock (e.g. Meszaros & Rees 1993). is almost proportional to is within the error of the power-law index in the relation. We suspect that may be a representative of the kinetic power, or at least the power carried by the radiating electrons, in the radiating region (jet or jet patch). As discussed in Lyu et al. 2014, the different relation in GRBs and blazars may be resulted from different scenarios of synchrotron radiations. The tight relation may suggest that the observed gamma-ray luminosity of GRBs depends on the radiation physics and the jet power together.

Acknowledgements.
We appreciate helpful comments from the anonymous referee. We thank J. Zhang, Y. J. Wang, and Y. Q. Xue for providing the data of Mkn 501 and suggestive discussion. This work is supported by the National Natural Science Foundation of China (Grant No.11533003, 11851304, and U1731239), Guangxi Science Foundation and special funding for Guangxi distinguished professors (2017AD22006).References
- Abdo et al. (2009) Abdo, A. A., Ackermann, M., Ajello, M., et al. 2009, ApJ, 707, L142
- Amati et al. (2002) Amati, L., Frontera, F., Tavani, M., et al. 2002, A&A, 390, 81
- Band et al. (1993) Band, D., Matteson, J., Ford, L., et al. 1993, ApJ, 413, 281
- Eichler et al. (1989) Eichler, D., Livio, M., Piran, T., et al. 1989, Nature, 340, 126
- Ghisellini et al. (1998) Ghisellini, G., Celotti, A., Fossati, G., et al. 1998, MNRAS, 301, 451
- Ghirlanda et al. (2004) Ghirlanda, G., Ghisellini, G., & Lazzati, D. 2004, ApJ, 616, 331
- Ghisellini et al. (1996) Ghisellini, G., Maraschi, L., & Dondi, L. 1996, A&AS, 120, 503
- Ghisellini et al. (1993) Ghisellini, G., Padovani, P., Celotti, A., & Maraschi, L. 1993, ApJ, 407, 65
- Ghisellini et al. (2009) Ghisellini, G., Tavecchio, F., & Ghirlanda, G. 2009, MNRAS, 399, 2041
- Kobayashi et al. (1999) Kobayashi, S., Piran, T., & Sari, R. 1999, ApJ, 513, 669
- Kumar & Zhang (2015) Kumar, P., & Zhang, B. 2015, Phys. Rep., 561, 1
- Lü et al. (2012) Lü, J., Zou, Y.-C., Lei, W.-H., et al. 2012, ApJ, 751, 49
- Liang et al. (2004) Liang, E. W., Dai, Z. G., & Wu, X. F. 2004, ApJ, 606, L29
- Liang et al. (2015) Liang, E.-W., Lin, T.-T., Lü, J., et al. 2015, ApJ, 813, 116
- Liang et al. (2010) Liang, E.-W., Yi, S.-X., Zhang, J., et al. 2010, ApJ, 725, 2209
- Lithwick & Sari (2001) Lithwick, Y., & Sari, R. 2001, ApJ, 555, 540
- Lu et al. (2012) Lu, R.-J., Wei, J.-J., Liang, E.-W., et al. 2012, ApJ, 756, 112
- Lyu et al. (2014) Lyu, F., Liang, E.-W., Liang, Y.-F., et al. 2014, ApJ, 793, 36
- Ma et al. (2014) Ma, R., Xie, F.-G., & Hou, S. 2014, ApJ, 780, L14
- Maraschi et al. (1992) Maraschi, L., Ghisellini, G., & Celotti, A. 1992, ApJ, 397, L5
- Massaro et al. (2008) Massaro, F., Tramacere, A., Cavaliere, A., et al. 2008, A&A, 478, 395
- Meszaros & Rees (1993) Meszaros, P., & Rees, M. J. 1993, ApJ, 405, 278
- Nemmen et al. (2012) Nemmen, R. S., Georganopoulos, M., Guiriec, S., et al. 2012, Science, 338, 1445
- Pe’er et al. (2007) Pe’er, A., Ryde, F., Wijers, R. A. M. J., Mészáros, P., & Rees, M. J. 2007, ApJ, 664, L1
- Peng et al. (2014) Peng, F.-K., Liang, E.-W., Wang, X.-Y., et al. 2014, ApJ, 795, 155
- Paczynski (1991) Paczynski, B. 1991, actaa, 41, 257
- Sari & Piran (1999) Sari, R., & Piran, T. 1999, ApJ, 520, 641
- Sari et al. (1999) Sari, R., Piran, T., & Halpern, J. P. 1999, ApJ, 519, L17
- Sari et al. (1998) Sari, R., Piran, T., & Narayan, R. 1998, ApJ, 497, L17
- Sikora et al. (1994) Sikora, M., Begelman, M. C., & Rees, M. J. 1994, ApJ, 421, 153
- Sikora et al. (2009) Sikora, M., Stawarz, Ł., Moderski, R., Nalewajko, K., & Madejski, G. M. 2009, ApJ, 704, 38
- Sun et al. (2015) Sun, X.-N., Zhang, J., Lin, D.-B., et al. 2015, ApJ, 798, 43
- Tang et al. (2015) Tang, Q.-W., Peng, F.-K., Wang, X.-Y., & Tam, P.-H. T. 2015, ApJ, 806, 194
- Tramacere et al. (2009) Tramacere, A., Giommi, P., Perri, M., et al. 2009, A&A, 501, 879
- Urry et al. (1999) Urry, C. M., Falomo, R., Scarpa, R., et al. 1999, ApJ, 512, 88
- Urry & Padovani (1995) Urry, C. M., & Padovani, P. 1995, PASP, 107, 803
- Wang et al. (2014) Wang, F. Y., Yi, S. X., & Dai, Z. G. 2014, ApJ, 786, L8
- Wang & Wei (2011) Wang, J., & Wei, J. Y. 2011, ApJ, 726, L4
- Wang et al. (2000) Wang, X. Y., Dai, Z. G., & Lu, T. 2000, MNRAS, 319, 1159
- Wang et al. (2019) Wang, Y., Zhu, S., Xue, Y., et al. 2019, ApJ, 885, 8
- Woosley (1993) Woosley, S. E. 1993, ApJ, 405, 273
- Wu et al. (2011) Wu, Q., Zou, Y.-C., Cao, X., Wang, D.-X., & Chen, L. 2011, ApJ, 740, L21
- Yonetoku et al. (2004) Yonetoku, D., Murakami, T., Nakamura, T., et al. 2004, ApJ, 609, 935
- Zhang et al. (2013a) Zhang, J., Liang, E.-W., Sun, X.-N., et al. 2013, ApJ, 774, L5
- Zhang et al. (2012) Zhang, J., Liang, E.-W., Zhang, S.-N., & Bai, J. M. 2012, ApJ, 752, 157
- Zhang et al. (2014) Zhang, J., Sun, X.-N., Liang, E.-W., et al. 2014, ApJ, 788, 104
- Zhang et al. (2015) Zhang, J., Xue, Z.-W., He, J.-J., Liang, E.-W., & Zhang, S.-N. 2015, ApJ, 807, 51
- Zhang & Yan (2011) Zhang, B., & Yan, H. 2011, ApJ, 726, 90
- Zhang et al. (2013b) Zhang, J., Zhang, S.-N., & Liang, E.-W. 2013, ApJ, 767, 8
- Zhang et al. (2017) Zhang, X., Zhang, H., Zhang, X., et al. 2017, Ap&SS, 362, 224
- Zou et al. (2015) Zou, Y.-C., Cheng, K. S., & Wang, F. Y. 2015, ApJ, 800, L23
- Zhu et al. (2019) Zhu, B.-T., Zhang, L., & Fang, J. 2019, ApJ, 873, 120
- Zhu et al. (2016) Zhu, Y.-K., Zhang, J., Zhang, H.-M., et al. 2016, RAA, 16, 170