Low-energy spin excitations in optimally doped CaFe0.88Co0.12AsF superconductor studied with inelastic neutron scattering
Abstract
There are few inelastic neutron scattering (INS) reports on the superconducting single crystals of FeAs-1111 system, even though it was first discovered in 2008, due to the extreme difficulty in large single crystal growth. In this paper, we have studied the low-energy spin excitations in the optimally electron-doped CaFe0.88Co0.12AsF single crystals with = 21 K by INS. The resonance energy of the superconducting spin resonant mode with = 12 meV amounts to 6.6 , which constitutes the largest / ratio among iron-based superconductors reported to date. The large ratio implies a strong coupling between conduction electrons and magnetic excitations in CaFe0.88Co0.12AsF. The resonance possesses a magnonlike upward dispersion along transverse direction due to the anisotropy of spin-spin correlation length within plane in the normal-state, which points to a spin fluctuation mediated sign-reversed wave pairing in CaFe0.88Co0.12AsF.
pacs:
74.70.Xa, 78.70.Nx, 74.20.Rp, 74.25.HaNeutron spin resonance is commonly observed in the superconducting (SC) state of copper-oxide Rossat-Mignod et al. (1991); Mook et al. (1993), heavy-fermion Sato et al. (2001); Stock et al. (2008), iron-pnictide and iron-chalcogenide superconductors Christianson et al. (2008); Liu et al. (2010). The neutron spin resonance is a collective magnetic excitation occurring below the SC critical temperature with temperature dependence of its intensity similar to the SC order parameter Eschrig (2006). The energy of the resonance at antiferromagnetic wave vector is found to be proportional to for a variety of unconventional superconductors Yu et al. (2009); Inosov et al. (2011). The most common interpretation of the resonance is that it is a spin exciton, which arises from particle-hole type excitations involving nearly parallel, or nested, sections on the Fermi surfaces that possess opposite signs of the superconducting pairing Eschrig (2006); Sidis et al. (2007). In iron-based superconductors the spin resonance is regarded as the hallmark of sign-reversed wave pairings with Bogoliubov quasiparticles in the superconducting state connected by Maier and Scalapino (2008); Parish et al. (2008); Korshunov and Eremin (2008); Wang and Lee (2011); Hirschfeld et al. (2011); Seo et al. (2008); Mazin and Schmalian (2009); Chubukov et al. (2008); Richard et al. (2011) and reveals an upward magnonlike dispersion Zhang et al. (2018); Kim et al. (2013). Moreover, whether the corresponding spin excitations above have sufficient spectral weight can reveal their qualification to be regarded as pairing bosons.
As a prototypal FeAs-1111 system, the parent compound CaFeAsF has a ZrCuSiAs-type tetragonal structure, as shown in the right inset of Fig. 1(a). The system undergoes a tetragonal to orthorhombic phase transition at 134 K, whereas antiferromagnetic order further sets in at 114 K. The antiferromagnetic order is completely suppressed in optimally doped CaFe0.88Co0.12AsF Xiao et al. (2009). Temperature dependence of resistivity for the single crystal CaFe0.88Co0.12AsF is shown in Fig. 1(a). The resistivity as a function of temperature drops down (or falls) gradually with the decrease of temperature in the range above 90 K. Below 90 K, the resistivity exhibits a clear upward semiconducting behavior and a sudden drop at = 21 K. Here we report an INS study on the low-energy spin excitations in the optimally electron-doped CaFe0.88Co0.12AsF single crystals. We find that the resonance energy = 12 meV amounts to 6.6 contrary to 3.7 ( = 7 meV) in previous INS report on powder sample Price et al. (2013). Also, the resonance possesses a magnonlike upward dispersion along transverse direction due to the anisotropy of spin-spin correlation length within plane in the normal-state.
Our neutron scattering experiment was carried out on IN8-thermal neutron three-axis spectrometer at Institut Laue-Langevin, Grenoble, France. The study was enabled by a recent breakthrough in the crystal-growth technique for the CaFeAsF compound family, where we utilized temperature oscillations during the growth Ma et al. (2022). We used horizontally and vertically focused pyrolytic graphite [PG (002)] monochromator and analyzer with fixed scattered (final) energy = 14.7 meV. The high order harmonics from the PG (002) monochromator are suppressed by an oriented PG-filter in the scattered beam. The sample consisted of over 300 pieces of CaFe0.88Co0.12AsF single crystals with a total mass of about 1.0 g which were grown by the similar temperature oscillating technique [See Supplementary Materials]. As shown in the left inset of Fig. 1(a), these crystals were coaligned within 6∘ mosaicity in the (, , 0) scattering plane on aluminum plates using a hydrogen-free adhesive. Here and throughout this letter, the wave vector is expressed in reciprocal lattice units (r.l.u.) as (, , ). Using the tetragonal crystal structure, the wave vector, expressed in inverse Angstrom, is = (, , ) with lattice parameters = 3.87 and = 8.58 . Raw data were converted into the imaginary part of the magnetic susceptibility (,) after subtracting estimates of the nonmagnetic background and correcting for the Bose population factor [See Supplementary Materials].
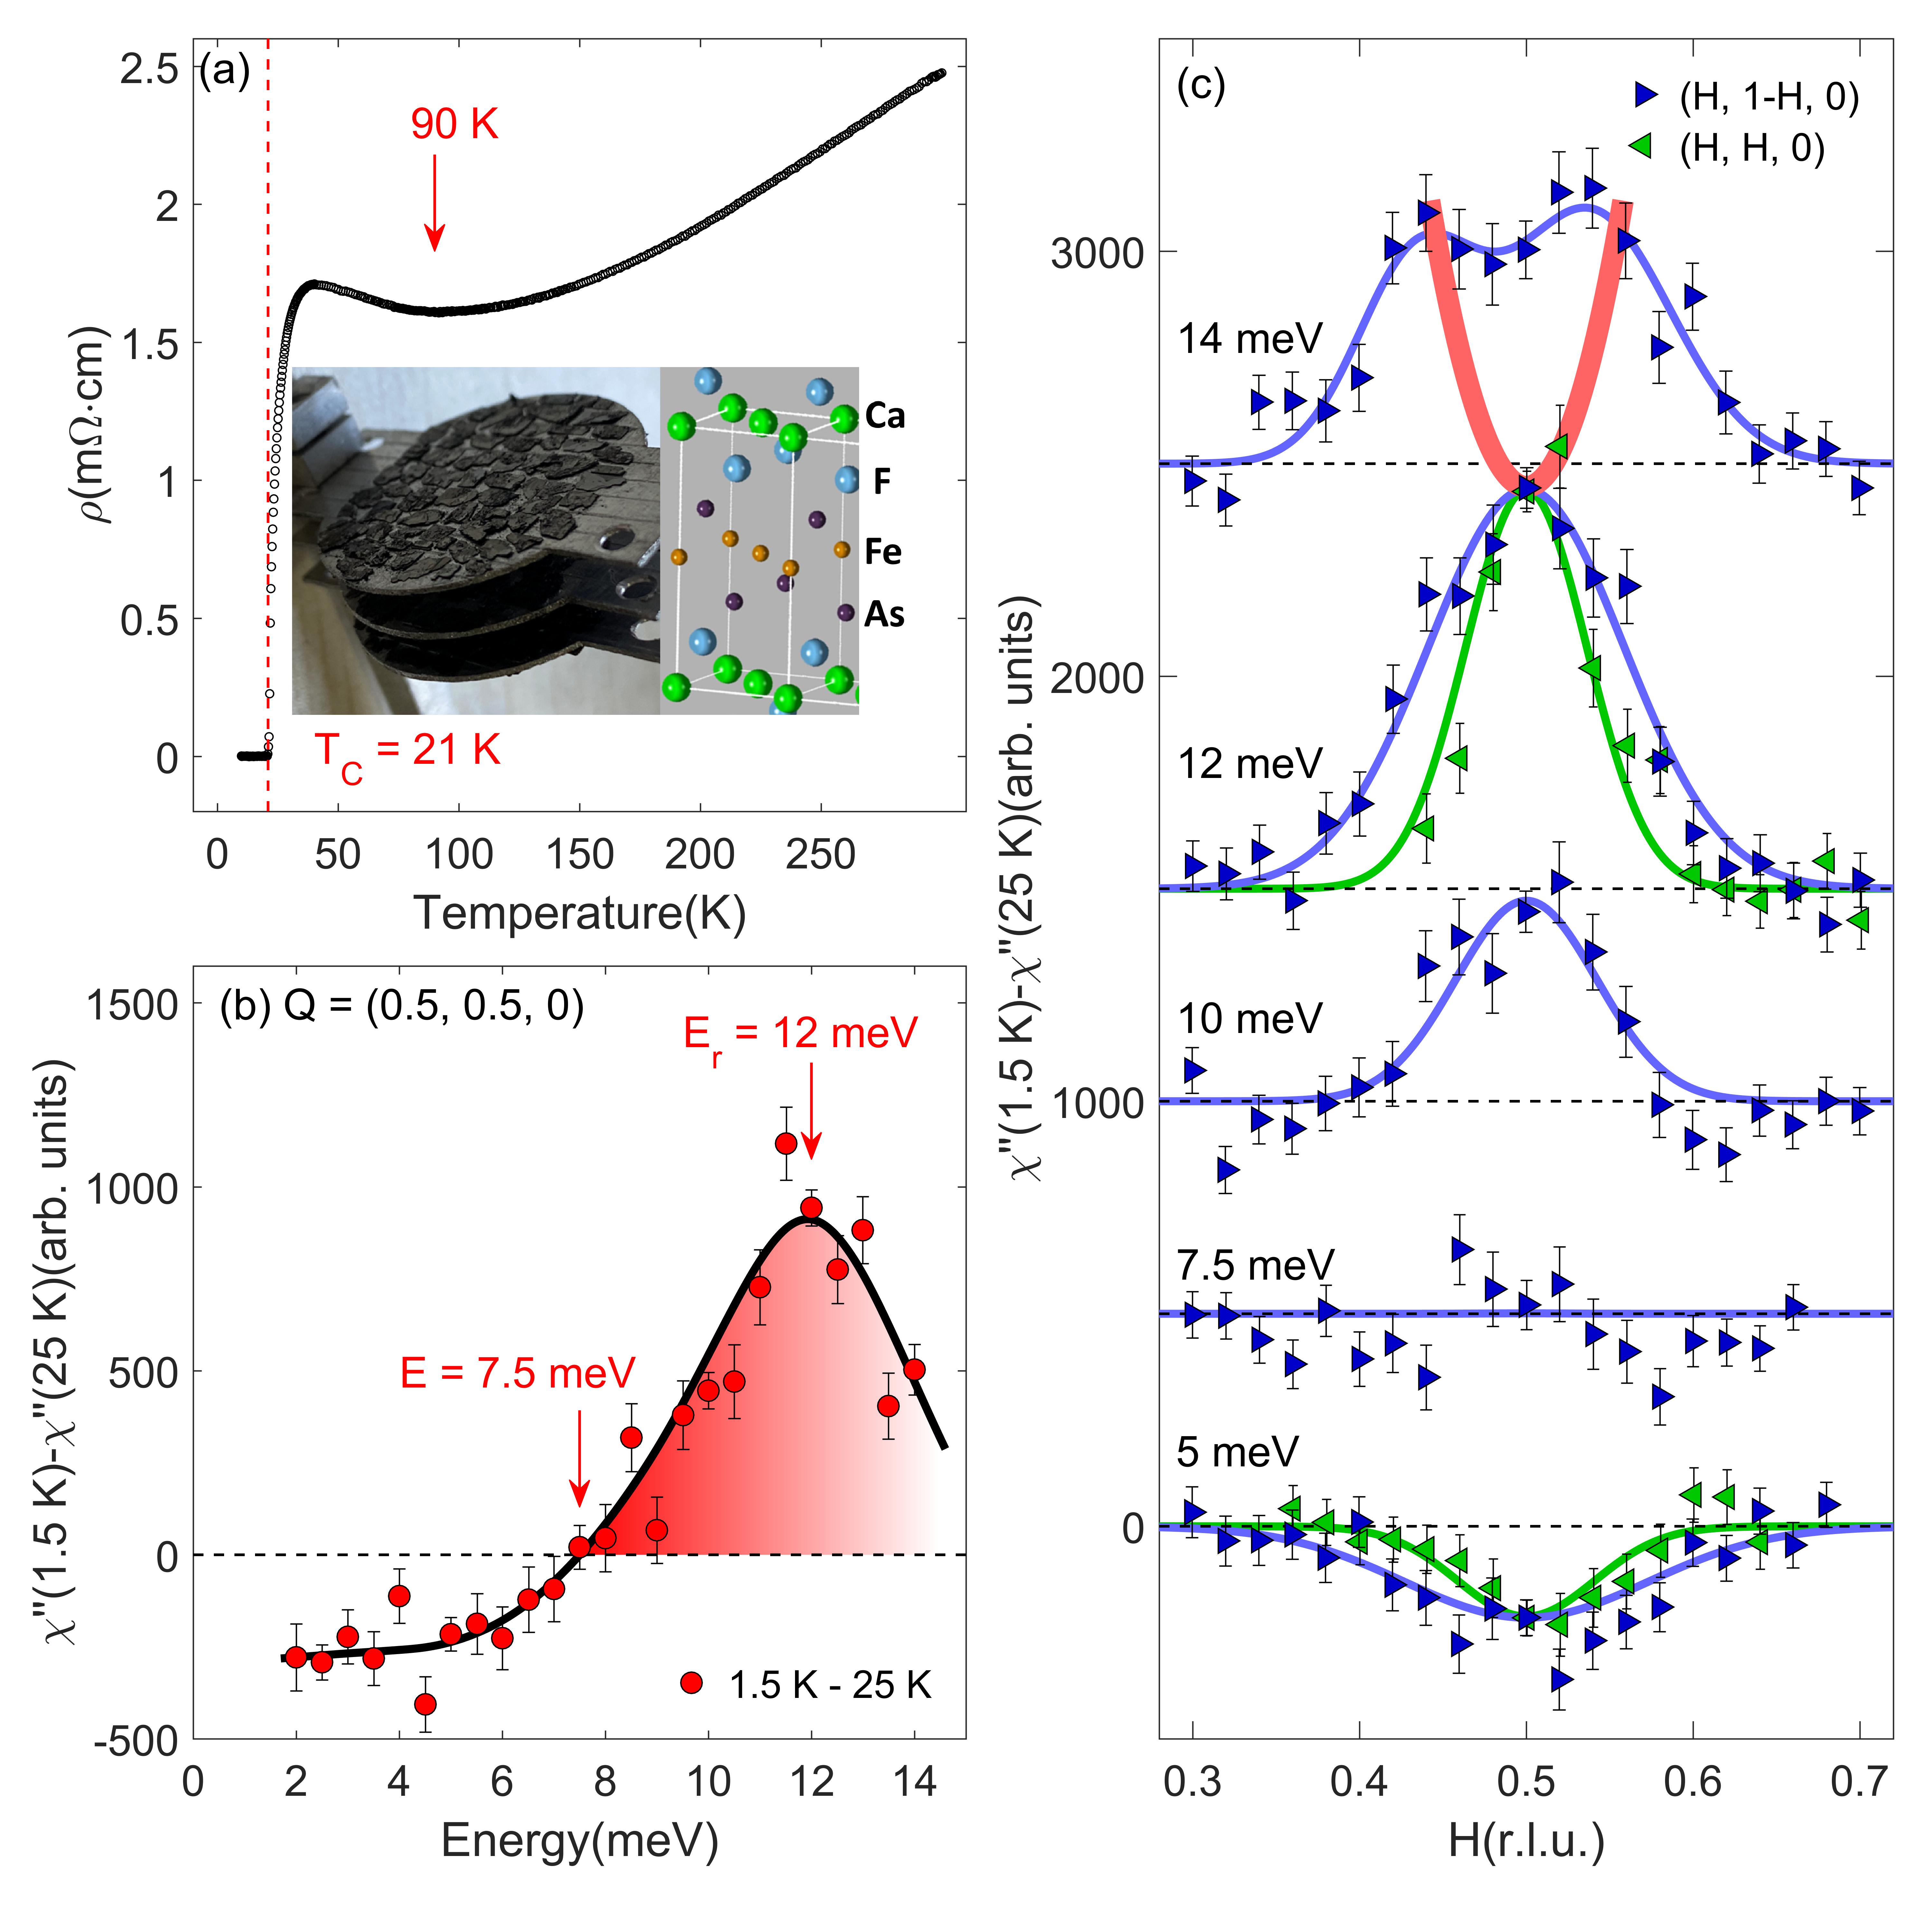
Figure 1(b) shows the temperature difference of imaginary part of the magnetic susceptibility (,) for CaFe0.88Co0.12AsF between the normal state at = 25 K and the SC state at = 1.5 K with = (0.5, 0.5, 0) in tetragonal coordinates and energy transfer meV. Below , we observe a suppression of the low energy magnetic response as compared to the normal state below = 7.5 meV, followed by a net enhancement of the spin supsceptibility at = 12 meV. The enhancement of the spin susceptibility in the SC state is a hallmark of the spin resonance excitations. That energy is noticeably larger than the resonance peak which has been previously attributed at 7.5 meV in a powder sample of CaFe0.88Co0.12AsF Price et al. (2013) where all crystal orientations are necessarilly averaged out. Clearly, no resonance peak is observed at that energy in our data. Our analysis of the difference of the energy scans at 1.5 K and 25 K at is further confirmed by a similar measurement at another antiferromagnetic point with larger momentum = (1.5, 0.5, 0) [Fig. S1(d)]. The peak is weaker due to the magnetic form factor but it is peaked at the same energy ( = 12 meV). That difference in temperature, which is the usual way to determine the resonance energy Sidis et al. (2004); Inosov et al. (2010), was not performed in the previous study Price et al. (2013). Instead, the resonance energy was determined using an extrapolation of the phononic background. As shown by our energy scans at different sample orientations [Fig. S1(a)], the background is clearly not monotonic as assumed in the powder sample study Price et al. (2013). The measurements on powder sample show two maxima in the raw data at = 7.5 meV and = 11 meV, likely due to additional phonon peaks in the neutron spectra. We believe the attribution of a resonance peak energy at 7.5 meV is therefore incorrect and incompatible with our detailed and thorough analysis done on single crystals. As we know, the resonant peak energy in other iron-based superconductors corresponds to 4.9 in average, which is only slightly different from 5.3 for the cuprates and suggests a universal correlation between the superconductivity and the spin excitations in these unconventional superconductors Xie et al. (2018); Sidis et al. (2004). Notably, the resonance energy here amounts to 6.6 which means that the ratio of / is the highest value among the previously reported values of / in iron-based superconductors and might imply a stronger coupling between free electrons and magnetic excitations in this material compared to the other pnictides.
As shown in Fig. 1(c), a magnonlike dispersion of spin resonance is confirmed by the temperature difference of constant-energy scans between the susceptibility in the normal and SC states. The resonance disperses upwards away from = (0.5, 0.5, 0) along the transverse (, 1-, 0) direction. As the energy is increased, the resonance peak broadens and finally splits into two symmetric peaks around at = 14 meV indicating the spectral weight progressively moves away from . In contrast, along the longitudinal (, , 0) direction in our scattering geometry, we find that there is no indication of variation of the feature’s momentum position versus energy. This observation is consistent with previous work on electron-doped Ba(Fe0.963Ni0.037)2As2 where the resonance is found to peak sharply at along the longitudinal direction, but disperses upwards away from along the transverse direction Kim et al. (2013). Also, there exists a ringlike upward dispersion of spin resonance away from along both the longitudinal and transverse direction in Ba0.67K0.33(Fe1-xCox)2As2 Zhang et al. (2018). In contrast, a downward dispersions of spin resonance was observed in KCa2Fe4As4F2 superconductor Hong et al. (2020), a behavior closely resembling the low branch of the hourglass-type spin resonance in cuprates Eschrig (2006). Theoretical calculations within the spin-exciton model for iron-based superconductors predict both an upward and a downward dispersion depending on the details of the bands and the symmetry of the superconducting order parameter Zhang et al. (2010); Maier et al. (2012); Korshunov and Eremin (2008); Das and Balatsky (2011). In a superconducting pairing state driven by commensurate short-range spin fluctuations, the resonance mode disperses with increasing energy in an anisotropic pattern broadening most rapidly along the transverse rather than the longitudinal direction and displays an elliptical shape of the spin-resonance mode in -space Zhang et al. (2010) as shown in the schematic diagram Fig. 2(a).
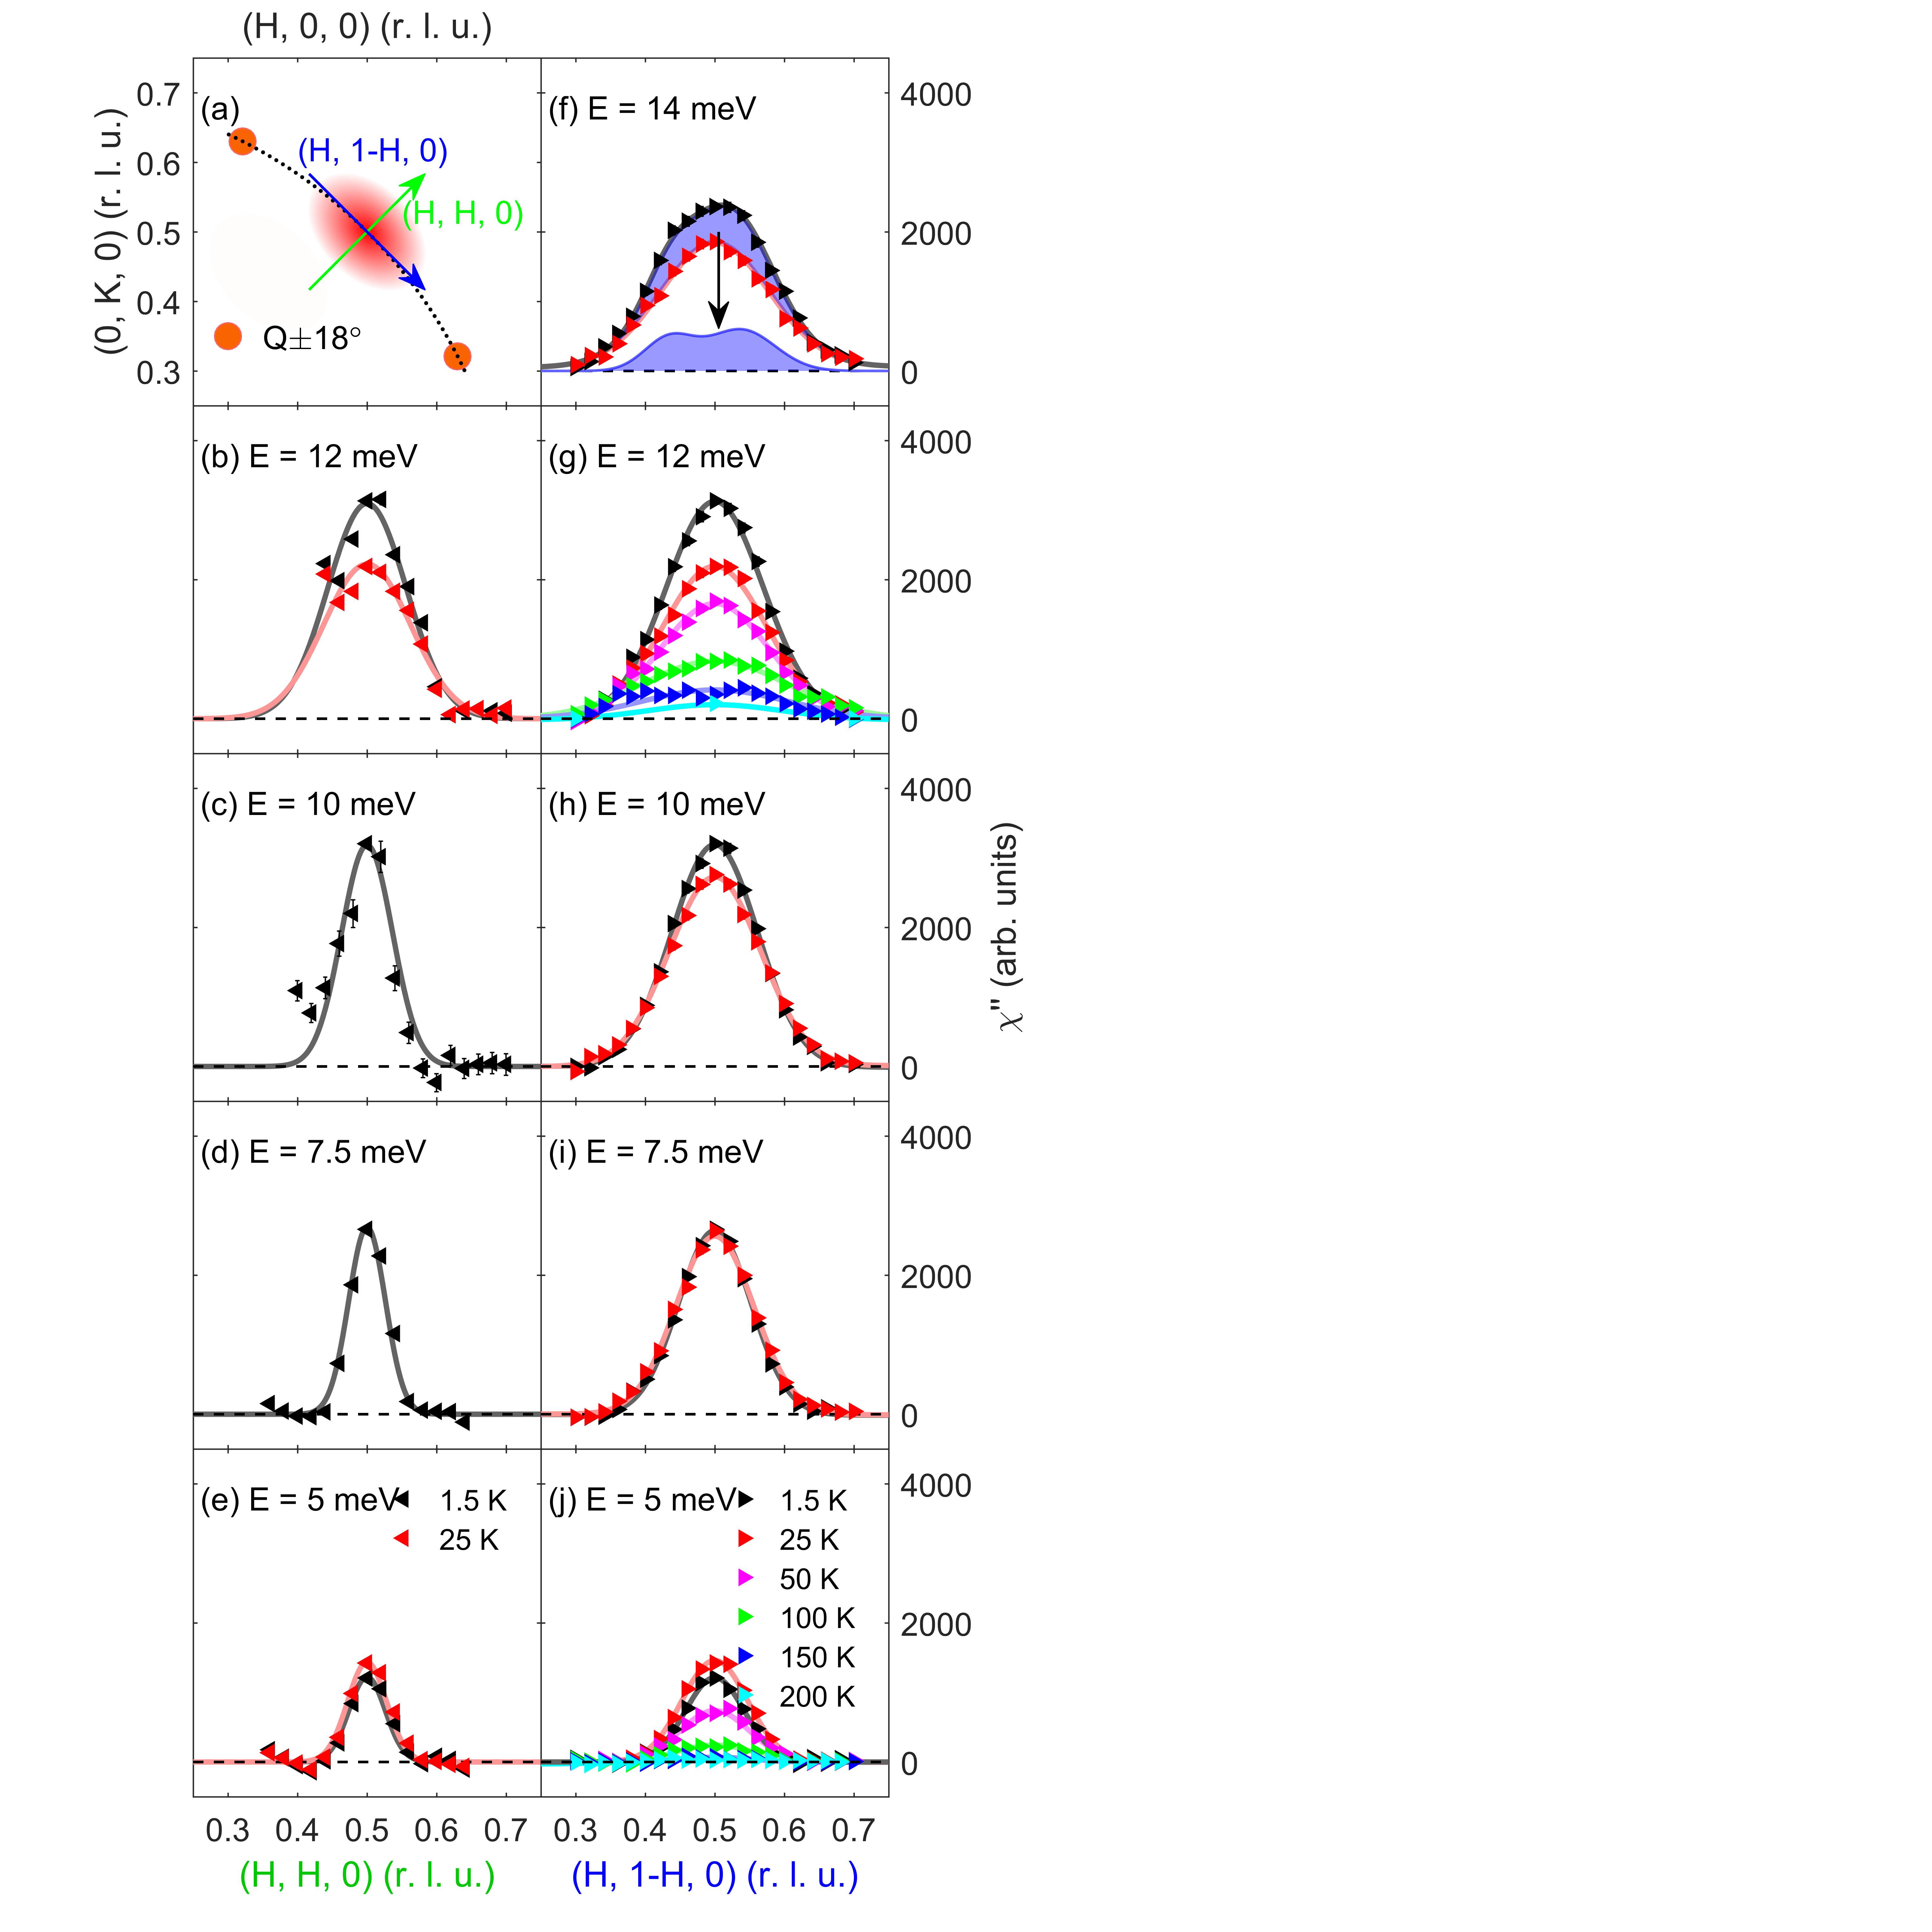
The -space anisotropy of the spin resonance in the SC state may be associated with the normal state anisotropic scattering pattern found locally around , which is a consequence of the fermiology, the shape of the electron and hole like pockets involved in the particle-hole excitation process. The close relationship between the upward spin resonance dispersion and normal state spin fluctuations anisotropy can be illustrated from constant-energy scans in the normal and superconducting states in the vicinity of = (0.5, 0.5, 0), focusing on the longitudinal and transverse direction as displayed in the schematic diagram Fig. 2(a). Background scattering measured by rotating the sample by ∘ has been removed in order to display the genuine magnetic signals. Figure 2(b)-(j) shows the imaginary part of the magnetic susceptibility (,) for CaFe0.88Co0.12AsF at various temperature and energy transfer along longitudinal and transverse -scans respectively. With increasing energy the widths of the respective peaks at the corresponding temperatures and scan directions become broader. Notably, the longitudinal scans show much steeper lineshape than transverse scans. The signal’s transverse momentum profile is further found to become broader with increasing temperature [Fig. 2(g, j)] along with a decrease in the peak amplitude.
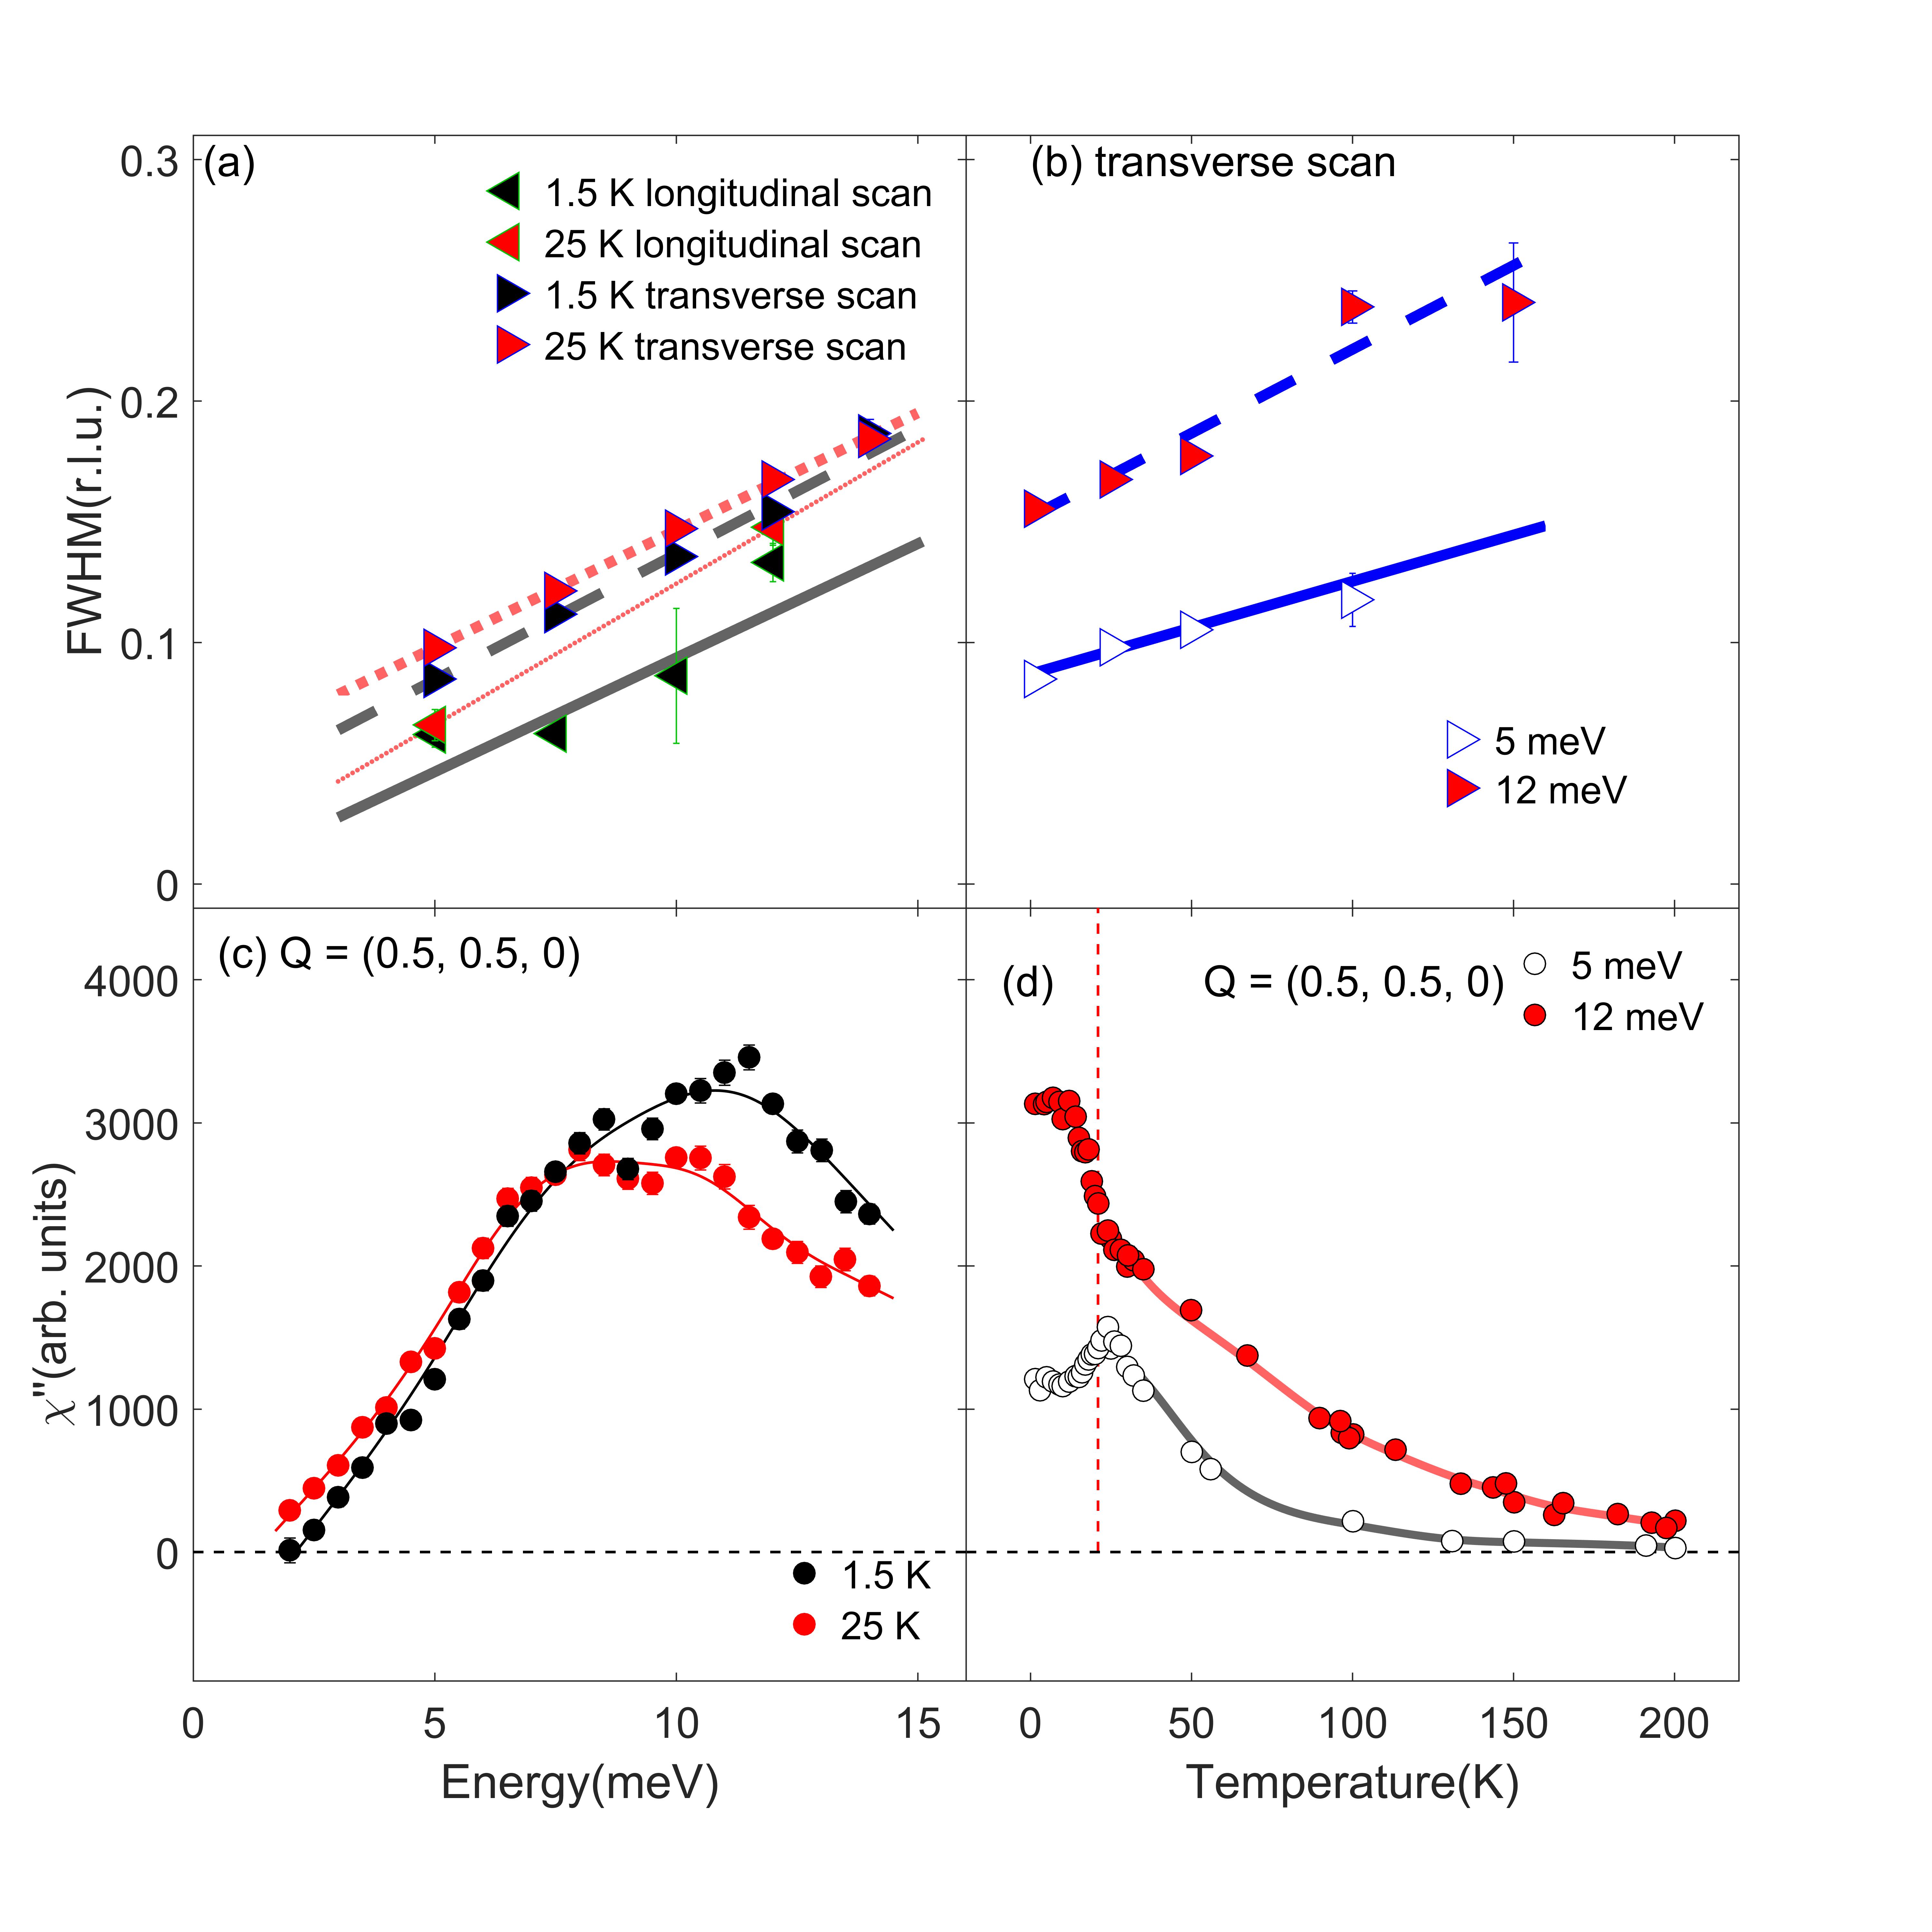
To clearly illustrate the -space anisotropy, we compare the full-width-at-half-maximum (FWHM) between transverse and longitudinal scans in Fig. 3(a), in both the SC and the normal states. The FWHM of peak obtained by Gaussian fitting is associated with the spin-spin correlation length. The FWHM of transverse scan is apparently larger than that of longitudinal scan. The difference in linewidth of the longitudinal (narrower) and transverse (broader) scans is not due to the instrument resolution but from the intrinsic anisotropy in momentum -space of the spin fluctuations. Actually, the instrumental resolution is roughly isotropic in the experiment. Therefore, the double peak structure does not show up in longitudinal scans as the peak is sharper along that direction compared to the transverse scans. Within the probed energy range ( meV), the widths of spin excitations increase monotonically with increasing energy. Figure 3(b) shows the temperature dependence of the spin excitation widths along transverse direction at = 5 and 12 meV. The temperature dependent broadening indicates a gradual reduction in the spin-correlation length with temperature which behavior has also been observed in LaFeAsO, Co/Ni/K doped BaFe2As2 Zhang et al. (2015, 2016); Wang et al. (2013) and references therein.
Figure 3(c) shows the energy dependence of the imaginary part of the magnetic susceptibility (,) at = 1.5 K and 25 K and = (0.5, 0.5, 0). The spin susceptibility develops with increasing energy, shows a hump around 10 meV and then decreases gradually as the FWHM broadening with energy [Fig. 3(a)]. Figure 3(d) displays the detailed temperature dependence of the magnetic susceptibility (,) for = 5 and 12 meV and = (0.5, 0.5, 0), which shows pronounced anomalies around . The observation is consistent with a redistribution of the scattering intensity, which may also involve momenta slightly away from as shown by the gradual increase of the FWHM in Fig. 3(b).
Given the intrinsic nature of the anisotropy of spin fluctuations in CaFe0.88Co0.12AsF, one arrives to the conclusion of a close relationship between the upward dispersion of the spin resonance and the anisotropic spin fluctuations in the normal state. The fully gapped wave superconductivity can be driven by the short-range spin fluctuations which generally exhibit an anisotropy in momentum space with width larger along the direction transverse to than along the longitudinal direction and can be understood by examining the intra-orbital scattering processes in systems away from perfect nesting Zhang et al. (2010). The same type of anisotropy in the SC state gives rise to an elliptical shape of the spin resonant mode which disperses with increasing energy in the pattern broadening more rapidly along the transverse than along the longitudinal direction Zhang et al. (2010). A more elliptically shaped image of the spin resonant mode can be produced by the intrinsic anisotropy in momentum space associated with anisotropic dispersion of the resonant mode Zhang et al. (2010).
In conclusion, we have observed a sharp superconducting spin resonance at resonance energy = 12 meV. The magnonlike dispersion of spin resonance can be attributed to the -space anisotropy of spin excitations in the normal state of optimally doped CaFe0.88Co0.12AsF, and it indicates sign-reversed wave pairing possibly mediated by magnetic fluctuations.
Acknowledgements.
The work was supported by the National Natural Science Foundation of China (Grant No. 12004418), the National Key Research and Development of China (Grant No. 2018YFA0704200, 2022YFA1602803) and the Strategic Priority Research Program of Chinese Academy of Sciences (Grant No. XDB25000000).References
- Rossat-Mignod et al. (1991) J. Rossat-Mignod, L. P. Regnault, C. Vettier, P. Bourges, P. Burlet, J. Bossy, J. Y. Henry, and G. Lapertot, Physica C-superconductivity and Its Applications , 86 (1991).
- Mook et al. (1993) H. A. Mook, M. Yethiraj, G. Aeppli, T. E. Mason, and T. Armstrong, Phys. Rev. Lett. 70, 3490 (1993).
- Sato et al. (2001) N. K. Sato, K. M. N. Aso, P. T. R. Shiina, G. Varelogiannis, C. Geibel, F. Steglich, P. Fulde, and T. Komatsubara, Nature 410, 340 (2001).
- Stock et al. (2008) C. Stock, C. Broholm, J. Hudis, H. J. Kang, and C. Petrovic, Phys. Rev. Lett. 100, 087001 (2008).
- Christianson et al. (2008) A. D. Christianson, E. A. Goremychkin, R. Osborn, S. Rosenkranz, M. D. Lumsden, C. D. Malliakas, I. S. Todorov, H. Claus, D. Y. Chung, M. G. Kanatzidis, R. I. Bewley, and T. Guidi, Nature 456, 930 (2008).
- Liu et al. (2010) T. J. Liu, J. Hu, B. Qian, D. Fobes, Z. Q. Mao, W. Bao, M. Reehuis, S. A. J. Kimber, K. Prokes, S. Matas, D. N. Argyriou, A. Hiess, A. Rotaru, H. Pham, L. Spinu, Y. Qiu, V. Thampy, A. T. Savici, J. A. Rodriguez, and C. Broholm, Nat. Mater. 9, 718 (2010).
- Eschrig (2006) M. Eschrig, Adv. Phys. 55, 47 (2006).
- Yu et al. (2009) G. Yu, Y. Li, E. M. Motoyama, and M. A. Greven, Nat.Phys. 5, 873 (2009).
- Inosov et al. (2011) D. S. Inosov, J. T. Park, A. Charnukha, Y. Li, A. V. Boris, B. Keimer, and V. Hinkov, Phys. Rev. B 83, 214520 (2011).
- Sidis et al. (2007) Y. Sidis, S. Pailhès, V. Hinkov, B. Fauqué, C. Ulrich, L. Capogna, A. Ivanov, L.-P. Regnault, B. Keimer, and P. Bourges, Comptes Rendus Physique 8, 745 (2007).
- Maier and Scalapino (2008) T. A. Maier and D. J. Scalapino, Phys. Rev. B 78, 020514 (2008).
- Parish et al. (2008) M. M. Parish, J. Hu, and B. A. Bernevig, Phys. Rev. B 78, 144514 (2008).
- Korshunov and Eremin (2008) M. M. Korshunov and I. Eremin, Phys. Rev. B 78, 140509 (2008).
- Wang and Lee (2011) F. Wang and D.-H. Lee, Science 332, 200 (2011).
- Hirschfeld et al. (2011) P. J. Hirschfeld, M. M. Korshunov, and I. I. Mazin, Reports on Progress in Physics 74, 124508 (2011).
- Seo et al. (2008) K. Seo, B. A. Bernevig, and J. Hu, Phys. Rev. Lett. 101, 206404 (2008).
- Mazin and Schmalian (2009) I. Mazin and J. Schmalian, Physica C: Superconductivity 469, 614 (2009).
- Chubukov et al. (2008) A. V. Chubukov, D. V. Efremov, and I. Eremin, Phys. Rev. B 78, 134512 (2008).
- Richard et al. (2011) P. Richard, T. Sato, K. Nakayama, T. Takahashi, and H. Ding, Reports on Progress in Physics 74, 124512 (2011).
- Zhang et al. (2018) R. Zhang, W. Wang, T. A. Maier, M. Wang, M. B. Stone, S. Chi, B. Winn, and P. Dai, Phys. Rev. B 98, 060502 (2018).
- Kim et al. (2013) M. G. Kim, G. S. Tucker, D. K. Pratt, S. Ran, A. Thaler, A. D. Christianson, K. Marty, S. Calder, A. Podlesnyak, S. L. Bud’ko, P. C. Canfield, A. Kreyssig, A. I. Goldman, and R. J. McQueeney, Phys. Rev. Lett. 110, 177002 (2013).
- Xiao et al. (2009) Y. Xiao, Y. Su, R. Mittal, T. Chatterji, T. Hansen, C. M. N. Kumar, S. Matsuishi, H. Hosono, and T. Brueckel, Phys. Rev. B 79, 060504 (2009).
- Price et al. (2013) S. Price, Y. Su, Y. Xiao, D. T. Adroja, T. Guidi, R. Mittal, S. Nandi, S. Matsuishi, H. Hosono, and T. Brückel, Journal of the Physical Society of Japan 82, 104716 (2013).
- Ma et al. (2022) M.-W. Ma, B. Ruan, M. Zhou, Y. Gu, Q. Yang, J. Sun, and Z.-A. Ren, Journal of Crystal Growth 585, 126562 (2022).
- Sidis et al. (2004) Y. Sidis, S. Pailhès, B. Keimer, P. Bourges, C. Ulrich, and L. P. Regnault, physica status solidi (b) 241, 1204 (2004).
- Inosov et al. (2010) D. S. Inosov, J. T. Park, P. Bourges, D. L. Sun, Y. Sidis, A. Schneidewind, K. Hradil, D. Haug, C. T. Lin, B. Keimer, and V. Hinkov, Nat. Phys. 6, 178 (2010).
- Xie et al. (2018) T. Xie, D. Gong, H. Ghosh, A. Ghosh, M. Soda, T. Masuda, S. Itoh, F. Bourdarot, L.-P. Regnault, S. Danilkin, S. Li, and H. Luo, Phys. Rev. Lett. 120, 137001 (2018).
- Hong et al. (2020) W. Hong, L. Song, B. Liu, Z. Li, Z. Zeng, Y. Li, D. Wu, Q. Sui, T. Xie, S. Danilkin, H. Ghosh, A. Ghosh, J. Hu, L. Zhao, X. Zhou, X. Qiu, S. Li, and H. Luo, Phys. Rev. Lett. 125, 117002 (2020).
- Zhang et al. (2010) J. Zhang, R. Sknepnek, and J. Schmalian, Phys. Rev. B 82, 134527 (2010).
- Maier et al. (2012) T. A. Maier, P. J. Hirschfeld, and D. J. Scalapino, Phys. Rev. B 86, 094514 (2012).
- Das and Balatsky (2011) T. Das and A. V. Balatsky, Phys. Rev. Lett. 106, 157004 (2011).
- Zhang et al. (2015) Q. Zhang, R. M. Fernandes, J. Lamsal, J. Yan, S. Chi, G. S. Tucker, D. K. Pratt, J. W. Lynn, R. W. McCallum, P. C. Canfield, T. A. Lograsso, A. I. Goldman, D. Vaknin, and R. J. McQueeney, Phys. Rev. Lett. 114, 057001 (2015).
- Zhang et al. (2016) W. Zhang, J. T. Park, X. Lu, Y. Wei, X. Ma, L. Hao, P. Dai, Z. Y. Meng, Y.-f. Yang, H. Luo, and S. Li, Phys. Rev. Lett. 117, 227003 (2016).
- Wang et al. (2013) M. Wang, C. Zhang, X. Lu, G. Tan, H. Luo, Y. Song, M. Wang, X. Zhang, E. Goremychkin, T. Perring, T. Maier, Z. Yin, K. Haule, G. Kotliar, and P. Dai, Nat. Commun. 4, 2874 (2013).