Local electronic structure of dilute hydrogen in -Ga2O3 probed by muons
Abstract
The local electronic structure of muons (Mu) as dilute pseudo-hydrogen in single-crystalline -Ga2O3 has been studied by the muon spin rotation/relaxation (SR). High-precision measurements over a long time range of 25 s have clearly identified two distinct Mu states: a quasi-static Mu (Mu1) and fast-moving Mu (Mu2). By comparing this result with predictions from the recently established ambipolarity model, these two states are respectively attributed to the relaxed-excited states associated with the donor () and acceptor () levels predicted by density functional theory (DFT) calculations for the interstitial H. Furthermore, the local electronic structure of Mu1 is found to be an OMu-bonded state with three-coordinated oxygen. The structure is almost identical with the thermal equilibrium state of H, and it is found to function as an electron donor. The other Mu2 is considered to be in the hydride state (Mu-) from the ambipolarity model, suggesting that it is in fast diffusion motion through the short-lived neutral state due to the charge exchange reaction with conduction electrons (MuMu-).
I Introduction
Gallium trioxide (-Ga2O3) is attracting attention as a material for high-voltage power devices and other applications because of its large band gap (4.9 eV) and associated high critical electric field Galazka (2018), where control of electrical activity by /-type carrier doping is one of the critical issues. While Sn or Si doping is known to induce -type conductivity Ueda et al. (1997); Orita et al. (2000), it has been pointed out that impurity hydrogen (H) is the possible cause of unintentional carrier doping in as-grown samples Galazka et al. (2020).
From infrared spectroscopic studies of -Ga2O3 containing macroscopic amounts of H, a variety of H states including O-H defects have been observed Weiser et al. (2018); Qin et al. (2019). However, their relationship to carrier doping is not always clear due to the lack of information on their local electronic structures and H valence. Furthermore, since isolated H exists only in trace amounts in solids, experimental means to study its microscopic electronic state are limited. In this regard, theoretical studies based on density functional theory (DFT) calculations have played an important role, and for H in -Ga2O3 DFT calculations have shown that interstitial H may be indeed the origin of -type doping Varley et al. (2010, 2011); Li and Robertson (2014). This prompted us to introduce muons as pseudo-H into -Ga2O3 for investigating the corresponding interstitial H states by analyzing their electronic and dynamical properties in detail by muon spin rotation (SR).
The positive muon () is an elementary particle with a mass of (where is the proton mass). The local electronic structure of muon in matter is determined by the muon-electron interaction which is practically equivalent to H, as can be seen from the fact that the difference in reduced electron mass between a muon-electron bound state (muonium) and a neutral H atom is only 0.43%. Therefore, Mu in matter can be regarded as a light isotope of H (H; we introduce the elemental symbol Mu below to denote muon as pseudo-H).
On the other hand, when interpreting the results of the SR experiment based on the results of the DFT calculations, there is an important caveat that should be pointed out at this stage. Generally, muons are implanted as an ion beam of relatively high-energy (typically 4 MeV), and the associated electronic excitations in the insulator crystals produce free carriers and excitons (103 per muon) Thompson (1974); Alig and Bloom (1975); Itoh (1997). These often propagate rapidly in the crystal, and there is experimental evidence that Mu acts as a capture center for them Prokscha et al. (2007). Consequently, the electronic state of Mu is a relaxed-excited state generated by the interaction with free carriers and excitons, which can be different from the electronic state under thermal equilibrium as expected from the thermodynamic double charge conversion level () obtained by DFT calculations.
Another well-known evidence that Mu is in a relaxed-excited state is that two or more different electronic states of Mu are often observed simultaneously in the same material Lichti et al. (2008). In order to understand the origin of this phenomenon, we have recently conducted an extensive investigation to explore the regularities between the Mu valence states observed in various oxides and the results of previous DFT calculations. As a result, assuming that these relaxed-excited states are associated with acceptor () and donor () levels that are predicted by DFT calculations as metastable states, we found that the observed Mu states can be coherently explained by the relationship between acceptor/donor levels and band structure Hiraishi et al. (2022). We call it the “ambipolarity model” since such behavior of Mu is a manifestation of the ambipolarity of H through the relaxed-excited states.
In this study, we show that Mu in single-crystalline -Ga2O3 exhibits two different electronic structures corresponding to the relaxed-excited states respectively associated with the donor and acceptor levels in the ambipolarity model. One is in the OMu-bonded state (Mu) corresponding to H serving as a donor, and another is the hydride-like state in rapid motion (Mu). In particular, the Mu2 state is a component overlooked in the previous SR experiments King et al. (2010); Celebi et al. (2012), and it is speculated to be a transient state diffusing rapidly along the axis while undergoing the charge exchange reaction, Mu. The occurrence of charge exchange is supported by the observation that the temperature dependence of the fractional yield of Mu2 exhibits a strong correlation with that of the bulk carrier electron mobility and density. This also implies that the interstitial H can take hydride state under electronic excitation and may exhibit fast diffusion motion, depending on the bulk electronic properties of the host.
II EXPERIMENTAL METHODS and DFT CALCULATIONS
The sample used in the SR experiment was a slab of single crystal (sc-Ga2O3, 10150.6 mm3) with plane synthesized by the edge-defined film-fed (EFG) method (provided by Novel Crystal Technology, Inc.) Kuramata et al. (2016). It is reported to have no twin boundary and the lowest carrier density (1017cm-3) commercially available Kuramata et al. (2016). The electrical conductivity and Hall effect measurements were performed using the PPMS (Quantum Design Co.). Ohmic contacts were formed from vacuum-deposited Ti at room temperature Víllora et al. (2008); Irmscher et al. (2011) and gold paste (Seishin Trading Co. LTD., No. 8556). The impurity H content in the sc-Ga2O3 sample was estimated to be 3.5 by thermal desorption spectrometry, which is sufficient to explain the above described . Details are described in Supplemental Material (SM) sm .
In this study, SR measurements and data analysis were also performed on a powder sample (99.99%, provided by Rare Metallics Co.) for comparison, and the results were found to be significantly different from those for single crystal. However, these results are excluded from the discussion in this paper, because it is difficult to measure the bulk electronic properties of powder samples which is necessary to consider the cause of the difference. Instead, they are presented with a brief interpretation in SM sm .
Conventional SR measurements were performed using the S1 instrument (ARTEMIS) at the Materials and Life-science Experiment Facility, J-PARC Kojima et al. (2014), where high-precision measurements over a long time range of 20–25 s can be routinely performed using a high-flux pulsed muon beam ( /cm2/s for the single-pulse mode at a proton beam power of 0.8 MW). The SR spectra [the time-dependent decay-positron asymmetry, ] which reflects the magnetic field distribution at the Mu site, was measured from room temperature to 4 K under zero field (ZF), weak longitudinal field (LF, parallel to the initial Mu polarization ), and weak transverse field (TF, perpendicular to ), and were analyzed by least-squares curve fitting Suter and Wojek (2012). The background contribution from muons which missed the sample was estimated from SR measurements on a holmium plate of the same geometry and subtracted from the asymmetry.
Since the SR spectra were found to be dominated by signals from the diamagnetic Mu (i.e., Mu+ or Mu-), the data under ZF/LF conditions were analyzed using the dynamical Kubo-Toyabe (KT) function, , where is the linewidth determined by random local fields from nuclear magnetic moments, is the magnitude of LF, and is the fluctuation rate of Hayano et al. (1979). The KT function is expressed analytically in the case of static () and ZF () conditions,
| (1) |
The magnitude of for a given Mu site is evaluated by calculating the second moments of dipolar fields from nuclear magnetic moments by the following equation,
| (2) | ||||
where [MHz/T] is the muon gyromagnetic ratio, is the position vector from the muon site to the -th nucleus, is the nuclear magnetic moment of the atom with the natural abundance of , is the polar angle of Hayano et al. (1979). Since 69Ga with and 71Ga with have nuclear spins of , respectively, they have electric quadrupole moments. In this case, is subject to electric quadrupolar interactions with the electric field gradient generated by the point charge of the diamagnetic Mu, leading to the reduction of the effective (by a factor ) and to the modification of that depends on the initial muon spin direction relative to the crystal axis. (In the powder sample, the spatial averaging leads to .) The of the candidate Mu sites inferred from DFT calculations were evaluated using the Dipelec code Kojima with Eq. (2) implemented.
DFT calculations were performed to investigate in detail the local structure of H-related defects using OpenMX Ozaki (2003) and VASP codes Kresse and Hafner (1993). Structural relaxation calculations with H (to mimic Mu) using the GGA-PBE exchange correlation function were performed on a superlattice with cutoff energies of 200 Ry for OpenMX (520 eV for VASP), and points were set to . Structures were relaxed until the the maximum force on each atom was less than (Hartree/Bohr) for OpenMX (0.01 eV/Å for VASP). Additional structural relaxation calculations using the Heyd-Scuseria-Ernzerhof (HSE06) hybrid functional implemented in VASP were performed with points of to confirm the structure of the minimum formation energy Krukau et al. (2006). The Hartree-Fock mixing parameter was set to 0.35, which reproduces the experimental value of the band gap Varley et al. (2010, 2011).
III RESULTS
First, we investigated the initial asymmetry [] of the SR spectrum under TF = 2 mT and found that it is independent of temperature () and nearly constant within experimental error over the entire measured temperature range K [see Fig. S5(a) in SM sm ]. Since the absence of a paramagnetic Mu at 300 K is confirmed from the TF data, the -independent values indicates that the muon is mostly in diamagnetic state(s) at all temperatures. (For the possibility of Mu0 with extremely small hyperfine parameters to exist, see Section IV.)

The normalized SR time spectra [] at 300 K under ZF and LF () are shown in Fig. 1(a). The ZF-SR spectrum shows that it consists of two components, one we call Mu1, which partially recovers at following slow Gaussian relaxation, and Mu2, which exhibits almost no relaxation. Note that the recovery of characteristic to the 1/3-tail of the Kubo-Toyabe function in Eq. (1) is clearly visible only for 15 s. This could not have been detectable by previous SR measurements under TF alone King et al. (2010) or those using a continuous muon beam Celebi et al. (2012), and has been first revealed by precise ZF-SR measurements using the high-flux pulsed muon beam at J-PARC. The suppression of the Gaussian relaxation by the weak LF indicates that the relaxation for the Mu1 component is induced by the quasi-static random local fields from Ga nuclear magnetic moments.
It is clear from Fig. 1(b) that the relative yield of Mu1 vs Mu2 apparently depends on at lower temperatures. Furthermore, the lineshape exhibits change from a Gaussian to exponential-like behavior at low temperatures [see for s at 30 K]. Considering these features, we analyzed the ZF and LF spectra by global curve-fits using the following function,
| (3) |
where () are the relative yields of the Mui components. The exponential damping with the relaxation rate is introduced to describe the possible influence of the fluctuating magnetic fields from unpaired electrons (including excited carriers and excitons localized nearby Mu). As shown by the solid lines in Figs. 1(a) (b), curve fit using Eq. (3) provides reasonable agreement with the data, and MHz is obtained from the fit at 300 K. The dependencies of and obtained from the fit are shown in Figs. 1(c) and (d), and those of and in Figs. 2(a) and (c), respectively.

Above K where the () is nealy independent of , , and also show similar trends; increases slightly to 0.15 MHz as decreases, while and shows a constant value close to zero (). This indicates that the Mu1 component is quasistatic for . Meanwhile, the rapid motion of Mu2 is inferred from the fact that there is no interstitial sites free of local magnetic fields from Ga nuclear magnetic moments (with 100% natural abundance); calculated at any site is always larger than 0.15 MHz for the unrelaxed lattice, which is only compatible with the situation where the relaxation due to the local field (with a linewidth MHz) is suppressed by the motional averaging, namely,
| (4) |
with for .
Below , increases with decreasing in correlation with , and tends to approach a constant value or decrease for K. A similar correlation is observed between and ; gradually increases with decreasing to exhibit a small peak around , then decreases towards , followed by an increase to reach another maximum near . Here, we point out that, as shown in Fig. 2(b), the complicated dependence of and the increase of occur in correlation with the decrease of (with being the mobility) of the sample used for SR measurements. More specifically, exhibits gradual decrease around with decreasing , followed by a sharp decrease below and an increase below (see Fig. S2 in SM sm ). As shown in Fig. 2(d), decreases with decreasing below 120 K, reaching a minimum around , and then increases to a maximum at . The behavior of for is qualitatively in line with previous reports Parisini and Fornari (2016); Kabilova et al. (2019). This implies that the electronic state of Mu is highly sensitive to the quality of samples, which is also supported by the fact that the dependence of (and ) in powder sample differs significantly from that in single crystal (see Fig. S5(b) in SM sm ).
IV DISCUSSION
In the ambipolarity model, the electronic state of the interstitial Mu is determined by where the donor and acceptor levels associated with H, predicted from the Fermi energy () dependence of defect formation energy () for Hq (), is located in the energy band structure of the host material. Figure 3(a) shows for each valence state of H obtained by previous DFT calculations Li and Robertson (2014), where H is substituted with Mu. The relationship between the donor/acceptor levels and band structure predicts that Mu can take two different diamagnetic states: a donor-like state in which it releases an electron into the conduction band to become Mu+, and a hydride (Mu-) state, which is qualitatively consistent with the present observations. Interestingly, the level, which determines the charge state of H at thermal equilibrium, is in the conduction band as is the donor level, so the behavior of H is expected to be the same as that of the donor-like Mu.

| Site | [nm] | (MHz) | (MHz) |
|---|---|---|---|
| HI | 0.0966 | 0.136 | 0.137 |
| HII | 0.1036 | 0.150 | 0.153 |
| HIII | 0.1003 | 0.161 | 0.156 |
| H- | – | 0.345 | 0.299 |
| (300 K) | 0.140(1) | 0.136(1) |
To determine the local defect structure of the Mu1 state, was compared with those calculated for the candidate sites, and the results are summarized in Table 1. The value for the HI site bonded to the three-coordinated OI [see Fig. 4(a)] is in good agreement with at 300 K, indicating that H in the dilute limit (105 cm-3). This confirms the earlier point that, aside from not knowing the exact location of , HI can serve as donor Varley et al. (2011). The existence of H in the HI structure hss been also inferred from the infrared spectroscopy of hydrogenated -Ga2O3 Qin et al. (2019). The possibility that Mu1 corresponds to H trapped in Ga and O vacancies is excluded by the comparison of with those for Mu in these vacancies (shown in Table S1 in SM sm ).
As seen in Fig. 1(c), exhibits a slight increase with decreasing , approaching the value at the HII/HIII sites [see Fig. 4(b), (c)]. This can be interpreted as reflecting the fact that the initial population of relaxed-excited states immediately after muon implantation is a random sampling of available metastable sites. Considering that the difference in the formation energy estimated by DFT calculations is small among these sites (e.g., 30 meV between HI and HII), the decrease in with increasing above suggests that the Mu site distribution approaches the lowest energy state by the annealing process. A similar dependence of exhibited by donor-like Mu has been reported for InGaZnO4 in which multiple H sites are available Kojima et al. (2019).

With Mu1 identified as being in the donor-like state, the paired Mu2 component is presumed to be in the acceptor-like diamagnetic state (Mu) from the ambipolarity model. According to DFT calculations, the corresponding H- state is bonded to the two nn Ga ions, as shown in Fig. 4(d) Li and Robertson (2014). The level is near the conduction band, and it can still accommodate two electrons as it is located below the charge neutral level (, see Fig. 3). This means that it is possible for Mu2 to exchange electrons with the conduction band. Moreover, the conduction band has a relatively large dispersion (effective mass 0.28) around the point Peelaers and Van de Walle (2015), allowing fast migration of electrons.
While Mu is unlikely to exhibit fast diffusion by itself due to the bonding to cations, there are many reported examples of fast diffusive motion of acceptor-like Mu0 in semiconductors and alkali halides Patterson (1988); Kadono et al. (1994); Gxawu et al. (2005); Chow et al. (2000). Since and show almost the same dependence for , it is inferred that the Mu2 state diffuses rapidly for through the neutral state temporally attained by the charge exchange reaction Mu. The reaction rate is given by
| (5) |
where () is the ionization probability (, with and the CBM energy) and () is the capture rate of the free carriers (, with , , and being the cross section, carrier mobility, and electric field exerted from the Mu-Ga complex state, respectively). Note that due to the charge exchange is also quenched by the motional averaging when is much greater than the hyperfine parameter. Such motional effects have also been observed in SiO2 and are thought to be responsible for the disappearance of anisotropy in the hyperfine interaction of Mu0 with increasing Chow et al. (2000). The existence of the non-relaxing Mu component has also been reported for variety of materials including NaAlH4, LaScSiHx, and FeS2 Kadono et al. (2008); Okabe et al. (2018); Hiraishi et al. (2021), implying the ubiquitous nature of acceptor-like Mu states.
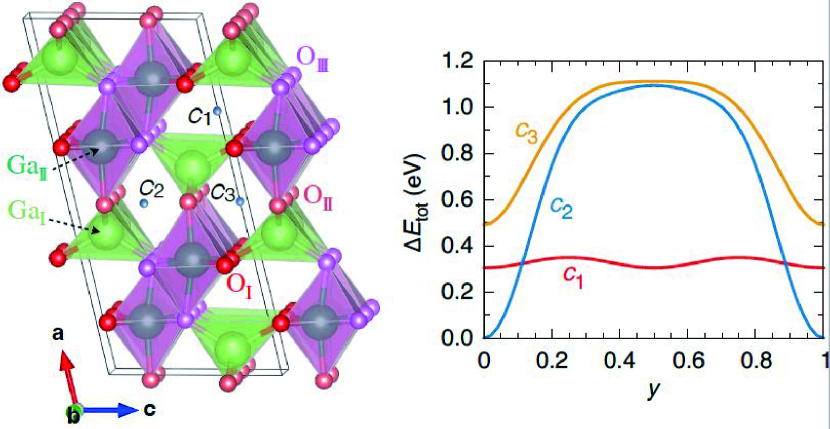
It is natural to assume that Mu2 diffuses along the direction because -Ga2O3 has an open channel structure along the direction, In fact, secondary ion mass spectrometry analysis of 2H implanted -Ga2O3 Reinertsen et al. (2020) revealed that 2H diffuses more easily in the direction than perpendicular to the surface. It has also been reported for rutile TiO2 that hydrogen diffusion is more likely to occur in open channels along the -axis than in the - plane Bates et al. (1979).
There are three different open channels in the direction in -Ga2O3. The potentials associated with diffusion in each channel were investigated by total energy calculations (see Sect. III in SM sm for details), and it was found that hydrogen tends to diffuse in the same channel as the Mu1 site. Since the two charged states Mu and Mu accompany mutually different lattice distortions, it is assumed that the potential barriers caused by these distortions allow Mu2 to diffuse while maintaining its state. However, because the adopted calculations do not take structural relaxation into account, it is a future task to evaluate using the nudged-elastic band (NEB) method.
The details of what causes the decrease in (increase in ) and recovery below , which is apparently correlated with the onset of slow dynamics for Mu1 (as inferred from the dependence of , , and ), are currently unknown. Nevertheless, when analyzing the time spectra in this range using Eq. (4) with and as free parameters, converge to mutually close values (0.13–0.14 MHz). A curve fit performed with fixed at 0.136 MHz and at 0.345 MHz (corresponding to the stationary hydride state) and the other parameters free fails to reproduce the data, as indicated by a large reduced chi-square (see Fig. S6 in SM). Thus, the decrease in suggests that a transition from Mu2 to Mu1 occurs in the relevant range. One possible scenario is that Mu can be ionized by thermal excitation and transitions to Mu for , but the ionization is prevented by increasing for [i.e., in Eq. (5)], allowing it to continue to exist as a metastable state again above .
Finally, we comment on the relationship between our experimental results and the prior SR studies on -Ga2O3. In Ref. [King et al., 2010], TF-SR measurements are reported for a powder sample from a commercial vendor, and it is observed that about 10% of the signal exhibits slight increase of relaxation rate from 0.08 MHz to 0.12 MHz below 50–100 K. Ref. [Celebi et al., 2012] reports results for a single-crystal sample (orientation unknown) and observes a 4–6% decrease in the initial asymmetry below 50–100 K in both ZF and TF-SR measurements and an increase in of the component described by from 0.10–0.11 MHz to 0.15 MHz in the ZF-SR spectra. Although detailed comparisons with our results are not possible because no time spectra are available for either case, these changes appear to correspond to the increase in at that we observed in both the powder and single-crystalline samples [see Fig. S5(b) in SM sm ]. Meanwhile, these reports are silent about the component corresponding to Mu2. We stress that the existence and origin of Mu2 are clearly identified for the first time in this study with the help of the ambipolarity model.
Acknowledgements.
This work was supported by the MEXT Elements Strategy Initiative to Form Core Research Center for Electron Materials (Grant No. JPMXP0112101001) and JSPS KAKENHI (Grant No. 19K15033). The SR experiments were conducted under user programs (Proposal No. 2019MS02) at the Materials and Life Science Experimental Facility of the J-PARC. We also acknowledge the Neutron Science and Technology Center, CROSS for the use of PPMS in their user laboratories.References
- Galazka (2018) Z. Galazka, “- for wide-bandgap electronics and optoelectronics,” Semicond. Sci. Technol. 33, 113001 (2018).
- Ueda et al. (1997) N. Ueda, H. Hosono, R. Waseda, and H. Kawazoe, “Synthesis and control of conductivity of ultraviolet transmitting - single crystals,” Appl. Phys. Lett. 70, 3561–3563 (1997).
- Orita et al. (2000) M. Orita, H. Ohta, M. Hirano, and H. Hosono, “Deep-ultraviolet transparent conductive - thin films,” Appl. Phys. Lett. 77, 4166–4168 (2000).
- Galazka et al. (2020) Z. Galazka, K. Irmscher, R. Schewski, I. M. Hanke, M. Pietsch, S. Ganschow, D. Klimm, A. Dittmar, A. Fiedler, T. Schroeder, and M. Bickermann, “Czochralski-grown bulk - single crystals doped with mono-, di-, tri-, and tetravalent ions,” J. Cryst. Growth 529, 125297 (2020).
- Weiser et al. (2018) P. Weiser, M. Stavola, W. B. Fowler, Y. Qin, and S. Pearton, “Structure and vibrational properties of the dominant O-H center in -,” Appl. Phys. Lett. 112, 232104 (2018).
- Qin et al. (2019) Y. Qin, M. Stavola, W. B. Fowler, P. Weiser, and S. J. Pearton, “Hydrogen centers in -: Infrared spectroscopy and density functional theory,” ECS J. Solid State Sci. Technol. 8, Q3103–Q3110 (2019).
- Varley et al. (2010) J. B. Varley, J. R. Weber, A. Janotti, and C. G. Van de Walle, “Oxygen vacancies and donor impurities in -,” Appl. Phys. Lett. 97, 142106 (2010).
- Varley et al. (2011) J B Varley, H Peelaers, A Janotti, and C G Van de Walle, “Hydrogenated cation vacancies in semiconducting oxides,” J. Phys. Condens.: Matter 23, 334212 (2011).
- Li and Robertson (2014) H. Li and J. Robertson, “Behaviour of hydrogen in wide band gap oxides,” J. Appl. Phys. 115, 203708 (2014).
- Thompson (1974) M. W. Thompson, Defects and Radiation Damage in Metals, Cambridge Monographs on Physics (Cambridge University Press, Cambridge, 1974).
- Alig and Bloom (1975) R. C. Alig and S. Bloom, “Electron-hole-pair creation energies in semiconductors,” Phys. Rev. Lett. 35, 1522–1525 (1975).
- Itoh (1997) N. Itoh, “Bond scission induced by electronic excitation in solids: A tool for nanomanipulation,” Nucl. Instr. Meth. Phys. Res. B 122, 405–409 (1997).
- Prokscha et al. (2007) T. Prokscha, E. Morenzoni, D. G. Eshchenko, N. Garifianov, H. Glückler, R. Khasanov, H. Luetkens, and A. Suter, “Formation of hydrogen impurity states in silicon and insulators at low implantation energies,” Phys. Rev. Lett. 98, 227401 (2007).
- Lichti et al. (2008) R. L. Lichti, K. H. Chow, and S. F. J. Cox, “Hydrogen defect-level pinning in semiconductors: The muonium equivalent,” Phys. Rev. Lett. 101, 136403 (2008).
- Hiraishi et al. (2022) M. Hiraishi, H. Okabe, A. Koda, R. Kadono, and H. Hosono, “Ambipolarity of diluted hydrogen in wide-gap oxides revealed by muon study,” J. Appl. Phys. 132, 105701 (2022).
- King et al. (2010) P. D. C. King, I. McKenzie, and T. D. Veal, “Observation of shallow-donor muonium in : Evidence for hydrogen-induced conductivity,” Appl. Phys. Lett. 96, 062110 (2010).
- Celebi et al. (2012) Y. G. Celebi, R. L. Lichti, B. B. Baker, P. W. Mengyan, and H. N. Bani-Salameh, “Motion of intransparent conducting oxides,” Phys. Proc. 30, 206–209 (2012).
- Kuramata et al. (2016) A. Kuramata, K. Koshi, S. Watanabe, Y. Yamaoka, T. Masui, and S. Yamakoshi, “High-quality - single crystals grown by edge-defined film-fed growth,” Jpn. J. Appl. Phys. 55, 1202A2 (2016).
- Víllora et al. (2008) E. G. Víllora, K. Shimamura, T. Ujiie, and K. Aoki, “Electrical conductivity and lattice expansion of - below room temperature,” Appl. Phys. Lett. 92, 202118 (2008).
- Irmscher et al. (2011) K. Irmscher, Z. Galazka, M. Pietsch, R. Uecker, and R. Fornari, “Electrical properties of - single crystals grown by the Czochralski method,” J. Appl. Phys. 110, 063720 (2011).
- (21) See Supplemental Material at [URL will be inserted by publisher] for details on sample characterization by TDS and Hall coefficient measurements, DFT calculations for muon sites, SR results for a powder sample, and on the comparison of curve fits for the SR spectra around .
- Momma and Izumi (2011) K. Momma and F. Izumi, “VESTA3 for three-dimensional visualization of crystal, volumetric and morphology data,” J. Appl. Crystallogr. 44, 1272–1276 (2011).
- Kresse and Hafner (1993) G. Kresse and J. Hafner, “Ab initio molecular dynamics for liquid metals,” Phys. Rev. B 47, 558–561 (1993).
- Krukau et al. (2006) A. V. Krukau, O. A. Vydrov, A. F. Izmaylov, and G. E. Scuseria, “Influence of the exchange screening parameter on the performance of screened hybrid functionals,” J. Chem. Phys 125, 224106 (2006).
- Ozaki (2003) T. Ozaki, “Variationally optimized atomic orbitals for large-scale electronic structures,” Phys. Rev. B 67, 155108 (2003).
- Kojima et al. (2014) K. M. Kojima, T. Murakami, Y. Takahashi, H. Lee, S. Y. Suzuki, A. Koda, I. Yamauchi, M. Miyazaki, M. Hiraishi, H. Okabe, S. Takeshita, R. Kadono, T. Ito, W. Higemoto, S. Kanda, Y. Fukao, N. Saito, M. Saito, M. Ikeno, T. Uchida, and M. M. Tanaka, “New spectrometer at J-PARC MUSE based on Kalliope detectors,” J. Phys.: Conf. Ser. 551, 012063 (2014).
- Suter and Wojek (2012) A. Suter and B.M. Wojek, “Musrfit: A free platform-independent framework for sr data analysis,” Phys. Proc. 30, 69–73 (2012).
- Hayano et al. (1979) R. S. Hayano, Y. J. Uemura, J. Imazato, N. Nishida, T. Yamazaki, and R. Kubo, “Zero-and low-field spin relaxation studied by positive muons,” Phys. Rev. B 20, 850–859 (1979).
- (29) K. M. Kojima, private communication.
- Parisini and Fornari (2016) A. Parisini and R. Fornari, “Analysis of the scattering mechanisms controlling electron mobility in - crystals,” Semicond. Sci. Technol. 31, 035023 (2016).
- Kabilova et al. (2019) Z. Kabilova, C. Kurdak, and R. L. Peterson, “Observation of impurity band conduction and variable range hopping in heavily doped (010) -,” Semicond. Sci. Technol. 34, 03LT02 (2019).
- Kojima et al. (2019) K. M. Kojima, M. Hiraishi, H. Okabe, A. Koda, R. Kadono, K. Ide, S. Matsuishi, H. Kumomi, T. Kamiya, and H. Hosono, “Electronic structure of interstitial hydrogen in In-Ga-Zn-O semiconductor simulated by muon,” Appl. Phys. Lett. 115, 122104 (2019).
- Peelaers and Van de Walle (2015) H. Peelaers and C. G. Van de Walle, “Brillouin zone and band structure of -,” Phys. Status Solidi (b) 252, 828–832 (2015).
- Patterson (1988) B. D. Patterson, “Muonium states in semiconductors,” Rev. Mod. Phys. 60, 69–159 (1988).
- Kadono et al. (1994) R. Kadono, A. Matsushita, K. Nagamine, K. Nishiyama, K. H. Chow, R. F. Kiefl, A. MacFarlane, D. Schumann, S. Fujii, and S. Tanigawa, “Charge state and diffusivity of muonium in n-type gaas,” Phys. Rev. B 50, 1999–2002 (1994).
- Gxawu et al. (2005) D. Gxawu, I. Z. Machi, S. H. Connell, K. Bharuth-Ram, M. J. Sithole, and S. F. J. Cox, “Diffusion of interstitial muonium, , in a diamond,” Diamond Relat. Mater. 14, 375–379 (2005).
- Chow et al. (2000) K. H. Chow, R. F. Kiefl, B. Hitti, T. L. Estle, and R. L. Lichti, “Novel behavior of bond-centered muonium in heavily doped -type silicon: Curie-like spin susceptibility and charge screening,” Phys. Rev. Lett. 84, 2251–2254 (2000).
- Kadono et al. (2008) R. Kadono, K. Shimomura, K. H. Satoh, S. Takeshita, A. Koda, K. Nishiyama, E. Akiba, R. M. Ayabe, M. Kuba, and C. M. Jensen, “Hydrogen bonding in sodium alanate: A muon spin rotation study,” Phys. Rev. Lett. 100, 026401 (2008).
- Okabe et al. (2018) H. Okabe, M. Hiraishi, S. Takeshita, A. Koda, K. M. Kojima, and R. Kadono, “Local electronic structure of interstitial hydrogen in iron disulfide,” Phys. Rev. B 98, 075210 (2018).
- Hiraishi et al. (2021) M. Hiraishi, K. M. Kojima, H. Okabe, A. Koda, R. Kadono, J. Wu, Y. Lu, and H. Hosono, “Anomalous diamagnetism of electride electrons in transition metal silicides,” Phys. Rev. B 103, L241101 (2021).
- Reinertsen et al. (2020) V. M. Reinertsen, P. M. Weiser, Y. K. Frodason, M. E. Bathen, L. Vines, and K. M. Johansen, “Anisotropic and trap-limited diffusion of hydrogen/deuterium in monoclinic gallium oxide single crystals,” Appl. Phys. Lett. 117, 232106 (2020).
- Bates et al. (1979) J. B. Bates, J. C. Wang, and R. A. Perkins, “Mechanisms for hydrogen diffusion in ,” Phys. Rev. B 19, 4130–4139 (1979).
Supplemental Material: Local electronic structure of dilute hydrogen in -Ga2O3 probed by muons
M. Hiraishi et al.
I Properties of Single Crystalline -
I.1 Thermal Desorption Spectrometry (TDS)
Figure S1 shows the TDS results for the sample, which was linearly heated from room temperature to 800∘C and held at 800∘C for 1 hour. Temperature is shown on the right axis and the signal intensities obtained by the quadrupole mass spectrometer (QMS) are shown on the left vertical axis. The analysis revealed that the sample contains 3.5 of hydrogen (, with being the mass number, the ion valence). Considering that the desorption process is diffusion-limited for crystalline specimens, this value may correspond to the lower limit. The signal intensity for (1HO, 18O) is greater than that for (16O) multiplied by 0.002 (natural abundance of 18O), indicating that is derived from water (H2O). The similar temperature dependence of and 17 to that of 18 strongly suggests that are also water-related signals. The steep increase below 100∘C (20 min.) is probably due to residual moisture on the sample surface, chamber, and so on.

I.2 Carrier concentration
The temperature dependence of carrier concentration obtained from Hall coefficient measurements for the -Ga2O3 sample (with orientation) used for SR measurements is shown in Fig. S2. The sign of the Hall coefficient indicates that majority carriers are electrons.

II Result of DFT calculations
The relaxed structures obtained by DFT calculations are shown in Fig. S3, and the simulated muon spin relaxation rates in the Kubo-Toyabe function for each structure are shown in Table S1.

| Type | Config. | nn oxygen | |||
|---|---|---|---|---|---|
| (nm) | (MHz) | (MHz) | |||
| Interstitial★ | HI | OI | 0.0966 | 0.136 | 0.137 |
| Interstitial★ | HII | OII | 0.1036 | 0.150 | 0.153 |
| Interstitial★ | HIII | OII | 0.1003 | 0.161 | 0.158 |
| Interstitial | HIV | OIII | 0.1024 | 0.157 | 0.165 |
| Interstitial | HV | OIII | 0.0996 | 0.158 | 0.170 |
| Interstitial | HVI | OI | 0.0989 | 0.175 | 0.162 |
| Vacancy | V-H | OI | 0.0983 | 0.106 | 0.117 |
| Vacancy | V-H | OI | 0.0988 | 0.108 | 0.115 |
| Vacancy | V-H | — | — | 0.286 | 0.250 |
| Vacancy | V-H | — | — | 0.168 | 0.235 |
| Vacancy | V-H | — | — | 0.229 | 0.238 |
III Axial diffusion: Evaluation based on total energy.
To investigate the Mu2 diffusion path, axis position dependence of the total energy was calculated in a superlattice. Figure S4 shows the variation of the total energy,
where is the position vector of channel and is the global minimum of . Here, for , and , respectively. The of and show large changes of more than 0.5 eV, whereas the of is almost independent of and the difference is only 0.04 eV, suggesting that is a the possible diffusion path for Mu2.
IV Supplemental SR Results
IV.1 SR results on powder Sample
SR measurements and data analysis for the powder sample were performed as for the single crystal. The temperature dependence of each parameter obtained by curve fitting of the SR time spectra is shown in Fig. S5. For comparison, the results for the single-crystal sample presented in the main text are also shown.

As can be seen in Fig. S5(a), the most significant difference is that the yield of the Mu1 component in the powder sample is greatly increased in place of the Mu2 component. In addition, it is observed for the powder sanple that (the fluctuation rate of ) is almost zero (static) for K, whereas it takes on finite values for , suggesting slow diffusive motion of the Mu1 component. These behaviors are in remarkable contrast to the single-crystal sample. On the other hand, the increase in (decrease in ) from ( K) to is common. From these observations, it may be interpreted that for , the component corresponding to Mu2 in the powder sample is bounded by some defects, etc., and that a part of it is detrapped and begins to exhibit fast diffusion for , which is gradually suppressed above .
IV.2 Comparison of curve fits for the data around
To test the possibility that quasi-static Mu1 and Mu2 coexist in the SR spectrum near the temperature at which decreases significantly, we performed global curve fits for the ZF and LF-SR spectra with the linewidth and as free parameters in each state, as well as for those fixed to the values expected for the corresponding sites ( MHz and MHz). The results of the respective analyses for the spectra at 57 K are shown below in Fig. S6(a) and (b). The fits with fixed to the expected values at the two sites show large residual chi-squares, clearly indicating that the data are not well reproduced.
