Linear optimal partial transport embedding
Abstract
Optimal transport (OT) has gained popularity due to its various applications in fields such as machine learning, statistics, and signal processing. However, the balanced mass requirement limits its performance in practical problems. To address these limitations, variants of the OT problem, including unbalanced OT, Optimal partial transport (OPT), and Hellinger Kantorovich (HK), have been proposed. In this paper, we propose the Linear optimal partial transport (LOPT) embedding, which extends the (local) linearization technique on OT and HK to the OPT problem. The proposed embedding allows for faster computation of OPT distance between pairs of positive measures. Besides our theoretical contributions, we demonstrate the LOPT embedding technique in point-cloud interpolation and PCA analysis. Our code is available at https://github.com/Baio0/LinearOPT.
1 Introduction
The Optimal Transport (OT) problem has found numerous applications in machine learning (ML), computer vision, and graphics. The probability metrics and dissimilarity measures emerging from the OT theory, e.g., Wasserstein distances and their variations, are used in diverse applications, including training generative models [3, 24, 33], domain adaptation [16, 15], bayesian inference [28], regression [26], clustering [42], learning from graphs [29] and point sets [35, 36], to name a few. These metrics define a powerful geometry for comparing probability measures with numerous desirable properties, for instance, parameterized geodesics [2], barycenters [18], and a weak Riemannian structure [40].
In large-scale machine learning applications, optimal transport approaches face two main challenges. First, the OT problem is computationally expensive. This has motivated many approximations that lead to significant speedups [17, 13, 39]. Second, while OT is designed for comparing probability measures, many ML problems require comparing non-negative measures with varying total amounts of mass. This has led to the recent advances in unbalanced optimal transport [14, 12, 32] and optimal partial transport [8, 20, 21]. Such unbalanced/partial optimal transport formulations have been recently used to improve minibatch optimal transport [37] and for point-cloud registration [4].
Comparing (probability) measures requires the pairwise calculation of transport-based distances, which, despite the significant recent computational speed-ups, remains to be relatively expensive. To address this problem, [41] proposed the Linear Optimal Transport (LOT) framework, which linearizes the 2-Wasserstein distance utilizing its weak Riemannian structure. In short, the probability measures are embedded into the tangent space at a fixed reference measure (e.g., the measures’ Wasserstein barycenter) through a logarithmic map. The Euclidean distances between the embedded measures then approximate the 2-Wasserstein distance between the probability measures. The LOT framework is computationally attractive as it only requires the computation of one optimal transport problem per input measure, reducing the otherwise quadratic cost to linear. Moreover, the framework provides theoretical guarantees on convexifying certain sets of probability measures [34, 1], which is critical in supervised and unsupervised learning from sets of probability measures. The LOT embedding has recently found diverse applications, from comparing collider events in physics [9] and comparing medical images [5, 30] to permutation invariant pooling for comparing graphs [29] and point sets [35].
Many applications in ML involve comparing non-negative measures (often empirical measures) with varying total amounts of mass, e.g., domain adaptation [19]. Moreover, OT distances (or dissimilarity measures) are often not robust against outliers and noise, resulting in potentially high transportation costs for outliers. Many recent publications have focused on variants of the OT problem that allow for comparing non-negative measures with unequal mass. For instance, the optimal partial transport (OPT) problem [8, 20, 21], Kantorovich–Rubinstein norm [25, 31], and the Hellinger–Kantorovich distance [11, 32]. These methods fall under the broad category of “unbalanced optimal transport” [12, 32]. The existing solvers for “unbalanced optimal transport” problems are generally as expensive or more expensive than the OT solvers. Hence, computation time remains a main bottleneck of these approaches.
To reduce the computational burden for comparing unbalanced measures, [10] proposed a clever extension for the LOT framework to unbalanced nonnegative measures by linearizing the Hellinger-Kantorovich, denoted as Linearized Hellinger-Kantorovich (LHK), distance, with many desirable theoretical properties. However, an unintuitive caveat about HK and LHK formulation is that the geodesic for the transported portion of the mass does not resemble the OT geodesic. In particular, the transported mass does not maintain a constant mass as it is transported (please see Figure 1). In contrast, OPT behaves exactly like OT for the transported mass with the trade-off of losing the Riemannian structure of HK.
Contributions: In this paper, inspired by OT geodesics, we provide an OPT interpolation technique using its dynamic formulation and explain how to compute it for empirical distributions using barycentric projections. We use this interpolation to embed the space of measures in a euclidean space using optimal partial transport concerning a reference measure. This allows us to extend the LOT framework to LOPT, a linearized version of OPT. Thus, we reduce the computational burden of OPT while maintaining the decoupling properties between noise (created and destroyed mass) and signal (transported mass) of OPT. We propose a LOPT discrepancy measure and a LOPT interpolating curve and contrast them with their OPT counterparts. Finally, we demonstrate applications of the new framework in point cloud interpolation and PCA analysis, showing that the new technique is more robust to noise.
Organization: In section 2, we review Optimal Transport Theory and the Linear Optimal Transport framework to set the basis and intuitions on which we build our new techniques. In Section 3 we review Optimal Partial Transport Theory and present an explicit solution to its Dynamic formulation that we use to introduce the Linear Optimal Partial Transport framework (LOPT). We define LOPT Embedding, LOPT Discrepancy, LOPT interpolation and give explicit ways to work with empirical data. In Section 4 we show applications of the LOPT framework to approximate OPT distances, to interpolate between point cloud datasets, and to preprocess data for PCA analysis. In the appendix, we provide proofs for all the results, new or old, for which we could not find a proof in the literature.

2 Background: OT and LOT
2.1 Static Formulation of Optimal Transport
Let be the set of Borel probability measures defined in a convex compact subset of , and consider . The Optimal Transport (OT) problem between and is that of finding the cheapest way to transport all the mass distributed according to the reference measure onto a new distribution of mass determined by the target measure . Mathematically, it was stated by Kantorovich as the minimization problem
| (1) | |||
| (2) |
where is the set of all joint probability measures in with marginals and . A measure is called a transportation plan, and given measurable sets , the coupling describes how much mass originally in the set is transported into the set . The squared of the Euclidean distance111More general cost functions might be used, but they are beyond the scope of this article. is interpreted as the cost of transporting a unit mass located at to . Therefore, represents the total cost of moving to according to . Finally, we will denote the set of all plans that achieve the infimum in (1), which is non-empty [40], as .
Under certain conditions (e.g. when has continuous density), an optimal plan can be induced by a rule/map that takes all the mass at each position to a unique point . If that is the case, we say that does not split mass and that it is induced by a map T. In fact, it is concentrated on the graph of in the sense that for all measurable sets , , and we will write it as the pushforward . Hence, (1) reads as
| (3) |
The function is called a Monge map, and when is absolutely continuous it is unique [7].
Finally, the square root of the optimal value is exactly the so-called Wasserstein distance, , in [40, Th.7.3], and we will call it also as OT squared distance. In addition, with this distance, is not only a metric space but also a Riemannian manifold [40]. In particular, the tangent space of any is , where
| (4) |
2.2 Dynamic Formulation of Optimal Transport
To understand the framework of Linear Optimal Transport (LOT) we will use the dynamic formulation of the OT problem. Optimal plans and maps can be viewed as a static way of matching two distributions. They tell us where each mass in the initial distribution should end, but they do not tell the full story of how the system evolves from initial to final configurations.
In the dynamic formulation, we consider a curve of measures parametrized in time that describes the distribution of mass at each instant . We will require the curve to be sufficiently smooth, to have boundary conditions , , and to satisfy the conservation of mass law. Then, it is well known that there exists a velocity vector field such that satisfies the continuity equation222The continuity equation is satisfied weakly or in the sense of distributions. See [40, 38]. with boundary conditions
| (5) |
The length333Precisely, the length of the curve , with respect to the Wasserstein distance, should be , but this will make no difference in the solutions of (6) since they are constant speed geodesics. of the curve can be stated as , for as in (4), and coincides with the length of the shortest curve between and [6]. Hence, the dynamical formulation of the OT problem (1) reads as
| (6) |
where is the set of pairs , where , and , satisfying (5).
Under the assumption of existence of an optimal Monge map , an optimal solution for (6) can be given explicitly and is pretty intuitive. If a particle starts at position and finishes at position , then for it will be at the point
| (7) |
Then, varying both the time and , the mapping (7) can be interpreted as a flow whose time velocity444For each , the vector is well defined as is invertible. See [38, Lemma 5.29]. is
| (8) |
To obtain the curve of probability measures , one can evolve through the flow using the formula for any measurable set . That is, is the push-forward of by
| (9) |
The pair defined by (9) and (8) satisfies the continuity equation (5) and solves (6). Moreover, the curve is a constant speed geodesic in between and [22], i.e., it satisfies that for all
| (10) |
A confirmation of this comes from comparing the OT cost (3) with (8) obtaining
| (11) |
which tells us that we only need the speed at the initial time to compute the total length of the curve. Moreover, coincides with the squared norm of the tangent vector in the tangent space of at .
2.3 Linear Optimal Transport Embedding
Inspired by the induced Riemannian geometry of the squared distance, [41] proposed the so-called Linear Optimal Transportation (LOT) framework. Given two target measures , the main idea relies on considering a reference measure and embed these target measures into the tangent space . This is done by identifying each measure with the curve (9) minimizing and computing its velocity (tangent vector) at using (8).
Formally, let us fix a continuous probability reference measure . Then, the LOT embedding [34] is defined as
| (12) |
where is the optimal Monge map between and . Notice that by (3), (4) and (11) we have
| (13) |
After this embedding, one can use the distance in between the projected measures to define a new distance in that can be used to approximate . The LOT squared distance is defined as
| (14) |
2.4 LOT in the Discrete Setting
For discrete probability measures of the form
| (15) |
a Monge map for may not exist. Following [41], in this setting, the target measure can be replaced by a new measure for which an optimal transport Monge map exists. For that, given an optimal plan , it can be viewed as a matrix whose value at position represents how much mass from should be taken to . Then, we define the OT barycentric projection555We refer to [2] for the rigorous definition. of with respect to as
| (16) |
The new measure is regarded as an -point representation of the target measure . The following lemma guarantees the existence of a Monge map between and .
Lemma 2.1.
It is easy to show that if the optimal transport plan is induced by a Monge map, then . As a consequence, the OT barycentric projection is an actual projection in the sense that it is idempotent.
Similar to the continuous case (12), given a discrete reference measure , we can define the LOT embedding for a discrete measure as the rule
| (17) |
The range of this application is identified with with the norm , where denotes the th entry of . We call the embedding space.
By the discussion above, if the optimal plan for problem is induced by a Monge map, then the discrete embedding is consistent with (13) in the sense that
| (18) |
Hence, as in section 2.3, we can use the distance between embedded measures in ( to define a discrepancy in the space of discrete probabilities that can be used to approximate . The LOT discrepancy777In [41], LOT is defined by the infimum over all possible optimal pairs . We do not distinguish these two formulations for convenience in this paper. Additionally, (19) is determined by the choice of . is defined as
| (19) |
We call it a discrepancy because it is not a squared metric between discrete measures. It does not necessarily satisfy that for every distinct . Nevertheless, is a metric in the embedding space.
2.5 OT and LOT Geodesics in Discrete Settings
Let , be discrete probability measures as in (15) (with ‘’ in place of ). If an optimal Monge map for exists, a constant speed geodesic between and , for the OT squared distance, can be found by mimicking (9). Explicitly, with as in (7),
| (20) |
In practice, one replaces by its OT barycentric projection with respect to (and so, the existence of an optimal Monge map is guaranteed by Lemma 2.1).
Now, given a discrete reference , the LOT discrepancy provides a new structure to the space of discrete probability densities. Therefore, we can provide a substitute for the OT geodesic (20) between and . Assume we have the embeddings , as in (17). The geodesic between and in the LOT embedding space has the simple form . This correlates with the curve in induced by the map 888This map can be understood as the one that transports onto pivoting on the reference: . as
| (21) |
By abuse of notation, we call this curve the LOT geodesic between and . Nevertheless, it is a geodesic between their barycentric projections since it satisfies the following.
Proposition 2.2.
Let be defined as (21), and , then for all
| (22) |
3 Linear Optimal Partial Transport Embedding
3.1 Static Formulation of Optimal Partial Transport
In addition to mass transportation, the OPT problem allows mass destruction at the source and mass creation at the target. Let denote the set of all positive finite Borel measures defined on . For the OPT problem between can be formulated as
| (23) | |||
| (24) |
where is the total mass of (resp. ), and denotes the set of all measures in with marginals and satisfying (i.e., for all measurable set ), and . Here, the mass destruction and creation penalty is linear, parametrized by . The set of minimizers of (23) is non-empty [20]. One can further restrict to the set of partial transport plans such that for all [4, Lemma 3.2]. This means that if the usual transportation cost is greater than , it is better to create/destroy mass.
3.2 Dynamic Formulation of Optimal Partial Transport
Adding a forcing term to the continuity equation (6), one can take into account curves that allow creation and destruction of mass. That is, those who break the conservation of mass law. Thus, it is natural that the minimization problem (23) can be rewritten [12, Th. 5.2] into a dynamic formulation as
| (25) |
where is the set of tuples such that , (where stands for signed measures) and , satisfying
| (26) |
As in the case of OT, under certain conditions on the minimizers of (23), one curve that minimizes the dynamic formulation (25) is quite intuitive. We show in the next proposition that it consists of three parts , and (see (27), (28), and (29) below). The first is a curve that only transports mass, and the second and third destroy and create mass at constant rates , , respectively.
Proposition 3.1.
In analogy to the OT squared distance, we also call the optimal partial cost (32) as the OPT squared distance.
3.3 Linear Optimal Partial Transport Embedding
Definition 3.2.
Let , such that is solved by a plan induced by a map. The LOPT embedding of with respect to is defined as
| (33) |
where are defined as in Proposition 3.1.
Let us compare the LOPT (33) and LOT (12) embeddings. The first component represents the tangent of the curve that transports mass from the reference to the target. This is exactly the same as the LOT embedding. In contrast to LOT, the second component is necessary since we need to specify what part of the reference is being transported. The third component can be thought of as the tangent vector of the part that creates mass. There is no need to save the destroyed mass because it can be inferred from the other quantities.
Now, let be the minimum measure999Formally, for every Borel set , where the infimum is taken over all partitions of ., i.e. , , given by Borel sets , . between and . By the above definition, . Therefore, (32) can be rewritten
| (34) |
This motivates the definition of the LOPT discrepancy.101010 is not a rigorous metric.
Definition 3.3.
Consider a reference and target measures such that and can be solved by plans induced by mappings as in the hypothesis of Proposition 3.1. Let and be the LOPT embeddings of and with respect to . The LOPT discrepancy between and with respect to is defined as
| (35) |
Similar to the LOT framework, by equation (34), LOPT can recover OPT when . That is,
3.4 LOPT in the Discrete Setting
If are size discrete non-negative measures as in (15) (but not necessarily with total mass 1), the OPT problem (23) can be written as
where the set can be viewed as the subset of matrices with non-negative entries
where denotes the vector whose entries are (resp. ), is the vector of weights of (resp. ), means that component-wise holds the ‘’ (resp. , where is the transpose of ), and is the total mass of (resp. ). The marginals are , and .
Similar to OT, when an optimal plan for is not induced by a map, we can replace the target measure by an OPT barycentric projection for which a map exists. Therefore, allowing us to apply the LOPT embedding (see (33) and (40) below).
Definition 3.4.
Let and be positive discrete measures, and . The OPT barycentric projection111111Notice that in (16) we had . This leads to introducing as in (37). That is, plays the role of in the OPT framework. However, here depends on (on its first marginal ) and not only on , and so we add a superscript ‘’. of with respect to is defined as
| (36) | |||
| (37) | |||
| (38) |
Theorem 3.5.
It is worth noting that when we take a barycentric projection of a measure, some information is lost. Specifically, the information about the part of that is not transported from the reference . This has some minor consequences.
First, unlike (18), the optimal partial transport cost changes when we replace by . Nevertheless, the following relation holds.
Theorem 3.6.
In the same setting of Definition 3.4, if is induced by a map, then
| (39) |
The second consequence121212This is indeed an advantage since it allows the range of the embedding to always have the same dimension . is that the LOPT embedding of will always have a null third component. That is,
| (40) |
Therefore, we represent this embedding as , for and . The last consequence is given in the next result.
Proposition 3.7.
3.5 OPT and LOPT Interpolation
Inspired by OT and LOT geodesics as defined in section 2.5, but lacking the Riemannian structure provided by the OT squared norm, we propose an OPT interpolation curve and its LOPT approximation.
For the OPT interpolation between two measures , for which exists of the form , a natural candidate is the solution of the dynamic formulation of . The exact expression is given by Proposition 3.1. When working with general discrete measures , (as in (15), with ‘’ in place of ) such is not guaranteed to exist. Then, we replace the latter with its OPT barycentric projection with respect to . And by Theorem 3.5 the map solves and the OPT interpolating curve is131313 are the coefficients of with respect to analogous to (36).
When working with a multitude of measures, it is convenient to consider a reference and embed the measures in using LOPT. Hence, doing computations in a simpler space. Below we provide the LOPT interpolation.
Definition 3.8.
Given discrete measures , with as the reference, let be the LOPT embeddings of . Let , and . We define the LOPT interpolating curve between and by
where , and are respectively the sets where we transport, destroy and create mass.
4 Applications
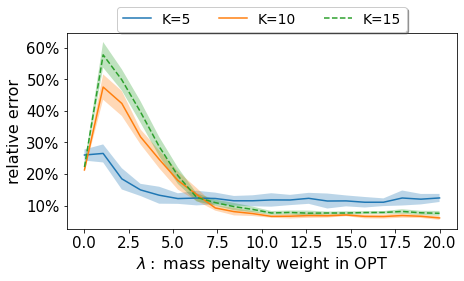
Approximation of OPT Distance: Similar to LOT [41], and Linear Hellinger Kantorovich (LHK) [10], we test the approximation performance of OPT using LOPT. Given empirical measures , for each pair , we compute and and the mean or median of all pairs of relative error defined as
Similar to LOT and LHK, the choice of is critical for the accurate approximation of OPT. If is far away from , the linearization is a poor approximation because the mass in and would only be destroyed or created. In practice, one candidate for is the barycenter of the set of measures . The OPT can be converted into OT problem [8], and one can use OT barycenter [18] to find .
For our experiments, we created point sets of size for different Gaussian distributions in . In particular, , where is randomly selected such that for . For the reference, we picked an point representation of with . We repeated each experiment times. To exhibit the effect of the parameter in the approximation, the relative errors are shown in Figure 2. For the histogram of the relative errors for each value of and each number of measures , we refer to Figure 6 in the Appendix H. For large , most mass is transported and , the performance of LOPT is close to that of LOT, and the relative error is small.

In Figure 3 we report wall clock times of OPT vs LOPT for . We use linear programming [27] to solve each OPT problem with a cost of each. Thus, computing the OPT distance pair-wisely for requires . In contrast, to compute , we only need to solve optimal partial transport problems for the embeddings (see (33) or (40)). Computing LOPT discrepancies after the embeddings is linear. Thus, the total computational cost is . The experiment was conducted on a Linux computer with AMD EPYC 7702P CPU with 64 cores and 256GB DDR4 RAM.

Point Cloud Interpolation: We test OT geodesic, LOT geodesic, OPT interpolation, and LOPT interpolation on the point cloud MNIST dataset. We compute different transport curves between point sets of the digits and . Each digit is a weighted point set , , that we consider as a discrete measure of the form , where the first sum corresponds to the clean data normalized to have total mass 1, and the second sum is constructed with samples from a uniform distribution acting as noise with total mass . For HK, OPT, LHK and LOPT, we use the distributions without re-normalization, while for OT and LOT, we re-normalize them. The reference in LOT, LHK and LOPT is taken as the OT barycenter of a sample of the digits 0, 1, and 9 not including the ones used for interpolation, and normalized to have unit total mass. We test for (see Figure 8 in the Appendix H). The results for are shown in Figure 4. We can see that OT and LOT do not eliminate noise points. HK, OPT still retains much of the noise because interpolation is essentially between and (with respect to ). So acts as a reference that still has a lot of noise. In LHK, LOPT, by selecting the same reference as LOT we see that the noise significantly decreases. In the HK and LHK cases, we notice not only how the masses vary, but also how their relative positions change obtaining a very different configuration at the end of the interpolation. OPT and LOPT instead returns a more natural interpolation because of the mass preservation of the transported portion and the decoupling between transport and destruction/creation of mass.

PCA analysis: We compare the results of performing PCA on the embedding space of LOT, LHK and LOPT for point cloud MNIST. We take 900 digits from the dataset corresponding to digits and in equal proportions. Each element is a point set that we consider as a discrete measure with added noise. The reference, , is set to the OT barycenter of 30 samples from the clean data. For LOT we re-normalize each to have a total mass of 1, while we do not re-normalize for LOPT. Let . We embed using LOT, LHK and LOPT and apply PCA on the embedded vectors . In Figure 5 we show the first two principal components of the set of embedded vectors based on LOT, LHK and LOPT for noise levels . It can be seen that when there is no noise, the PCA dimension reduction technique works well for all three embedding methods. When , the method fails for LOT embedding, but the dimension-reduced data is still separable for LOPT and LHK. For the running time, LOT, LOPT requires 60-80 seconds and LHK requires about 300-350 seconds. The experiments are conducted on a Linux computer with AMD EPYC 7702P CPU with 64 cores and 256GB DDR4 RAM.

We refer the reader to Appendix H for further details and analysis.
5 Summary
We proposed a Linear Optimal Partial Transport (LOPT) technique that allows us to embed distributions with different masses into a fixed dimensional space in which several calculations are significantly simplified. We show how to implement this for real data distributions allowing us to reduce the computational cost in applications that would benefit from the use of optimal (partial) transport. We finally provide comparisons with previous techniques and show some concrete applications. In particular, we show that LOPT is more robust and computationally efficient in the presence of noise than previous methods. For future work, we will continue to investigate the comparison of LHK and LOPT, and the potential applications of LOPT in other machine learning and data science tasks, such as Barycenter problems, graph embedding, task similarity measurement in transfer learning, and so on.
Acknowledgements
This work was partially supported by the Defense Advanced Research Projects Agency (DARPA) under Contracts No. HR00112190132 and No. HR00112190135. Any opinions, findings, conclusions, or recommendations expressed in this material are those of the authors and do not necessarily reflect the views of the United States Air Force, DARPA, or other funding agencies.
References
- [1] Akram Aldroubi, Shiying Li, and Gustavo K Rohde. Partitioning signal classes using transport transforms for data analysis and machine learning. Sampling Theory, Signal Processing, and Data Analysis, 19(1):1–25, 2021.
- [2] Luigi Ambrosio, Nicola Gigli, and Giuseppe Savaré. Gradient flows: in metric spaces and in the space of probability measures. Springer Science & Business Media, 2005.
- [3] Martin Arjovsky, Soumith Chintala, and Léon Bottou. Wasserstein generative adversarial networks. In International conference on machine learning, pages 214–223. PMLR, 2017.
- [4] Yikun Bai, Bernard Schmitzer, Mathew Thorpe, and Soheil Kolouri. Sliced optimal partial transport. arXiv preprint arXiv:2212.08049, 2022.
- [5] Saurav Basu, Soheil Kolouri, and Gustavo K Rohde. Detecting and visualizing cell phenotype differences from microscopy images using transport-based morphometry. Proceedings of the National Academy of Sciences, 111(9):3448–3453, 2014.
- [6] Jean-David Benamou and Yann Brenier. A computational fluid mechanics solution to the monge-kantorovich mass transfer problem. Numerische Mathematik, 84(3):375–393, 2000.
- [7] Yann Brenier. Polar factorization and monotone rearrangement of vector-valued functions. Communications on pure and applied mathematics, 44(4):375–417, 1991.
- [8] Luis A Caffarelli and Robert J McCann. Free boundaries in optimal transport and monge-ampere obstacle problems. Annals of mathematics, pages 673–730, 2010.
- [9] Tianji Cai, Junyi Cheng, Nathaniel Craig, and Katy Craig. Linearized optimal transport for collider events. Physical Review D, 102(11):116019, 2020.
- [10] Tianji Cai, Junyi Cheng, Bernhard Schmitzer, and Matthew Thorpe. The linearized hellinger–kantorovich distance. SIAM Journal on Imaging Sciences, 15(1):45–83, 2022.
- [11] Lenaic Chizat, Gabriel Peyré, Bernhard Schmitzer, and François-Xavier Vialard. An interpolating distance between optimal transport and fisher–rao metrics. Foundations of Computational Mathematics, 18(1):1–44, 2018.
- [12] Lenaic Chizat, Gabriel Peyré, Bernhard Schmitzer, and François-Xavier Vialard. Unbalanced optimal transport: Dynamic and kantorovich formulations. Journal of Functional Analysis, 274(11):3090–3123, 2018.
- [13] Lenaic Chizat, Pierre Roussillon, Flavien Léger, François-Xavier Vialard, and Gabriel Peyré. Faster wasserstein distance estimation with the sinkhorn divergence. Advances in Neural Information Processing Systems, 33:2257–2269, 2020.
- [14] Lenaic Chizat, Bernhard Schmitzer, Gabriel Peyre, and Francois-Xavier Vialard. An interpolating distance between optimal transport and fisher-rao. arXiv:1506.06430 [math], 2015.
- [15] Nicolas Courty, Rémi Flamary, Amaury Habrard, and Alain Rakotomamonjy. Joint distribution optimal transportation for domain adaptation. Advances in Neural Information Processing Systems, 30, 2017.
- [16] Nicolas Courty, Rémi Flamary, and Devis Tuia. Domain adaptation with regularized optimal transport. In Joint European Conference on Machine Learning and Knowledge Discovery in Databases, pages 274–289. Springer, 2014.
- [17] Marco Cuturi. Sinkhorn distances: Lightspeed computation of optimal transport. Advances in neural information processing systems, 26, 2013.
- [18] Marco Cuturi and Arnaud Doucet. Fast computation of wasserstein barycenters. In International conference on machine learning, pages 685–693. PMLR, 2014.
- [19] Kilian Fatras, Thibault Séjourné, Rémi Flamary, and Nicolas Courty. Unbalanced minibatch optimal transport; applications to domain adaptation. In International Conference on Machine Learning, pages 3186–3197. PMLR, 2021.
- [20] Alessio Figalli. The optimal partial transport problem. Archive for rational mechanics and analysis, 195(2):533–560, 2010.
- [21] Alessio Figalli and Nicola Gigli. A new transportation distance between non-negative measures, with applications to gradients flows with dirichlet boundary conditions. Journal de mathématiques pures et appliquées, 94(2):107–130, 2010.
- [22] Alessio Figalli and Federico Glaudo. An Invitation to Optimal Transport, Wasserstein Distances, and Gradient Flows. European Mathematical Society, 2021.
- [23] Rémi Flamary, Nicolas Courty, Alexandre Gramfort, Mokhtar Z. Alaya, Aurélie Boisbunon, Stanislas Chambon, Laetitia Chapel, Adrien Corenflos, Kilian Fatras, Nemo Fournier, Léo Gautheron, Nathalie T.H. Gayraud, Hicham Janati, Alain Rakotomamonjy, Ievgen Redko, Antoine Rolet, Antony Schutz, Vivien Seguy, Danica J. Sutherland, Romain Tavenard, Alexander Tong, and Titouan Vayer. Pot: Python optimal transport. Journal of Machine Learning Research, 22(78):1–8, 2021.
- [24] Aude Genevay, Gabriel Peyré, and Marco Cuturi. Gan and vae from an optimal transport point of view. arXiv preprint arXiv:1706.01807, 2017.
- [25] Kevin Guittet. Extended Kantorovich norms: a tool for optimization. PhD thesis, INRIA, 2002.
- [26] Hicham Janati, Marco Cuturi, and Alexandre Gramfort. Wasserstein regularization for sparse multi-task regression. In The 22nd International Conference on Artificial Intelligence and Statistics, pages 1407–1416. PMLR, 2019.
- [27] Narendra Karmarkar. A new polynomial-time algorithm for linear programming. In Proceedings of the sixteenth annual ACM symposium on Theory of computing, pages 302–311, 1984.
- [28] Sanggyun Kim, Rui Ma, Diego Mesa, and Todd P Coleman. Efficient bayesian inference methods via convex optimization and optimal transport. In 2013 IEEE International Symposium on Information Theory, pages 2259–2263. IEEE, 2013.
- [29] Soheil Kolouri, Navid Naderializadeh, Gustavo K Rohde, and Heiko Hoffmann. Wasserstein embedding for graph learning. In International Conference on Learning Representations, 2020.
- [30] Shinjini Kundu, Soheil Kolouri, Kirk I Erickson, Arthur F Kramer, Edward McAuley, and Gustavo K Rohde. Discovery and visualization of structural biomarkers from mri using transport-based morphometry. NeuroImage, 167:256–275, 2018.
- [31] Jan Lellmann, Dirk A Lorenz, Carola Schonlieb, and Tuomo Valkonen. Imaging with kantorovich–rubinstein discrepancy. SIAM Journal on Imaging Sciences, 7(4):2833–2859, 2014.
- [32] Matthias Liero, Alexander Mielke, and Giuseppe Savare. Optimal entropy-transport problems and a new hellinger–kantorovich distance between positive measures. Inventiones mathematicae, 211(3):969–1117, 2018.
- [33] Huidong Liu, Xianfeng Gu, and Dimitris Samaras. Wasserstein gan with quadratic transport cost. In Proceedings of the IEEE/CVF international conference on computer vision, pages 4832–4841, 2019.
- [34] Caroline Moosmüller and Alexander Cloninger. Linear optimal transport embedding: Provable wasserstein classification for certain rigid transformations and perturbations. Information and Inference: A Journal of the IMA, 12(1):363–389, 2023.
- [35] Navid Naderializadeh, Joseph F Comer, Reed Andrews, Heiko Hoffmann, and Soheil Kolouri. Pooling by sliced-wasserstein embedding. Advances in Neural Information Processing Systems, 34:3389–3400, 2021.
- [36] Khai Nguyen, Dang Nguyen, and Nhat Ho. Self-attention amortized distributional projection optimization for sliced wasserstein point-cloud reconstruction. arXiv preprint arXiv:2301.04791, 2023.
- [37] Khai Nguyen, Dang Nguyen, Tung Pham, Nhat Ho, et al. Improving mini-batch optimal transport via partial transportation. In International Conference on Machine Learning, pages 16656–16690. PMLR, 2022.
- [38] F. Santambrogio. Optimal Transport for Applied Mathematicians. Calculus of Variations, PDEs and Modeling. Birkhäuser, 2015.
- [39] Meyer Scetbon and marco cuturi. Low-rank optimal transport: Approximation, statistics and debiasing. In Alice H. Oh, Alekh Agarwal, Danielle Belgrave, and Kyunghyun Cho, editors, Advances in Neural Information Processing Systems, 2022.
- [40] Cedric Villani. Topics in Optimal Transportation, volume 58. American Mathematical Society, 2003.
- [41] Wei Wang, Dejan Slepčev, Saurav Basu, John A Ozolek, and Gustavo K Rohde. A linear optimal transportation framework for quantifying and visualizing variations in sets of images. International journal of computer vision, 101(2):254–269, 2013.
- [42] Jianbo Ye, Panruo Wu, James Z Wang, and Jia Li. Fast discrete distribution clustering using wasserstein barycenter with sparse support. IEEE Transactions on Signal Processing, 65(9):2317–2332, 2017.
Appendix
We refer to the main text for references.
Appendix A Notation
-
•
, -dimensional Euclidean space endowed with the standard Euclidean norm . is the associated distance, i.e., .
-
•
canonical inner product in .
-
•
, column vector of size with all entries equal to 1.
-
•
, diagonal matrix.
-
•
, transpose of a matrix .
-
•
, non-negative real numbers.
-
•
, convex and compact subset of . .
-
•
, set of probability Borel measures defined in .
-
•
, set of positive finite Borel measures defined in .
-
•
, set of signed measures.
-
•
, ; , , standard projections.
-
•
, push-forward of the measure by the function. for all measurable set , where .
-
•
, Dirac measure concentrated on .
-
•
, discrete measure (, ). The coefficients are called the weights of .
-
•
, support of the measure .
-
•
minimum measure between and ; vector having at each entry the minimum value and .
-
•
reference measure. target measures. In the OT framework, they are in . In the OPT framework, they are in .
-
•
, set of Kantorovich transport plans.
-
•
, Kantorovich cost given by the transportation plan between and .
-
•
, set of optimal Kantorovich transport plans.
-
•
, optimal transport Monge map.
-
•
, identity map .
-
•
for . Viewed as a function of , it is a flow.
- •
-
•
. at each time is a vector field. , initial velocity.
-
•
, divergence of the vector field with respect to the spatial variable .
-
•
, continuity equation.
-
•
, set of solutions of the continuity equation with boundary conditions and .
-
•
, continuity equation with forcing term .
-
•
, set solutions of the continuity equation with forcing term with boundary conditions and .
- •
-
•
, -Wasserstein distance.
-
•
, where (if is discrete, is identified with and ).
- •
-
•
, penalization in OPT.
-
•
if for all measurable set and we say that is dominated by .
-
•
, set of partial transport plans.
-
•
, , marginals of .
-
•
(for the reference ), (for the target ).
-
•
, partial transport cost given by the partial transportation plan between and with penalization .
-
•
, set of optimal partial transport plans.
- •
-
•
- •
- •
- •
-
•
, geodesic in LOT embedding space.
-
•
, LOT geodesic.
- •
-
•
OPT interpolating curve, and LOPT interpolating curve are defined in section 3.5.
Appendix B Proof of lemma 2.1
Proof.
We fix 141414Although in subsection 2.4 we use the notation , here we use the notation to emphasize that we are fixing an optimal plan., and then we compute the map according to (16). This map induces a transportation plan . We will prove that . By definition, it is easy to see that its marginals are and . The complicated part is to prove optimality. Let be an arbitrary transportation plan between and (i.e. ). We need to show
| (43) |
Since is a diagonal matrix with positive diagonal, its inverse matrix is . We define
We claim . Indeed,
| (44) | ||||
| (45) |
where the second equality in (44) and the third equality in (45) follow from the fact , and the fourth equality in (44) and the second equality in (45) hold since .
Since is optimal for ,we have to denote the transportation cost for and , respectively. We write
where is a constant (which only depends on ). Similarly,
Analogously, we have
| (46) |
where is constant (which only depends on and ) and similarly
| (47) |
Therefore, by (46) and (47), we have that if and only if . So, we conclude the proof by the fact is optimal for . ∎
Appendix C Proof of Proposition 2.2
Lemma C.1.
Given discrete measures , suppose that the maps and solve and , respectively. For , define . Then, the mapping solves the problem .
Proof.
Let be the corresponding transportation plan induced by . Consider an arbitrary such that . We need to show
We have
| (48) |
where in third equation, is a constant which only depends on the marginals . Similarly,
| (49) |
By the fact that , and that is optimal for , we have
Appendix D Proof of proposition 3.1
This result relies on the definition (29) of the curve , which is inspired by the fact that solutions of non-homogeneous equations are given by solutions of the associated homogeneous equation plus a particular solution of the non-homogeneous. We choose the first term of as a solution of a (homogeneous) continuity equation ( defined in (28)), and the second term () as an appropriate particular solution of the equation (26) with forcing term defined in (31). Moreover, the curve will become optimal for (25) since both and are ‘optimal’ in different senses. On the one hand, is optimal for a classical optimal transport problem151515Here we will strongly use that the fixed partial optimal transport plan in the hypothesis of the proposition has the form , for a map . On the other hand, is defined as a line interpolating the new part introduced by the framework of partial transportation, ‘destruction and creation of mass’.
Although this is the core idea behind the proposition, to prove it we need several lemmas to deal with the details and subtleties.
First, we mention that, the push-forward measure can be defined satisfying the formula of change of variables
for all measurable set , and all measurable function , where . This is a general fact, and as an immediate consequence, we have conservation of mass
Then, in our case, the second term in the cost function (24) we can be written as
since and are dominated by and , respectively, in the sense that and .
Finally, we would like to point out that when we say that is a solution for equation (26), we mean that it is a weak solution or, equivalently, it is a solution in the distributional sense [38, Section 4 4]. That is, for any test function continuous differentiable with compact support, satisfies
or, equivalently, for any test function continuous differentiable with compact support, satisfies
Lemma D.1.
If is optimal for , and has marginals and , then is optimal for , and .
Proof.
Let denote the objective function of the minimization problem , and similarly consider . Also, let be the objective function of .
First, given an arbitrary plan , we have
Since , we have . Thus, is optimal for .
Similarly, for every , we have and thus is optimal for . Analogously, is optimal for . ∎
Lemma D.2.
If , then , where , , and is the Euclidean distance in .
Proof.
We will proceed by contradiction. Assume that . Then, there exist and such that . Moreover, we can choose such and , where denotes the ball in of radius centered at .
We will construct with transportation cost strictly less than , leading to a contradiction. For we denote by the probability measure given by restricted to . Let . Now, we consider
Then, because
The partial transport cost of is
which is a contradiction.
∎
Lemma D.3.
Using the notation and hypothesis of Proposition 3.1, for let . Then, over .
Proof.
We will prove this for . The other case is analogous. Suppose by contradiction that is not the null measure. By Lemma D.1, we know that is optimal for . Since we are also assuming that is induced by a map , i.e. , then is an optimal Monge map between and . Therefore, the map is invertible (see for example [38, Lemma 5.29]). For ease of notation we will denote as a measure in .
The idea of the proof is to exhibit a plan with smaller cost than , which will be a contradiction since . Let us define
Then, since
From the last equation we can also conclude that . Therefore, the partial transportation cost for is
where in the last inequality we used that if we have
∎
Lemma D.4.
Using the notation and hypothesis of Proposition 3.1, for the vector-valued measures and are exactly zero.
Proof.
We prove this for . The other case is analogous. We recall that the measure is determined by
for all measurable functions , where denotes the usual dot product in between the vectors and .
From Lemma D.3 we know that over . Therefore, and are mutually singular in that set. This implies that we can decompose into two disjoint sets , such that . Since is a function defined –almost everywhere (up to sets of null measure with respect to ), we can assume without loss of generality that on .
Let be a measurable vector-valued function over . Using that in and in , and that , we obtain
Since was arbitrary, we can conclude that . ∎
Lemma D.5.
Using the notation and hypothesis of Proposition 3.1, the measure satisfies the equation
| (50) |
Proof.
From Lemma D.4 we have that , then . It is easy to see that satisfies the boundary conditions by replacing and in its definition. Also, . Then, since for every , we get . ∎
Proof of Proposition 3.1.
First, we address that the is well defined. Indeed, by Lemma D.1, we have that is optimal for . Thus, for each , by so-called cyclical monotonicity property of the support of classical optimal transport plans, there exists at most one such that , see [38, Lemma 5.29]. So, in (30) is well defined by understanding its definition as
Now, we check that defined in (29), (30), (31) is a solution for (26). In fact,
where is given by (28), and is as in Lemma D.5. Then, from section 2.2, solves the continuity equation (5) since (Lemma D.1), and from its definition coincides with (9) in this context, as well as coincides with (8) (the support of lies on the support of ). On the other hand, from Lemma D.5, solves (50). Therefore, by linearity,
Finally, by plugging in into the objective function in (25), we have:
since . So, this shows that is minimum for (25).
The ‘moreover’ part holds from the above identities, using that
since is such that for all [4, Lemma 3.2].
∎
Appendix E Proof of Theorem 3.5
The proof will be similar to that of Lemma 2.1. To simplify the notation, in this proof, we use (and ) to replace (and ).
E.1 Notation setup
We choose . We will understand the second marginal distribution induced by , either as the vector or as the measure , and, by abuse of notation, we will write (analogously for ).
Let denote the transportation plan induced by mapping .
Let
We select .
With a slight abuse of notation, we define
where we mean that is a digonal matrix with:
The goal is to show
| (51) |
E.2 Connect and
Note, First, we claim . Indeed, we have
| (52) | ||||
| (53) |
where is defined with if and elsewhere.
In (52), the equality follows from the following: , we have . In (53), the inequality follows from the fact .
Note, from (52), we also have .
We compute the transportation costs induced by :
Similarly,
Therefore, we obtain
| (54) |
And also,
Thus we obtain
| (55) |
E.3 Verification of the inequality
It remains to show (56) is less than . By Jensen’s inequality, for each , we obtain
Combined with the fact , we obtain:
| (57) |
Appendix F Proof of Theorem 3.6
Proof.
Without loss of generality, we assume that is induced by a 1-1 map. We can suppose this since the trick is that we will end up with an -point representation of when we get . For example, if two and are mapped to the same point , when performing the barycentric, we can split this into two different labels with corresponding labels. (The moral is that the labels are important, rather than where the mass is located.) Therefore, is such that in each row and column there exists at most one positive entry, and all others are zero. Let . Then, by the definition of , we have . Thus,
where the last equality holds from Theorem 3.5. This concludes the proof.
Moreover, from the above identities (for discrete measure) we can express
∎
Appendix G Proof of Proposition 3.7
Appendix H Applications
For completeness, we will expand on the experiments and discussion presented in Section 4, as well as on Figure 1 which contrasts the HK technique with OPT from the point of view of interpolation of measures.
First, we recall that similar to LOT [41] and [34], the goal of LOPT is not exclusively to approximate OPT, but to propose new transport-based metrics (or discrepancy measures) that are computationally less expensive and easier to work with than OT or OPT, specifically when many measures must be compared.
Also, one of the main advantages of the linearization step is that it allows us to embed sets of probability (resp. positive finite) measures into a linear space ( space). Moreover, it does it in a way that allows us to use the -metric in that space as a proxy (or replacement) for more complicated transport metrics while preserving the natural properties of transport theory. As a consequence, data analysis can be performed using Euclidean metric in a simple vector space.
H.1 Approximation of OPT Distance
For a better understanding of the errors plotted in Figure 2, the following Figure 6 shows the histograms of the relative errors for different values of and each number of measures .

As said in Section 4, we recall that for these experiments, we created point sets of size for different Gaussian distributions in . In particular, , where is randomly selected such that for . For the reference, we picked an point representation of with . For figures 2 and 6, the sample size was set equal to .
In what follows, we include tests for and . For each , we repeated each experiment times. The relative errors are shown in Figure 7. For large , most mass is transported and , the performance of LOPT is close to that of LOT, and the relative error is small. For small , almost no mass is transported, , and we still have a small error. In between, e.g., , we have the largest relative error. Similar results were obtained by setting the reference as the OT barycenter.

H.2 PCA analysis
For problems where doing pair-wise comparisons between distributions is needed, in the classical optimal (partial) transport setting we have to solve OT (resp. OPT) problems. In the LOT (resp. LOPT) framework, however, one only needs to perform OT (resp. OPT) problems (matching each distribution with a reference measure).
One very ubiquitous example is to do clustering or classification of measures. For this case, the number of target measures representing different samples is usually very large. For the particular case of data analysis on Point Cloud MNIST, after using PCA in the embedding space (see Figure 5), it can be observed that the LOT framework is a natural option for separating different digits, but the equal mass requirement is too restrictive in the presence of noise. LOPT performs better since it does not have this restriction. This is one example where the number of measures is much larger than 2.
H.3 Point Cloud Interpolation
Here, we add the results of the experiments mentioned in Section 4 which complete Figure 4. In the new Figure 8, in fact, Figure 4 corresponds to the subfigure 8(b). We conducted experiments using three digits (0, 1, and 9) from the PointCloud MNIST dataset, with 300 point sets per digit. We utilized LOPT embedding to calculate and visualize the interpolation between pairs of digits. We chose the barycenter between 0, 1, and 9 as the reference for our experiment. However, to avoid redundant results, in the main paper, we only demonstrated the interpolation between 0 and 9 in our main paper. The remaining plots for the other digit pairs using different levels of noise are included here for completeness. Later, in Section H.4, Figure 11 will add the plots for the HK technique and its linearized version.


H.4 Preliminary comparisons between LHK and LOPT
The contrasts between the Linearized Hellinger-Kantorovich (LHK) [10] and the LOPT approaches come from the differences between HK (Hellinger-Kantorovich) and OPT distances.
The main issue is that for HK transportation between two measures, the transported portion of the mass does not resemble the OT-geodesic where mass is preserved. In other words, HK changes the mass as it transports it, while OPT preserves it.
This issue is depicted in Figure 1. In that figure, both the initial (blue) and final (purple) distributions of masses are two unit-mass delta measures at different locations. Mass decreases and then increases while being transported for HK, while it remains constant for OPT. For HK, the transported portion of the mass does not resemble the OT-geodesic where mass is preserved. In other words, HK changes the mass as it transports it, while OPT preserves it.
To illustrate better this point, we incorporate here Figure 9 which is the two-dimensional analog of Figure 1.

In addition, in Figure 10 we not only compare HK and OPT, but also LHK and LOPT. The top subfigure 10(a) shows the measures (blue dots) and (orange crosses) to be interpolated with the different techniques in the next subfigures 10(b) and 10(c). Also, in 10(a) we plot the reference (green triangles) which is going to be used only in experiment 10(c). The measures and are interpreted as follows. The three masses on the interior, forming a triangle, can be considered as the signal information and the two masses on the corners can be considered noise. That is, we can assume they are just two noisy point cloud representations of the same distribution shifted. We want to transport the three masses in the middle without affecting their mass and relative positions too much. Subfigure 10(b) shows HK and OPT interpolation between the two measures and . In the HK cases, we notice not only how the masses vary, but also how their relative positions change obtaining a very different configuration at the end of the interpolation. OPT instead returns a more natural interpolation because of the mass preservation of the transported portion and the decoupling between transport and destruction/creation of mass. Finally, subfigure 10(c) shows the interpolation of and for LHK and LOPT. The reference measure is the same for both and we can see the denoising effect due to the fact that, for the three measures, the mass is concentrated in the triangular region in the center. However, while mass and structure-preserving transportation can be seen for LOPT, for LHK the shape of the configuration changes.
On top of that, as is often the case on quantization, point cloud representations of measures are given as samples with uniform mass. OPT/LOPT interpolation will not change the mass of each transported point. Therefore, the intermediate steps of an algorithm using OPT/LOPT transport benefit from conserving the same type of representation. That is, as a uniform set of points.


For comparison on PointCloud interpolation using MNIST, we include Figure 11 that illustrates OPT, LOPT, HK, and LHK interpolation for digit pairs (0,1) and (0,9). In the visualizations, the size of each circle is plotted according to amount of the mass at each location.


However, we do not claim the presented LOPT tool to be a one size fits all kind of tool. We are working on the subtle differences between LHK and LOPT and expect to have a complete and clear picture in the future. The aim of this article was to present a new tool with an intuitive introduction and motivation so that the OT community would benefit from it.
H.5 Barycenter computation
Can the linear embedding technique be used to compute the barycenter of a set of measures, e.g., by computing the barycenter of the embeddings and performing an inversion to the original space?
One can first calculate the mean of the embedded measures, and recover a measure from this mean. The recovered measure is not necessarily the OPT barycenter, however, one can repeat this process and obtain better approximations of the barycenter. Similar to LOT, we have numerically observed that such a process will converge to a measure that is close to the barycenter. However, there are several technical considerations that one needs to pay close attention. For instance, the choice of and the choice of the initial reference measure are critical in this process.
