Learning to Cluster via Same-Cluster Queries
Abstract.
We study the problem of learning to cluster data points using an oracle which can answer same-cluster queries. Different from previous approaches, we do not assume that the total number of clusters is known at the beginning and do not require that the true clusters are consistent with a predefined objective function such as the -means. These relaxations are critical from the practical perspective and, meanwhile, make the problem more challenging. We propose two algorithms with provable theoretical guarantees and verify their effectiveness via an extensive set of experiments on both synthetic and real-world data.
1. Introduction
Clustering is a fundamental problem in data analytics and sees numerous applications across many areas in computer science. However, many clustering problems are computationally hard, even for approximate solutions. To alleviate the computational burden, Ashtiani et al. (Ashtiani et al., 2016) introduced weak supervision into the clustering process. More precisely, they allow the algorithm to query an oracle which can answer same-cluster queries, that is, whether two elements (points in the Euclidean space) belong to the same cluster. The oracle can, for example, be a domain expert in the setting of crowdsourcing. It was shown in (Ashtiani et al., 2016) that the -means clustering can be solved computationally efficiently with the help of a small number of same-cluster queries using the oracle.
The initial work by Ashtiani et al. (Ashtiani et al., 2016) relies on a strong “data niceness property” called the -margin, which requires that for each cluster with center , the distance between any point and needs to be larger than that between any point and by at least a constant multiplicative factor sufficiently large. This assumption was later removed by Ailon et al. (Ailon et al., 2018b), who gave an algorithm which, given a parameter , outputs a set of centers attaining a -approximation of the -means objective function. There has been follow-up work by Chien et al. (Chien et al., 2018) in the same setting, replacing the -margin assumption with a new assumption on the size of the clusters. However, there are still two critical issues in this line of approach:
- (1)
-
(2)
In (Ailon et al., 2018b; Chien et al., 2018), it is assumed that the optimal solution to the -means clustering is consistent with the true clustering (i.e., when we have ground truth labels for all points). This assumption is highly problematic, since the ground-truth clustering can be arbitrary and very different from an optimal solution with respect to a fixed objective function such as the -means.
In this paper, we aim to remove both assumptions. We shall design algorithms that find the approximate centers of the true clusters using same-cluster queries, in the setting that we do not know in advance the number of clusters in the true clustering and the true clustering has no relationship with the optimal solution of a certain objective function. We obtain our result at a small cost: our sample-based algorithm may not be able to find the centers of the small clusters which are very close to some big identified clusters; we shall elaborate on this shortly.
Problem Setup. We denote the clusters by , which are point sets in the Euclidean space. For each , let be its centroid. For simplicity we refer to as “cluster ” or “-th cluster”. The number of clusters is unknown at the beginning. Our goal is to find all “big” clusters and their approximate centroids .
To specify what we mean by finding all big clusters, we need to introduce a concept called reducibility. Several previous studies (Kumar et al., 2010; Jaiswal et al., 2014; Ailon et al., 2018b) on the -means/median clustering problem assumed that after finding main clusters, the residual ones satisfy some reducibility condition, which states that using the discovered cluster centers to cover the residual ones would only increase the total cost by a small factor. Similarly, we consider the following reducibility condition, based on the usual cost function.
Definition 0 (cost function).
Suppose that and are the set of data points and centers, respectively. The cost of covering using is , where denotes the Euclidean norm. When is a singleton, we also write as . When , we define .
Definition 0 (-reducibility).
Let be true clusters in . Let be a subset of indices of clusters in . We say the clusters in are -reducible w.r.t. if it holds for each that
Intuitively, this reducibility condition states that the clusters outside will be covered by the centers of the clusters in with only a small increase in the total cost.
Our goal is to find a subset of indices such that the set of true clusters in is -reducible w.r.t. .
Note that in this formulation, we do not attempt to optimize any objective function; instead, we just try to recover the approximate centroids of a set of clusters to which all other clusters are reducible. Inevitably we have to adopt a distance function in our definition of irreducibility, and we choose the widely used (Euclidean-squared) distance function so that we can still use the -sampling method developed and used in the earlier works (Arthur and Vassilvitskii, 2007; Jaiswal et al., 2014; Ailon et al., 2018b). The -sampling will be introduced in Definition 2.
| set of input points | |
|---|---|
| index of the round | |
| set of indices of recovered clusters so far | |
| number of recovered clusters so far | |
| set of indices of newly discovered clusters | |
| in the current round | |
| size of ; number of newly discovered clusters | |
| in the current round | |
| multiset of samples. Each sample has the form of | |
| , where is the point and the cluster index. | |
| reference point in cluster for rejection sampling | |
| multiset of uniform samples in cluster returned | |
| by rejection sampling. Note that . | |
| set of indices of clusters to recover | |
| total number of recovered clusters at the end | |
| total number of discovered clusters at the end |
To facilitate discussion, we list in Table 1.1 the commonly used notations in our algorithms and analyses. A cluster is said to be “discovered” if any point in has been sampled and “recovered” when the approximate centroid is computed. As discussed in the preceding paragraph, it is possible that the total number of recovered clusters, , is less than the total number of discovered clusters, , and that is less than the true number of clusters.
Our Contributions. We provide two clustering algorithms with theoretically proven bounds on the total number of oracle queries in the circumstance of no prior knowledge on the number of clusters and no predefined objective function. To the best of our knowledge, these are the first algorithms for the clustering problem of its kind. Both our algorithms output -approximate centers for all recovered clusters. Our first algorithm makes queries (Section 3) and the second algorithm makes queries (Section 4).111In we use ‘’ to hide logarithmic factors. The exact query complexities can be found in the Theorems 6 and 5.
We also conduct an extensive set of experiments demonstrating the effectiveness of our algorithms on both synthetic and real-world data; see Section 6.
We further extend our algorithms to the case of a noisy same-cluster oracle which errs with a constant probability . This extension has been deferred to Appendix D of the full version of this paper.
We remark that since our algorithms target sublinear (i.e., ) number of oracle queries, in the general case where the shape of clusters can be arbitrary, it is impossible to classify correctly all points in the datasets. But the approximate centers outputted by the algorithms can be used to efficiently and correctly classify any newly inserted points (i.e., database queries) as well as existing database points (when needed), using a natural heuristic (Heuristic 1) that we shall introduce in Section 6. Our experiments show that most points can be classified using only one additional oracle query.
Related Work. As mentioned, the semi-supervised active clustering framework was first introduced in (Ashtiani et al., 2016), where the authors considered the -means clustering under the -margin assumption. Ailon et al. (Ailon et al., 2018a, b) proposed approximation algorithms for the -means and correlation clustering that compute a -approximation of the optimal solution with the help of same-cluster queries. Chien et al. (Chien et al., 2018) studied the -means clustering under the same setting as that in (Ailon et al., 2018b), but used uniform sampling instead of -sampling and worked under the assumption that no cluster (in the true clustering) has a small size. Saha and Subramanian (Saha and Subramanian, 2019) gave algorithms for correlation clustering with the same-cluster query complexity bounded by the optimal cost of the clustering. Gamlath et al. (Gamlath et al., 2018) extended the -means problem from Euclidean spaces to general finite metric spaces with a strengthened guarantee that recovered clusters largely overlap with respect to the true clusters. All these works, however, assume that the ground truth clustering (known by the oracle) is consistent with the target objective function, which is unrealistic in most real world applications.
Bressan et al. (Bressan et al., 2020) considered the case where the clusters are separated by ellipsoids, in contrast to the balls as suggested by the usual -means clustering objective. However, their algorithm still requires the knowledge of and has a query complexity that depends on (although logarithmically), which we avoid in this work.
Mazumdar and Saha studied clustering points into clusters with a noisy oracle (Mazumdar and Saha, 2017a) or side information (Mazumdar and Saha, 2017b). The noisy oracle gives incorrect answers to same-cluster queries with probability (so that majority voting still works). The side information is the similarity score between each pair of data points, generated from a distribution if the pair belongs to the same cluster and from another distribution otherwise. Algorithms proposed in these papers guarantee to recover the true clusters of size at least , however, with query complexities at least , much larger than what we are interested to achieve in this paper.
Huleihel et al. (Huleihel et al., 2019) studied the overlapping clustering with the aid of a same-cluster oracle. Suppose that is an clustering matrix whose -th row is the indicator vector of the cluster membership of the -th element. The task is to recover from the similarity matrix using a small number of oracle queries.
2. Preliminaries
In this paper we consider point sets in the canonical Euclidean space . The geometric centroid, or simply centroid, of a finite point set is defined as . It is known that is the minimizer of the -center problem . The next lemma provides a guarantee on approximating the centroid of a cluster using uniform samples.
Lemma 1 ((Inaba et al., 1994)).
Let be a set of points obtained by independently sampling M points uniformly at random with replacement from a point set . Then for any , it holds that
We define the -sampling of a point set with respect to a point set as follows.
Definition 0 (-sampling).
The -sampling of a point set with respect to a point set returns a random point subject to the distribution defined by for all .
In this paper we use a same-cluster oracle, that is, given two data points , returns true if and belong to the same cluster and false otherwise. For simplicity of the algorithm description, we shall instead invoke the function to obtain the cluster index of , which can be easily implemented using the same-cluster oracle, as shown in Algorithm 2.1. This implies that the number of oracle queries is at most times the number of samples.
| then |
3. Basic Algorithm
Algorithm.
Despite the fact that the algorithm in (Ailon et al., 2018b) cannot be used directly because is unknown to us, we briefly review the algorithm below. The algorithm gradually “discovers” and then “recovers” more and more clusters by taking -samples. It recovers clusters in rounds, one in each round. To recover one cluster, it takes sufficient -samples w.r.t. the approximate centers , where is the set of the recovered clusters, and finds the largest unrecovered cluster . For this cluster , it obtains sufficient uniform samples via rejection sampling and invokes Lemma 1 to compute an approximate centroid . Then it includes in the set of recovered clusters and proceeds to the next round. It is shown that samples each round can achieve the failure probability of and taking a union bound over all rounds yields a constant overall failure probability.
There are two major difficulties of adapting this algorithm to our setting where is unknown.
-
(1)
The number of rounds is unknown. It is not clear when our algorithm should terminate, i.e., when we are confident that there are no more irreducible clusters. The failure probability of each round also needs to be redesigned and cannot be .
-
(2)
Since is unknown, we cannot predetermine the number of samples to use and have to maintain dynamically various stopping criteria. For instance, it is subtle to determine which one the largest cluster is. If we stop too early, we may identify a cluster that is actually small and will need a large number of samples in order to obtain enough uniform samples from this cluster when doing rejection sampling; if we stop too late, we can make a more accurate decision but may have already taken too many samples.
To address the first issue, we observe that samples is sufficient to test whether there are -irreducible clusters left with constant probability. We also assign the failure probability of the -th round to be such that is a small constant.
To address the second issue, observe that the -irreducibility condition implies that all unrecovered clusters together have a -value of and thus the largest unrecovered cluster has a -value of , where is the number of newly discovered clusters. We can show that samples suffices to ensure the identification of a cluster with -value at least and thus we can, since the value of increases as the number of samples grows, keep sampling until samples are obtained. Note that this is a dynamic criterion in contrast to the predetermined one in (Ailon et al., 2018b). We then choose the largest cluster and carry out the rejection sampling and estimate the approximate centroid with a careful control over the number of samples.
| then |
| then |
| then |
We present our algorithm in Algorithm 3.1 without attempts to optimize the constants. In our algorithm, each round is divided into four phases. Phase 1 tests whether there are new clusters to recover, using samples, where is the number of the recovered clusters. If no new clusters are found, the algorithm would terminate. Phase 2 samples more points and finds the largest cluster discovered so far, which we shall aim to recover in the two remaining phases. Phase 3 samples more points and finds a reference point to be used in the rejection sampling in the next phase. Phase 4 executes rejection sampling using the reference point such that the returned samples are uniform from the cluster . We need to collect uniform samples before calculating the approximate centroid for cluster . We then declare that cluster is recovered and start the next round.
We would like to remark that the -sampling which our algorithm uses has a great advantage over uniform sampling (Chien et al., 2018) when there are small and faraway clusters. Uniform sampling would require a large number of samples to find small clusters, regardless of their locations. On the other hand, faraway clusters are clearly irreducible and are rightfully expected to be recognized. The -sampling captures the distance information such that those small faraway clusters may have a large -value and can be found with much fewer samples.
Analysis.
Throughout the execution of the algorithm, we keep the loop invariant that
| (3.1) |
for all , i.e., the approximate centers are good for all recovered clusters.
It is clear that the main algorithm will terminate. We prove that the algorithm is correct, i.e., the algorithm will find all clusters with ’s being all good approximate centroids. We first need a lemma showing that the undiscovered clusters are heavy under the assumption of -reducibility. All proofs are postponed to Appendix B.
Lemma 1.
Suppose the -reducibility constraint w.r.t. does not hold. It holds for that .
Using the preceding lemma, we are ready to show that Phase 1 of Algorithm 3.1 discovers all heavy clusters with high probability.
Lemma 2.
Next we upper bound the number of samples. For each cluster define its conditional sample probability
| (3.2) |
where is the set of approximate centers so far. For each , we also define an empirical approximation , where denotes the number of samples seen so far which belong to cluster .
The next lemma shows that the new clusters we find in Phase 2 are heavy.
Lemma 3.
With probability at least , it holds that for all .
To analyse Phases 3 and 4, we define an auxiliary point set
| (3.3) |
Points in are good pivot points for the rejection sampling procedure in Phase 4. We first show that we can find a good pivot point in Phase 3.
Lemma 4.
Assume that the event in Lemma 3 occurs. Then with probability at least .
We then show that, with a good pivot point , the rejection sampling procedure in Phase 4 obtains sufficiently many uniform samples from cluster so that we can calculate a good approximate center later.
Lemma 5.
Assume that the event in Lemma 4 occurs. By sampling points in total, with probability at least , every cluster has samples returned by the rejection sampling procedure.
Theorem 6.
Remark 1.
When the clusters are -irreducible with respect to any subcollection of the clusters, we shall recover all clusters using same-cluster queries.
4. Improved Algorithm
In this section, we improve the basic algorithm by allowing the recovery of multiple clusters in each round. A particular case in which the basic algorithm would suffer from a prodigal waste of samples is that there are in total clusters of approximately the same size and they are -irreducible with respect to any subset . In such case, our basic algorithm requires a sample of size from that cluster, which in turn requires a global sample of size . Summing over rounds leads to a total number of samples. However, with global samples, we can obtain samples from every cluster and recover all clusters in the same round. This reduces a factor of in the total number of samples. The goal of this section is to improve the sample/query complexity of the basic algorithm by a factor of even in the worst case.
To recover an indefinite number of clusters in each round, it is a natural idea to generalize the basic algorithm to identifying a set of clusters, instead of the biggest one only, from which we shall obtain uniform samples via rejection sampling and calculate the approximate centroids . Here we face an ever greater challenge as to how to determine . The naïve idea of including all clusters of -value at least runs into difficulty: as we sample more points, the value of may increase and we may need to include more and more points, so when do we stop? We may expect that the value will stabilize after sufficiently many samples, but it is difficult to quantify “stable” and control the number of samples needed.
Our solution to overcome the above-mentioned difficulty is to split the clusters into bands. To explain this we introduce a few more notations. For each unrecovered cluster , recall that we defined in (3.2) its conditional sample probability ; we also define its empirical approximation to be , where denotes the number of samples seen so far which belong to the cluster . We split into bands for , where the -th band is defined to be
for and the last band consists of all the remaining clusters (i.e., ). We say a band is heavy if . The values and the bands are dynamically adjusted as the number of samples grows.
Instead of focusing on individual clusters and identifying the heavy ones, we shall identify the heavy bands at an appropriate moment and recover all the clusters in those heavy bands. Intuitively, it takes much fewer samples for bands to stabilize than for individual clusters. For instance, consider a heavy band which consists of many small clusters. In this case, we will have seen most of the clusters in the band without too many samples, although many of the ’s may be far off from ’s. The important observation here is that we have seen those clusters; in contrast, if we consider individual clusters, we would have missed many of those clusters and will focus on recovering a few of them, which would cause a colossal waste of samples in the rejection sampling stage, for a similar reason explained at the beginning of this section. Therefore such banding approach enables us to control the number of samples needed.
| and | then |
Our improved algorithm is presented in Algorithm 4.1. Each round remains divided into four phases. Phase 1 remains testing new clusters. Starting from Phase 2 comes the change that instead of recovering only the largest sampled cluster , we identify a subset of indices of the newly discovered clusters and recover all clusters in . Phase 2 samples more points and identifies this subset by splitting the discovered clusters into bands and choosing all clusters in the heavy bands. Phase 3 samples more points and finds a reference point for each . Phase 4 keeps sample points until each cluster sees points and then calculates the approximate centers for each . The clusters in will then be added to as recovered clusters before the algorithm starts a new round.
A technical subtlety lies in controlling the failure probability in our new algorithm. In the basic algorithm, the failure probability in the -th round is . If we recover clusters in -th round, this failure probability for each of the clusters needs to be , and as a consequence, samples are needed in the -th round. In the worst case this becomes samples, the same as in the basic algorithm, when both and . To resolve this, we guess in powers of and assign to be . For each fixed guess , the number of samples is bounded by ; iterating over guesses incurs only an additional factor.
The analysis of our improved algorithm follows the same sketch of the basic algorithm and we only present the changes below. All proofs are postponed to Appendix C. The next lemma offers a similar guarantee as Lemma 2.
Lemma 1.
Next we upper bound the number of samples with a lemma analogous to Lemma 3.
Lemma 2.
With probability at least , it holds that for all .
Recall that was defined in (3.3) for all . The following two lemmata are the analogue of Lemmata 4 and 5, respectively.
Lemma 3.
Assume that the event in Lemma 2 holds. With probability at least , it holds that for all .
Lemma 4.
Assume that the event in Lemma 3 holds. By sampling points in total, with probability at least , every cluster has samples returned by the rejection sampling procedure.
Now we are ready to prove the main theorem of the improved algorithm.
Theorem 5.
Remark 2.
The preceding theorem improves the query complexity of the basic algorithm by about a factor of , as desired. In particular, when the clusters are -irreducible with respect to any subcollection of the clusters, we shall recover all clusters using same-cluster queries, better than basic algorithm by about a factor of .
5. Noisy Oracles
Our algorithm can be extended to the case where the same-cluster oracle errs with a constant probability . The full details are postponed to Appendix D in the full version.
Theorem 1.
Suppose that the same-cluster oracle errs with a constant probability . With probability at least , there is an algorithm that finds all the clusters and obtains for every an approximate centroid that satisfies (3.1), using same-cluster queries in total.
6. Experiments
In this section, we conduct experimental studies of our algorithms. As we mentioned before, all previous algorithms need to know and it is impossible to convert them to the case of unknown (with the only exception of (Chien et al., 2018)). In particular, we note the inapplicability of the -means algorithm and the algorithm in (Ailon et al., 2018b).
-
•
The -means algorithm is for an unsupervised learning task and returns clusters which are always spherical, so it is undesirable for arbitrary shapes of clusters and it makes sense to examine the accuracy in terms of misclassified points. Our problem is semi-supervised with a same-cluster oracle, which can be used to recover clusters of arbitrary shapes and guarantees no misclassification. The assessment of the algorithm is therefore the number of discovered clusters and the number of samples. Owing to the very different nature of the problems, the -means algorithm should not be used in our problem or compared with algorithms designed specifically for our problem.
-
•
The algorithm in (Ailon et al., 2018b) runs in rounds and take samples in the first step of each round. With and , it needs to sample in each round at least points, usually larger than the size of a dataset. (Our algorithm can be easily simplified to handle such cases, see the subsection titled “Algorithms” below.)
The only exception, the algorithm in (Chien et al., 2018), is just simple uniform sampling and whether or not is known is not critical. This uniform sampling algorithm will be referred to as Uniform below.
Datasets. We test our algorithms using both synthetic and real world datasets.
For synthetic datasets, we generate points that belong to clusters in the -dimensional Euclidean space. Since in the real world the cluster sizes typically follow a power-law distribution, we assign to each cluster a random size drawn from the widely used Zipf distribution, which has the density function , where is the size of the cluster and a parameter controlling the skewness of the dataset. We then choose a center for each cluster in a manner to be specified later and generate the points in the cluster from the multivariate Gaussian distribution , where denotes the identity matrix.
Now we specify how to choose the centers. In practice, clusters in the dataset are not always well separated; there could be clusters whose centers are close to each other. We thus use an additional parameter to characterize this phenomenon. In the default setting of , all centers of the clusters are drawn uniformly at random from . When , we first partition the clusters into groups as follows: Think of each cluster as a node. For each pair of clusters, with probability we add an edge between the two nodes. Each connected component of the resulting graph forms a group. Next, for each group of clusters, we pick a random cluster and choose its center uniformly at random in . For each of the remaining clusters in the group, we choose its center uniformly at random in the neighborhood of radius centered at .
We use the following set of parameters as the default setting in our synthetic datasets: , , , , , and .
We also use the following two real-world datasets.
-
•
Shuttle 222https://archive.ics.uci.edu/ml/datasets/Statlog+(Shuttle).: it describes the radiator positions in a NASA space shuttle. There are 58,000 points with 9 numerical attributes, and 7 clusters in total.
-
•
Kdd 333http://kdd.ics.uci.edu/databases/kddcup99/kddcup99.html.: this dataset is taken from the 1999 KDD Cup contest. It contains about 4.9M points classified into 23 clusters. The original dataset has 41 attributes. We retain all numerical attributes except one that contains only zeros, resulting in 33 attributes in total.
Each feature in the real world datasets is normalized to have zero mean and unit standard deviation.
Algorithms. We compare three algorithms listed below. A cluster is said to be heavy when the number of (uniform) samples obtained from this cluster is more than a predetermined threshold, which is set to be in our experiments.
-
•
Uniform: This is uniform sampling. That is, we keep getting random samples from the dataset one by one and identify their label by same-cluster queries. We recover a cluster when it becomes heavy.
-
•
Basic: This is based on our basic algorithm (Algorithm 3.1). We recover clusters one at a time when it becomes heavy.
-
•
Batched: This is a simplified version of the improved algorithm (Algorithm 4.1). Instead of partitioning clusters to bands and then recovering all clusters in the heavy bands, in each round we just keep sampling points until the fraction of points in the heavy clusters is more than a half, at which moment we try to recover all heavy clusters in a batch.
Recall that in our basic and improved algorithms, we always “ignore” the samples belonging to the unrecovered clusters in the previous rounds, which will not affect our theoretical analysis. But in practice it is reasonable to reuse these “old” samples in the succeeding rounds so that we are able to recover some clusters earlier. Because of such a sample-reuse procedure, the practical performance difference between the Basic and Batched algorithms becomes less significant. Recall that in theory, the main improvement of Batched over Basic is that we try to avoid wasting too many samples in each round by recovering possibly more than one cluster at a time. But still, as we shall see shortly, Batched outperforms Basic in all metrics, though sometimes the gaps may not seem significant.
Measurements. To measure the same-cluster query complexity, we introduce two assessments. The first is fixed-budget, where given a fixed number of same-cluster queries, we compare the number of clusters recovered by different algorithms. The second is fixed-recovery, where each algorithm needs to recover a predetermined number of clusters, and we compare the numbers of same-cluster queries the algorithms use.
We also report the error of the approximate centroid of each recovered cluster. For a recovered cluster , let be its centroid and be the approximate center. We define the centroid approximation error to be .
For Basic and Batched, we further compare their running time and round usage. We note that a small round usage is very useful if we want to efficiently parallelize the learning process.
Finally, we would like to mention one subtlety when measuring the number of same-cluster queries. Since all algorithms that we are going to test are sampling based, and for each sampled point we need to identify its label by same-cluster queries, which, in the worst case, takes queries, where is the number of the discovered clusters so far. In practice, however, a good query order/strategy can save us a lot of same-cluster queries. We apply the following query strategy for all tested algorithms.
Heuristic 1.
For each discovered cluster, we maintain its approximate center (using the samples we have obtained). When a new point is sampled, we query the centers of discovered clusters based on their distances to the new point in the increasing order as follows. Suppose that the new point is . We calculate the distances between and all approximate centers , and sort them in increasing order, say, . Then for sequentially, we check whether belongs to cluster by querying whether and some sample point from cluster belong to the same cluster. If does not belong to any discovered cluster, a new cluster will be created.
We will also use this heuristic to test the effectiveness of approximate centers for classifying new points. That is, for a newly inserted point , we count the number of same-cluster queries needed to correctly classify using the approximate centers and Heuristic 1.
Computation Environments. All algorithms are implemented in C++, and all experiments were conducted on Dell PowerEdge T630 server with two Intel Xeon E5-2667 v4 3.2GHz CPU with eight cores each and 256GB memory.
6.1. Results
The three algorithms, Uniform, Basic and Batched, are compared on the same-cluster query complexity, the quality of returned approximate centers, the running time and the number of rounds. All results are the average values of runs of experiments.
Fixed-budget
Fixed-recovery

Fixed-budget

Fixed-recovery

Fixed-budget

Fixed-recovery
Query Complexity. For each of the synthetic and real-world datasets, we measure the query complexities under both fixed-budget and fixed-recovery settings.
The results for synthetic dataset, the Shuttle dataset and the Kdd dataset are plotted in Figure 1, Figure 2 and Figure 3, respectively. In all figures, the left column corresponds to the fixed-budget case and the right column the fixed-recovery case. We note that some points for Uniform are missing since they are out of the boundary. The exact values of all experiments can be found in Appendix E of the full version.
For all datasets, Basic and Batched significantly outperform Uniform. Take Kdd dataset for example, we observe that with query budget Uniform recovers clusters while Basic and Batched recover around clusters. In order to recover clusters, Uniform requires queries per cluster, while Basic and Batched only requires no more than queries per cluster. Even on small datasets such as Shuttle, Uniform needs about twice amount of queries to recover all clusters compared with Basic and Batched. We also observe that Batched performs slightly better than Basic.
On synthetic datasets, one can see that higher collision probability makes clustering more difficult for all algorithms. Given a query budget of , Basic and Batched can recover about clusters when (no collision), but only about clusters when .
We also observe that Batched performs better than Basic in the Kdd dataset in all settings, except the fixed-recovery setting for the Shuttle dataset, in which they have almost the same performance.
Center Approximation. We compare the approximation error of each algorithm to show the quality of returned approximate centers. We run all three algorithms in the fixed-recovery setting because we can only measure the error of the recovered clusters. We examine the median error among all recovered clusters and observe that the centroid approximation errors are indeed similar on all datasets when the same number of clusters is recovered. Detailed results are listed in Tables 6.4 to 6.4. We observe that all centroid approximation error rates are below 10%: the error rates are about 9% on the synthetic datasets and are about 5% on the two real-world datasets. There is no significant difference between the error rates of different algorithms; the maximum difference is no more than 2%. These consistent results indicate that the approximate centers computed by all algorithms are of good quality.
| #Clusters | Algorithms | 20 | 30 | 40 | 50 | 60 | 70 |
|---|---|---|---|---|---|---|---|
| Basic | 8.70% | 8.70% | 8.50% | 8.41% | 8.43% | 8.37% | |
| Batched | 8.74% | 8.60% | 8.56% | 8.64% | 8.43% | 8.51% | |
| Uniform | 9.90% | 9.43% | 9.58% | 9.22% | 9.24% | 9.18% | |
| Basic | 8.86% | 8.68% | 8.72% | 8.39% | 8.51% | 8.45% | |
| Batched | 8.76% | 8.64% | 8.45% | 8.49% | 8.50% | 8.42% | |
| Uniform | 9.59% | 9.64% | 9.39% | 9.42% | 9.30% | 9.18% | |
| Basic | 8.87% | 8.68% | 8.56% | 8.40% | 8.34% | 8.38% | |
| Batched | 8.95% | 8.64% | 8.57% | 8.37% | 8.35% | 8.39% | |
| Uniform | 9.75% | 9.44% | 9.45% | 9.35% | 9.25% | 9.28% |
| #Clusters | 2 | 3 | 4 | 5 | 6 | 7 |
|---|---|---|---|---|---|---|
| Basic | 9.72% | 4.99% | 6.28% | 5.40% | 5.85% | 5.91% |
| Batched | 8.94% | 4.78% | 6.33% | 5.44% | 5.89% | 5.66% |
| Uniform | 9.32% | 4.92% | 5.79% | 5.67% | 5.65% | 5.50% |
| #Clusters | 6 | 8 | 10 | 12 | 14 | 16 |
|---|---|---|---|---|---|---|
| Basic | 3.70% | 3.83% | 4.87% | 5.75% | 5.95% | 5.68% |
| Batched | 3.57% | 3.68% | 4.49% | 4.39% | 5.04% | 5.53% |
| Uniform | 3.96% | 5.21% | 4.92% | 4.83% | 4.57% | 5.43% |
Time and Rounds. We compare the running time and the number of rounds between Basic and Batched, with results presented in Figure 4 to Figure 6. Here we present the running time in the sampling stage, showing that the reduced round usage in Batched also leads to a reduced usage of sampling time in Batched. In terms of the time saving in querying stage, we have already discussed it in the query complexity part. The only exception is the Shuttle dataset, where the performance of Basic and Batched are almost the same; this may be because the number of clusters in Shuttle is too small ( in total) for the algorithms to make any difference. We remark that fewer rounds implies a shorter waiting time for synchronization in the parallel learning setting and a smaller communication cost in the distributed learning setting.


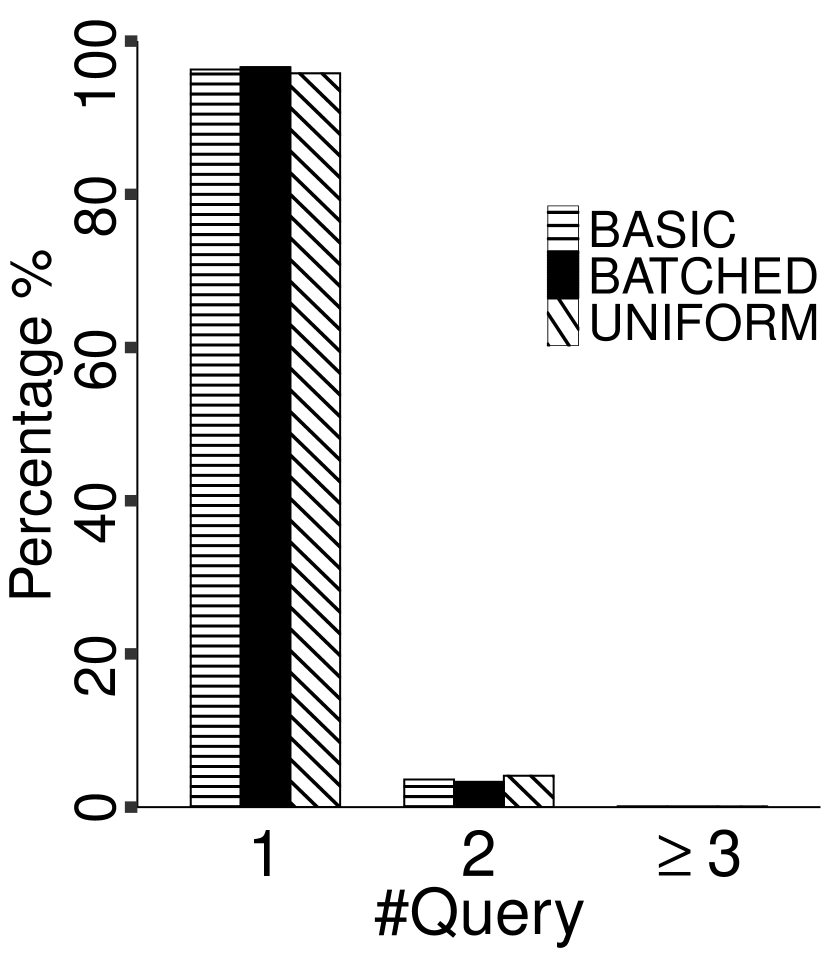
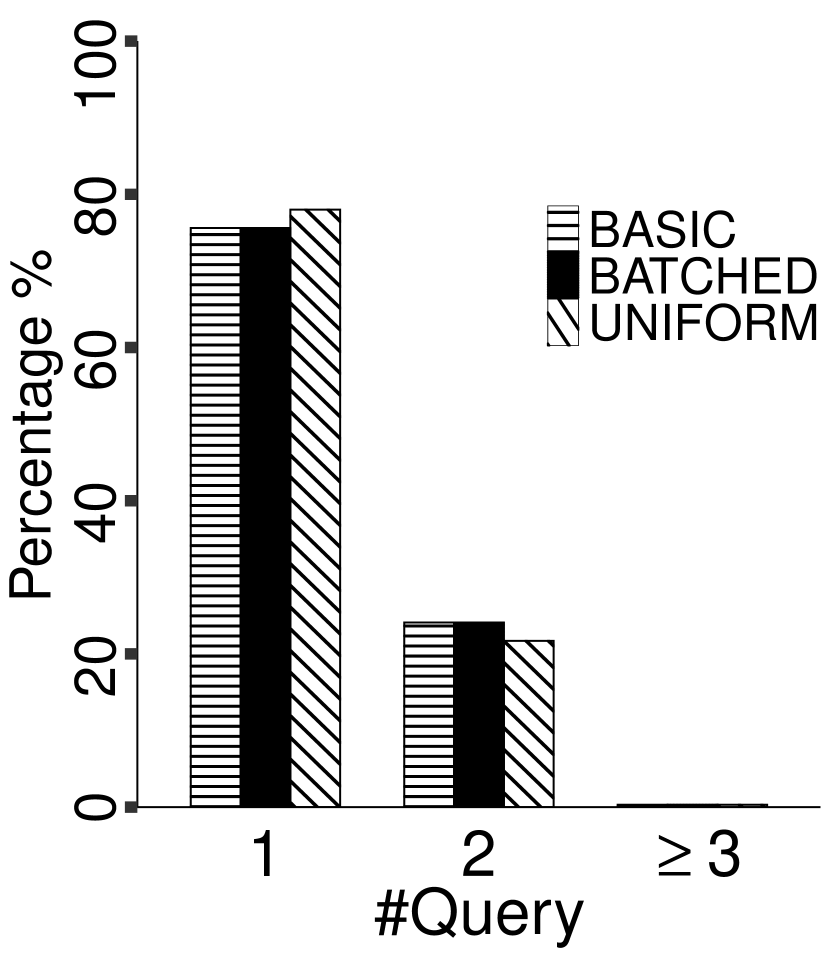
Classification Using Approximate Centers. We now measure the quality of the approximate centers outputted by our algorithms for point classification using Heuristic 1. That is, after the algorithm terminates and outputs the set of approximate centers, we try to cluster new (unclassified) points using Heuristic 1 and count the number of same-cluster queries used for each new point. Since there is only a very small number of points in the dataset that have been sampled/classified during the run of Basic and Batched, we simply use the whole dataset as test points. This should not introduce much bias to our measurement.
Our results for the synthetic and the real-world datasets are plotted in Figures 7 and 8, respectively. We observe that for all three tested algorithms, for the majority of the points in the dataset, only one same-cluster query is needed for classification; in other words, we only need to find their nearest approximate centers for determining their cluster labels. Except for the Shuttle dataset for which about 10-15% points need at least three same-cluster queries, in all other datasets the fraction of points which need at least three queries is negligible. Overall, the performance of the three tested algorithms is comparable.


Shuttle

Kdd
Summary. Briefly summarizing our experimental results, we observe that both Basic and Batched significantly outperform Uniform in terms of query complexities. All three algorithms have similar center approximation quality. Batched outperforms Basic by a large margin in both running time and round usage on the synthetic and Kdd datasets.
Acknowledgments
The authors would also like to thank the anonymous referees for their valuable comments and helpful suggestions. Yan Song and Qin Zhang are supported in part by NSF IIS-1633215 and CCF-1844234.
References
- (1)
- Ailon et al. (2018a) Nir Ailon, Anup Bhattacharya, and Ragesh Jaiswal. 2018a. Approximate Correlation Clustering Using Same-Cluster Queries. In LATIN. 14–27.
- Ailon et al. (2018b) Nir Ailon, Anup Bhattacharya, Ragesh Jaiswal, and Amit Kumar. 2018b. Approximate Clustering with Same-Cluster Queries. In ITCS. 40:1–40:21.
- Arthur and Vassilvitskii (2007) David Arthur and Sergei Vassilvitskii. 2007. k-means++: the advantages of careful seeding. In SODA. 1027–1035.
- Ashtiani et al. (2016) Hassan Ashtiani, Shrinu Kushagra, and Shai Ben-David. 2016. Clustering with Same-Cluster Queries. In NIPS. 3216–3224.
- Bressan et al. (2020) Marco Bressan, Nicolò Cesa-Bianchi, Silvio Lattanzi, and Andrea Paudice. 2020. Exact Recovery of Mangled Clusters with Same-Cluster Queries. In Advances in Neural Information Processing Systems 33: Annual Conference on Neural Information Processing Systems 2020, NeurIPS 2020, December 6-12, 2020, virtual, Hugo Larochelle, Marc’Aurelio Ranzato, Raia Hadsell, Maria-Florina Balcan, and Hsuan-Tien Lin (Eds.).
- Chien et al. (2018) I (Eli) Chien, Chao Pan, and Olgica Milenkovic. 2018. Query K-means Clustering and the Double Dixie Cup Problem. In NeurIPS. 6650–6659.
- Firmani et al. (2016) Donatella Firmani, Barna Saha, and Divesh Srivastava. 2016. Online Entity Resolution Using an Oracle. PVLDB 9, 5 (2016), 384–395.
- Gamlath et al. (2018) Buddhima Gamlath, Sangxia Huang, and Ola Svensson. 2018. Semi-Supervised Algorithms for Approximately Optimal and Accurate Clustering. In ICALP. 57:1–57:14.
- Huleihel et al. (2019) Wasim Huleihel, Arya Mazumdar, Muriel Médard, and Soumyabrata Pal. 2019. Same-Cluster Querying for Overlapping Clusters. In NeurIPS. 10485–10495.
- Inaba et al. (1994) Mary Inaba, Naoki Katoh, and Hiroshi Imai. 1994. Applications of Weighted Voronoi Diagrams and Randomization to Variance-Based k-Clustering (Extended Abstract). In SOCG. 332–339.
- Jaiswal et al. (2014) Ragesh Jaiswal, Amit Kumar, and Sandeep Sen. 2014. A Simple -Sampling Based PTAS for -Means and Other Clustering Problems. Algorithmica 70, 1 (2014), 22–46.
- Kumar et al. (2010) Amit Kumar, Yogish Sabharwal, and Sandeep Sen. 2010. Linear-time approximation schemes for clustering problems in any dimensions. J. ACM 57, 2 (2010), 5:1–5:32.
- Mazumdar and Saha (2017a) Arya Mazumdar and Barna Saha. 2017a. Clustering with Noisy Queries. In NIPS. 5788–5799.
- Mazumdar and Saha (2017b) Arya Mazumdar and Barna Saha. 2017b. Query Complexity of Clustering with Side Information. In NIPS. 4682–4693.
- Saha and Subramanian (2019) Barna Saha and Sanjay Subramanian. 2019. Correlation Clustering with Same-Cluster Queries Bounded by Optimal Cost. In ESA. 81:1–81:17.
- Verroios and Garcia-Molina (2015) Vasilis Verroios and Hector Garcia-Molina. 2015. Entity Resolution with crowd errors. In ICDE. 219–230.
- Vesdapunt et al. (2014) Norases Vesdapunt, Kedar Bellare, and Nilesh N. Dalvi. 2014. Crowdsourcing Algorithms for Entity Resolution. PVLDB 7, 12 (2014), 1071–1082.
- Wang et al. (2012) Jiannan Wang, Tim Kraska, Michael J. Franklin, and Jianhua Feng. 2012. CrowdER: Crowdsourcing Entity Resolution. PVLDB 5, 11 (2012), 1483–1494.
- Wang et al. (2013) Jiannan Wang, Guoliang Li, Tim Kraska, Michael J. Franklin, and Jianhua Feng. 2013. Leveraging transitive relations for crowdsourced joins. In SIGMOD. 229–240.
Appendix A Supplementary Preliminaries
The following forms of Chernoff bounds will be used repeatedly in the analysis of our algorithms.
Lemma 1 (Additive Chernoff).
Let be i.i.d. Bernoulli random variables such that . Let . Then .
Lemma 2 (Multiplicative Chernoff).
Let be i.i.d. Bernoulli random variables such that . Let . Then for , it holds that .
Appendix B Omitted Proofs in Section 3
We need two lemmata from (Ailon et al., 2018b).
Lemma 1 ((Ailon et al., 2018b)).
It holds that
Lemma 2 ((Ailon et al., 2018b)).
It holds that
and
B.1. Proof of Lemma 1
Proof.
We adapt the proof of Lemma 15 in (Ailon et al., 2018b) to our irreducibility assumption. Observe that
Splitting the sum on the left-hand side into and ,
and so
Comparing with the true centers, we have
By the -irreducibility assumption, there exists an such that
and so we have a contradiction. The claimed result in the lemma therefore holds. ∎
B.2. Proof of Lemma 2
Proof.
By Lemma 1, the probability that no undiscovered clusters is seen among samples (Line 6) with probability
The maintenance of the loop invariant (3.1) in each round is a corollary of Lemma 1. With (see Line 22), the centroid estimate satisfies (3.1) with probability at least .
Taking a union bound over all rounds, the total failure probability is at most
B.3. Proof of Lemma 3
Proof.
Upon the termination of the while loop in Phase 2, let denote the number of samples belonging to the clusters in . We claim that with probability at least . Observe that at this point, then it follows from a Chernoff bound (Lemma 2) that
We choose to be the newly discovered cluster of most samples and so . If , then by a Chernoff bound (Lemma 1),
B.4. Proof of Lemma 4
B.5. Proof of Lemma 5
Proof.
Let . The rejection sampling has a valid probability threshold (at most ) by the second part of Lemma 2. The rejection sampling includes a sampled point in with probability
where the first inequality uses Lemma 1 to lower bound the last factor.
Hence, by sampling points in total, we expect to see at least points returned by the rejection sampling procedure. Using the multiplicative Chernoff bound (Lemma 2), the rejection sampling returns at most points with probability at most
B.6. Proof of Theorem 6
Proof.
In each round, by Lemmata 3, 4 and 5, Phases 2–4 fails with probability at most . Combining with Lemma 2 and summing over all rounds, we see that the overall failure probability is at most
Let denote the number of newly discovered clusters in the -th round. There are rounds in total and the total number of samples is therefore
where we used the fact that . For each sample we need to call the same-cluster query times to obtain the its cluster index, and thus the query complexity is . ∎
Appendix C Omitted Proofs in Section 4
C.1. Proof of Lemma 1
Proof.
As argued in the proof of Lemma 2, the probability that no undiscovered clusters is seen among samples (see Line 8 in Algorithm 4.1) with probability .
Regarding the maintenance of the loop invariant (3.1), with (see Line 22 in Algorithm 4.1), each centroid estimate satisfies (3.1) with probability at least . Taking a union bound, we know that (3.1) holds for all in each single round with probability at least .
Let denote the number of newly recovered clusters in the -th round, then . Taking a union bound over all rounds as in Lemma 2, we see that the failure probability is at most
C.2. Proof of Lemma 2
Proof.
Let denote the number of samples belonging to the clusters in . We claim that upon the termination of the while loop in Phase 2, it holds that with probability at least . Observe that at this point, then it follows from a Chernoff bound (Lemma 2) that
Observe that every cluster in a heavy band satisfies that
If , then by a Chernoff bound (Lemma 1),
Taking a union bound over all clusters yields the claimed result. ∎
C.3. Proof of Lemma 3
C.4. Proof of Lemma 4
Proof.
Let . The rejection sampling is a valid probability threshold (at most ) by the second part of Lemma 2. The rejection sampling includes a sampled point in with probability
Let . By sampling points, for each , it follows from the multiplicative Chernoff bound (Lemma 2) that the rejection sampling returns at least points (see Line 30 in Algorithm 4.1) with probability at most
Taking a union bound over all yields the claimed result. ∎
C.5. Proof of Theorem 5
Proof.
Consider the inner repeat-until loop for a fixed value of . Let denote the number of newly recovered clusters in the -th round, then .
The overall failure probability is similar to that in the proof of Theorem 6, and can be upper bounded by
and the total number of samples is
Since there are repetitions and the number of samples is dominated by that in the last repetition, the total number of samples is . For each sample we need to call the same-cluster query times to obtain the its cluster index, and thus the query complexity is . ∎
Appendix D Noisy Oracles
| then |
| then |
| belongs to the same cluster | |
| as the majority points in | then |
In this section we consider the noisy same-cluster oracle which errs with a constant probability . We assume that the same-cluster oracle returns the same answer on repetition for the same pair of points. The immediate consequence is that the Classify function needs to be amended as we cannot keep one representative point from each cluster but have to keep a set of points from cluster to tolerate oracle error. We present the substitute for Classify, called CheckCluster, in Algorithm D.2. The following is the guarantee of the CheckCluster algorithm.
Lemma 1.
Suppose that and for some absolute constants and . There exists a constant such that when for all , all calls to the CheckCluster function is correct with probability at least .
Proof.
By a Chernoff bound (2), the algorithm yields the correct behaviour w.r.t. each cluster with probability at least . Taking a union bound over all and calls yields the overall failure probability at most , provided is large enough. Then we let . ∎
In order to obtain the representative samples from each set, we deploy a reduction to the stochastic block model. This model considers a graph of nodes, which is partitioned as . An edge is added between two nodes belonging to the same partition with probability at least and between two nodes in different partitions with probability at most . It is known how to find the (large) clusters in this model.
Lemma 2 ((Mazumdar and Saha, 2017a)).
There exists a polynomial time algorithm that, given an instance of a stochastic block model on nodes, retrieves all clusters of size using queries with probability .
Our main theorem about the noisy same-cluster oracle is the following. We do not attempt to optimize the number of same-cluster queries.
Theorem 3.
Proof.
The analysis is similar to that of the improved algorithm (Algorithm 4.1) and we shall only highlight the changes. For now let us assume that all CheckCluster calls return correct results (we shall verify this at the end of the proof).
The analysis of Phases 1 and 4 remains the same as the analysis for the improved algorithm (Algorithm 4.1).
In Phase 2, all clusters satisfy and hence each such cluster receives in expectation at least sampled points. We require (by Lemma 2), which leads to . By a Chernoff bound, we see that samples suffices to guarantee the correctness. However, we are unable to know the number of newly discovered clusters when we are taking samples. Hence we guess over the powers of sequentially and stop when we obtain more than new clusters of size at least . For each guess of , the number of same-cluster queries is . There can be at most guesses and thus the number of queries in this phase is .
In Phase 3, we would need each cluster to see in expectation samples. This is automatically achieved by the number of samples in the analysis above for Phase 2, with an appropriate adjustment of constants.
For each fixed value of , the number of calls to CheckCluster is and Lemma 1 applies, verifying our earlier claim that all calls to CheckCluster are correct.
For each fixed value of , in each round, Phase 2 uses oracle calls (Lemma 2) and there are rounds; each call to Algorithm D.2 CheckCluster uses oracle calls and there are calls to CheckCluster. Hence the total number of oracle calls for each fixed value of is .
Overall there are guesses for the value of , the overall number of oracle calls is . ∎
| and | then |
Appendix E Omitted Tables of Experiment Results
| #Queries | Algo. | 1.0E4 | 2.5E4 | 5.0E4 | 7.5E4 | 1.0E5 | 1.2E5 | 1.5E5 | 1.75E5 | 2.0E5 |
|---|---|---|---|---|---|---|---|---|---|---|
| Basic | 16.96 | 24.88 | 36.95 | 43.51 | 49.34 | 54.53 | 60.47 | 64.62 | 68.25 | |
| Batched | 17.45 | 26.00 | 37.98 | 45.56 | 51.92 | 56.56 | 62.85 | 66.59 | 70.68 | |
| Uniform | 12.97 | 19.30 | 25.75 | 30.73 | 34.77 | 37.59 | 41.62 | 44.48 | 48.01 | |
| Basic | 17.78 | 25.10 | 33.90 | 40.52 | 46.93 | 51.14 | 56.66 | 60.84 | 65.05 | |
| Batched | 18.31 | 25.85 | 35.27 | 43.28 | 49.60 | 53.78 | 59.14 | 63.50 | 68.55 | |
| Uniform | 13.11 | 19.40 | 25.88 | 30.63 | 34.73 | 37.68 | 41.73 | 44.41 | 47.54 | |
| Basic | 17.26 | 26.38 | 33.73 | 40.22 | 45.62 | 49.03 | 54.09 | 57.94 | 60.65 | |
| Batched | 17.91 | 27.59 | 35.44 | 42.56 | 47.74 | 51.53 | 56.56 | 60.04 | 62.99 | |
| Uniform | 13.17 | 19.26 | 25.95 | 31.17 | 34.77 | 38.11 | 41.72 | 45.04 | 47.87 |
| #Clusters | Algo. | 20 | 30 | 40 | 50 | 60 | 70 |
|---|---|---|---|---|---|---|---|
| Basic | 789.57 | 1128.73 | 1459.13 | 1978.24 | 2416.48 | 2997.13 | |
| Batched | 722.21 | 1050.19 | 1363.88 | 1846.77 | 2316.00 | 2845.01 | |
| Uniform | 1275.11 | 2260.90 | 3359.38 | 4338.60 | 5237.93 | 6261.74 | |
| Basic | 618.83 | 1233.11 | 1787.45 | 2262.58 | 2778.48 | 3235.86 | |
| Batched | 615.86 | 1160.61 | 1625.75 | 2053.64 | 2596.92 | 3059.33 | |
| Uniform | 1284.39 | 2297.05 | 3336.56 | 4366.22 | 5265.16 | 6187.66 | |
| Basic | 678.37 | 1109.64 | 1803.80 | 2438.27 | 3198.09 | 4447.11 | |
| Batched | 630.94 | 1056.14 | 1664.32 | 2269.10 | 2954.42 | 4089.53 | |
| Uniform | 1264.46 | 2201.10 | 3317.04 | 4307.54 | 5239.21 | 6074.59 |
| #Queries | Basic | Batched | Uniform |
|---|---|---|---|
| 5.00E+03 | 8.33 | 8.89 | 5.03 |
| 2.00E+04 | 13.08 | 13.65 | 6.54 |
| 4.00E+04 | 16.54 | 17.05 | 8.21 |
| 6.00E+04 | 17.20 | 17.64 | 9.23 |
| 8.00E+04 | 17.50 | 18.07 | 9.79 |
| 1.00E+05 | 17.80 | 18.25 | 9.95 |
Fixed-budget
| #Clusters | Basic | Batched | Uniform |
|---|---|---|---|
| 6 | 210.68 | 192.10 | 986.56 |
| 8 | 420.47 | 351.37 | 3624.32 |
| 10 | 861.65 | 747.29 | 6694.91 |
| 12 | 1252.59 | 996.43 | 79672.90 |
| 14 | 1838.29 | 1475.32 | 142161.65 |
| 16 | 2484.36 | 1901.43 | 201012.82 |
Fixed-recovery
| #Queries | Basic | Batched | Uniform |
|---|---|---|---|
| 1.00E+03 | 3.22 | 3.22 | 3.00 |
| 5.00E+03 | 4.89 | 4.92 | 3.51 |
| 1.00E+04 | 5.48 | 5.55 | 4.06 |
| 2.00E+04 | 6.14 | 6.31 | 4.83 |
| 3.00E+04 | 6.55 | 6.61 | 5.13 |
Fixed-budget
| #Clusters | Basic | Batched | Uniform |
|---|---|---|---|
| 3 | 86.03 | 86.65 | 79.10 |
| 4 | 443.60 | 435.29 | 1233.67 |
| 5 | 725.46 | 711.47 | 3154.66 |
| 6 | 2053.65 | 2036.89 | 6988.62 |
| 7 | 4050.22 | 4050.03 | 7799.98 |
Fixed-recovery