Learning Contrastive Feature Representations for Facial Action Unit Detection
Abstract
For the Facial Action Unit (AU) detection task, accurately capturing the subtle facial differences between distinct AUs is essential for reliable detection. Additionally, AU detection faces challenges from class imbalance and the presence of noisy or false labels, which undermine detection accuracy. In this paper, we introduce a novel contrastive learning framework aimed for AU detection that incorporates both self-supervised and supervised signals, thereby enhancing the learning of discriminative features for accurate AU detection. To tackle the class imbalance issue, we employ a negative sample re-weighting strategy that adjusts the step size of updating parameters for minority and majority class samples. Moreover, to address the challenges posed by noisy and false AU labels, we employ a sampling technique that encompasses three distinct types of positive sample pairs. This enables us to inject self-supervised signals into the supervised signal, effectively mitigating the adverse effects of noisy labels. Our experimental assessments, conducted on five widely-utilized benchmark datasets (BP4D, DISFA, BP4D+, GFT and Aff-Wild2), underscore the superior performance of our approach compared to state-of-the-art methods of AU detection. Our code is available at https://github.com/Ziqiao-Shang/AUNCE.
keywords:
Facial action unit detection , Contrastive learning , Positive sample sampling , Importance re-weighting strategy1 Introduction
Facial Action Coding System (FACS) [1] is a widely employed approach for facial expression coding, which introduced a set of 44 facial action units (AUs) that establish a link between facial muscle movements and facial expressions [2]. AU detection is a multi-label binary classification problem. Each AU represents a kind of label, and activated and inactivated AUs are respectively labeled 1 and 0. Nowadays, AU detection [3, 4] has emerged as a computer vision technique to automatically identify AUs in videos or images. This advancement holds promise for diverse applications, including human-computer interaction, emotion analysis, car driving monitoring et al.
In recent years, supervised frameworks for AU detection have predominantly relied on binary cross-entropy loss to align predicted and ground truth labels [5, 6, 7]. While this approach is common, it often places unnecessary emphasis on strict label alignment, increasing the risk of overfitting by demanding excessive model capacity. Additionally, these methods tend to focus on encoding pixel-level facial features, overlooking the fact that capturing subtle differences in different AUs’ activation is sufficient. As a result, such approaches unnecessarily increase model complexity, limiting the generalization ability of the model.

As a result, representation learning approaches based on discriminative contrastive learning have emerged and shown significant potential [8] for classification tasks. As shown in Fig. 1, this approach aims to maximize the consistency of positive samples that are semantically similar while minimizing the consistency of negative samples that are semantically dissimilar. By optimizing the contrastive loss, the mutual information between variables is either explicitly or implicitly optimized [9]. However, the direct integration of contrastive learning into AU detection encounters two principal challenges. The first challenge is the class imbalance issue of each AU type [10]. Most AU classes manifest a substantial imbalance between majority and minority class samples, with inactivated AUs vastly outnumbering their activated counterparts. This imbalance issue influences the classification decision threshold, potentially resulting in the direct classification of the majority of AUs as the negative class. The second challenge pertains to the noisy and false label problem [11]. Due to the subtle feature differences when AUs activate leading to the inherent difficulty in expertly labeling AUs, existing AU datasets may exhibit a few noisy and false labels, significantly undermining the overall fitting ability of models.
To address these challenges, we propose a discriminative contrastive learning framework inspired by self-supervised learning techniques for learning highly semantic image representations [8]. This framework encodes differential information between AUs from each sample pair, offering an alternative to the traditional pixel-level feature learning methods commonly employed in AU detection. The resulting loss, termed AUNCE, is conceptually similar to the widely used InfoNCE loss. Moreover, to tackle the class imbalance issue in AU detection, we adopt a negative sample re-weighting strategy inspired by [7]. This strategy addresses class imbalance by assigning varying levels of importance to individual samples during training, achieved by adjusting the weights of their loss contributions. Additionally, to mitigate the effects of noisy and false AU labels, inspired by the sample-mixing concept proposed in [12], we introduce a positive sample sampling strategy. This strategy enhances supervision signals by incorporating self-supervised signals, achieved by defining sampling ratios for different types of positive sample pairs. This ensures that more robust positive samples are derived through data augmentation combined with self-supervised signal. The primary contributions of our work are summarized as follows:
-
1.
We propose a discriminative contrastive learning framework that encodes differential information between AUs from each sample pair, and the resulting loss is named AUNCE.
-
2.
We adopt a negative sample re-weighting strategy to tackle the class imbalance issue of each AU type.
-
3.
We introduce a positive sample samplying strategy to mitigate the effects of noisy and false AU labels.
-
4.
We validate the effectiveness of AUNCE by comparing it to state-of-the-art approaches for AU detection on five widely-used datasets, namely BP4D, DISFA, BP4D+, GFT and Aff-Wild2.
2 Related Work
We provide a comprehensive overview of two areas closely connected to our research: discriminative contrastive learning and contrastive learning for AU detection.
2.1 Discriminative contrastive learning
Contrastive learning [9] originated in self-supervised learning, where tasks are assigned to agents by applying various augmentations to the same image and evaluating feature similarity. The goal is to maximize similarity between features of the same image while minimizing it between different images. Over time, contrastive learning has expanded to supervised and semi-supervised settings, leveraging labeled data to refine feature representations.
In recent years, discriminative contrastive learning, a subset of deep self-supervised learning methods [13, 14], has witnessed substantial progress. This approach follows a learn-to-compare paradigm, distinguishing between similar (positive) and dissimilar (negative) data points in a feature space. For instance, Oord et al.[9] introduced the InfoNCE loss to optimize feature extraction by maximizing consistency in sequence data, establishing a foundation for contrastive methods. Chen et al.[13] proposed SimCLR, which uses a base encoder and projection head to maximize agreement through InfoNCE. Similarly, MoCo [14] leverages a momentum network to maintain a queue of negative samples for efficient learning. Chen and He [15] addressed collapsing solutions by avoiding negative pairs via a stop-gradient operation. While variations in representation encoders and similarity measures exist, the core principle remains: training a representation encoder by contrasting similar pairs () against dissimilar pairs () to optimize the contrastive loss.
Apart from that, deep contrastive learning not only facilitates the automated extraction of refined feature representations through the comparison of positive and negative sample pairs but also incorporates diverse contrastive losses for optimization. Khosla et al. [16] extended the contrastive learning concept to supervised settings with a supervised contrastive learning loss, aiming to enhance feature expression using labeled data. Additionally, Chen et al. [17] proposed a semi-supervised contrastive learning algorithm, initially pretraining all data through contrastive learning and subsequently transferring knowledge to new models via distillation learning with the aid of labeled data.
In discriminative contrastive learning, the construction of positive sample pairs has evolved. For labeled or partially labeled data, positive pairs can be formed using images from the same category, increasing pair diversity and enhancing feature representation. Contrastive learning also supports supervised learning by enabling pretraining that boosts downstream performance. However, applying an InfoNCE-based contrastive learning framework to AU detection still faces many significant challenges, including class imbalance, noisy annotations, and the difficulty of distinguishing hard negatives.
2.2 Contrastive learning for AU detection
Contrastive learning was firstly designed as a pretext task for unsupervised or self-supervised learning and was introduced to the domain of AU detection with limited annotations [18, 19, 20]. For example, Niu et al. [18] introduced a semi-supervised co-training approach that utilized contrastive loss to enforce conditional independence between facial representations generated by two Deep Neural Networks (DNNs). Following this, Zhang et al. [19] introduced a weakly-supervised contrastive learning approach that effectively utilizes coarse-grained activity information. Additionally, Liu et al. [20] introduced a semi-supervised contrastive learning strategy that concurrently combined region learning, contrastive learning, and pseudo-labeling.
Subsequent research endeavors extended contrastive learning to supervised settings, aiming at enhancing feature representation for AU detection through the utilization of labeled data [21, 22]. Chang et al. [21] present a knowledge-driven representation learning framework aimed for AU detection, incorporating a contrastive learning module that leverages dissimilarities among facial regions to effectively train the feature encoder. In a similar vein, Suresh et al. [22] proposed a feature-based positive matching contrastive loss, which facilitates learning distances between positives based on the similarity of corresponding AU embeddings.
However, previous methods primarily employed a combination of weighted cross-entropy loss and triplet loss to constrain the training process, encoding pixel-level information of the entire face associated with AUs. This results in significant redundant information that may dilute the discriminative signals necessary for accurate AU detection. To address this, Sun et al.[23] proposed EmoCo, an unsupervised discriminative contrastive learning framework that uses emotion-based image pairs for AU detection. While EmoCo improves AU detection, it faces challenges due to conflicting AU labels in emotion-based pairs, leading to false positives and false negatives, and its reliance on emotion annotations limits its applicability to datasets with only AU labels. Similarly, Li et al.[11] introduced a self-supervised discriminative contrastive learning approach using the MoCo framework [14] for dynamic AU detection in video datasets. However, this method is limited to dynamic AU detection and cannot be directly applied to static image datasets without temporal information.
In summary, while these approaches have significantly advanced the field of AU detection, each is confronted with unique challenges, including the encoding of redundant pixel-level information, reliance on emotion annotations, and limitations in handling static image datasets. Furthermore, there is currently no effective solution for applying discriminative contrastive learning methods to static image datasets that contain only AU annotations. This gap underscores the need for more adaptable and efficient strategies in AU detection.

(a) The first stage of our framework: pretraining

(b) The second stage of our framework: linear evaluation
3 Method
3.1 Objectives
In this study, we confront three main challenges: 1. How to design a novel framework that guides the encoder to focus on the differential information between AUs from each sample pair [23], going beyond traditional methods reliant on pixel-level facial features, 2. How to tackle the class imbalance issue across different AU types [10] to improve the overall accuracy of our framework. 3. How to handle noisy and false labels [11] to increase the model’s robustness against misannotations.
To address these challenges, Section 3 provides detailed solutions. In Section 3.2, we propose a discriminative contrastive learning framework that directs the encoder to capture differential features between AUs from each sample pair, thus moving away from conventional pixel-level feature learning. To combat the class imbalance issue, Section 3.3 introduces a negative sample re-weighting strategy, drawing inspiration from, which prioritizes underrepresented AUs and facilitates the detection of challenging samples. Besides, Section 3.4 presents a positive sample sampling strategy that incorporates augmented supervision signals, which helps the model effectively learn from noisy and false data. Finally, Section 3.5 will introduce the encoder structure we used in our framework.
3.2 Discriminative contrastive learning framework
For the task of AU detection, which falls under the category of multi-label binary classification, the prevalent approach for training models has been the utilization of cross-entropy loss. This loss measures the disparity between predicted labels and ground truth labels. However, there exists variability in the occurrence rates of different AUs, with some AUs exhibiting low occurrence rates while others display high occurrence rates. Consequently, in contrast to the conventional cross-entropy loss, we employ a weighted cross-entropy loss [6] denoted as
| (1) |
where denotes the ground truth value of occurrence (i.e., 0 or 1) of the -th AU, and is the corresponding predicted occurrence probability. This loss effectively guides the training process, encouraging the model to allocate higher probabilities to the correct class labels and lower probabilities to incorrect ones. = is the weight of the -th AU determined by its occurrence frequency for balanced training. It permits reducing the impact of loss values associated with those AUs that are more commonly activated in the training set. represents the occurrence frequency of the -th AU, and is the total number of AUs.
Though cross-entropy loss is widely used and effective, it has limitations in tasks with class imbalance, complex data distributions, or fine-grained distinctions [24]. It can lead to overfitting and poor generalization, particularly without regularization or techniques like label smoothing. In AU detection, where subtle inter-class differences are critical, cross-entropy loss may restrict the model’s ability to generalize to unseen data. Additionally, the requirement for predicted outputs to satisfy specific conditions for each AU imposes a significant burden on the encoder’s learning capacity.
To address this challenge, we introduce a discriminative contrastive learning framework for AU detection. As shown in Fig. 2, the training process of our framework consists of two stages: pretraining and linear evaluation. During the pretraining stage shown in Fig. 2(a), our framework includes not only the feature encoder but also a positive sample mining module and a negative sample re-weighting module, which together assist the training process of the encoder. The former integrates self-supervised signals with supervised signals to address the issue of noisy labels arising from subtle differences in AUs. The latter is introduced to tackle challenges related to class imbalance and hard negative sample mining. Detailed discussions of these two modules are provided in Sections 3.3 and 3.4, respectively.
The input to the encoder consists of an anchor point , a positive sample that belongs to the same class as , and negative samples from different classes within the same batch. These samples are passed through a shared encoder to extract feature representations. Finally, the encoder parameters are optimized using a novel contrastive loss, referred to as AUNCE, which is defined as follows:
| (2) | ||||
where serves as an encoder, mapping the features to a dimensional vector, represents the feature representation of a specific AU. represents the inner product similarity between two tensors. Specifically, given two tensors and , is computed as their dot product, defined by . measures the similarity between and its positive example , while measures the similarity between the sample and its negative example. The term represents the data distribution, and respectively denote the class conditional distribution of positive and negative samples of . Inspired by Eq (1), we introduce in Eq (2) to mitigate the influence of loss values related to commonly activated AUs in the training set. Additionally, we incorporate to re-weight the significance of each negative sample.
The adoption of over during the pretraining phase is motivated by several key considerations: 1. The weighted cross-entropy loss is computed based on the sample and its corresponding label , requiring the encoding of pixel-level information in order to align with the label. In contrast, the contrastive loss does not involve explicit labels but is computed based on the feature difference values between each pair of samples. This incentivizes the encoder to capture the differential information between AUs from each sample pair, without the need to focus on pixel-level information extraction of individual samples, reducing the borden of encoder. 2. The weighted cross-entropy loss imposes constraints on the absolute values of the predicted probabilities. However, for classification tasks, this is often unnecessary and can lead to overfitting as well as demanding higher fitting capability from the encoder. The contrastive loss focuses on constraining the similarity difference between positive and negative sample pairs without explicitly specifying their exact values. This is because the minimal value of is 0, which is achieved when for all negative sample index .
In evaluating the representations obtained from the pretraining process, we adhere to the established linear evaluation protocol, as commonly employed in previous studies [9, 13]. As illustrated in Fig. 2(b), a linear classifier is trained atop the encoder with fixed parameters, utilizing during the training phase. It is important to note, however, that this linear classifier consists of a simple fully connected layer and serves primarily for performance evaluation rather than significantly impacting the feature learning process. Therefore, the model’s core capability is largely determined by the effectiveness of AUNCE in guiding the feature extraction.
3.3 Negative sample re-weighting strategy
To address the second challenge posed by class imbalance, we implement a negative sample re-weighting strategy specifically targeting the anchor data points. This also contributes to hard negative sample mining. Inspired by HCL [25], we apply the following weighting scheme to each negative sample :
| (3) |
where can be viewed as the importance weight if we assume that the negative samples follow a von Mises-Fisher (vMF) distribution. The resulting AUNCE loss is:
| (4) | ||||
Next, we analyze how this weighting scheme addresses the class imbalance issue and facilitates the mining of hard negative samples. Without loss of generality, we consider the similarity calculation as , where is the temperature coefficient. The inclusion of importance weights transforms the gradient of w.r.t similarity scores of positive pairs into the following form:
| (5) |
where , and the gradient of similarity scores of negative pairs w.r.t is
| (6) |
Therefore, the ratio between the gradient magnitude of negative examples and positive examples is given by:
| (7) |
Eq. 7 follows the Boltzmann distribution. As the value of increases, the entropy of the distribution decreases significantly, leading to a sharper distribution in the region of high similarity. This has two consequences: 1. It imposes larger penalties on hard negative samples that are in close proximity to the anchor data point, enabling the model to learn more precise decision boundaries from subtle feature differences when AUs activate. 2. It controls the relative contribution of negative samples to the parameter updates, providing a means to address class imbalance issues.
The key difference between our weighting method and HCL [25] lies in the absence of mean normalization in Eq. (3), allowing for more effective handling of class imbalance in AU detection. Specifically, when the anchor sample belongs to the majority class, its positive samples (majority class) receive smaller gradient magnitudes to limit parameter updates, while its negative samples (minority class) receive larger gradient magnitudes to emphasize their impact. To achieve this, we set , increasing the influence of updates caused by minority class samples. Conversely, when belongs to the minority class, we set , reducing the influence of majority class samples. By tuning , we control the relative importance of positive and negative samples, ensuring the model focuses appropriately on minority class samples and balances gradient magnitudes. Including the mean as a normalization factor would undermine this control, as changes in would simultaneously affect the mean, leading to unpredictable weight adjustments. Thus, the omission of mean normalization in Eq. (3) is a deliberate choice to address class imbalance, differentiating our approach from HCL.
3.4 Positive sample samplying strategy
For a given anchor point, samples sharing the same label with the anchor are referred to as positive examples. Among them, positive examples whose ground truth labels do not match the anchor’s label are termed as false positives, primarily stemming from label noise in the samples. Regarding the third challenge of AU labels tainted by noise and errors, we employ a combined approach that integrates label noisy learning and self-supervised learning techniques to obtain enhanced supervised signals for positive samples. As shown in Fig. 3, this approach mitigates the adverse effects of noisy labels by simultaneously introducing a controlled level of self-supervised signal and supervised signal, thereby enhancing the robustness of model to variations and errors present in the labeled dataset.

3.4.1 Supervised Signal
One common technique to address the issue of false data is label smoothing, where a small amount of uncertainty is incorporated into the training process by replacing one-hot labels with smoothed probability distributions. However, it is challenging to directly apply label smoothing to contrastive learning as the computation of contrastive loss does not involve explicit labels. To overcome this challenge, we turn to the memory effect of neural networks. Previous research has shown that neural networks tend to first fit clean samples and then memorize the noise in incorrectly labeled samples. This memory effect is independent of the choice of neural network architecture. The positive samples that are easier fit are those that are closer to the anchor point and have higher similarity. Inspired by this observation, for a given sample and M positive samples with noisy labels belonging to the same class, we calculate the similarity scores between the representation of sample and the representations of all M positive samples. We then select the positive feature representation with the highest similarity to sample :
| (8) |
By selecting the positive samples with the highest similarity, we prioritize clean and reliable positive samples while minimizing the influence of noisy positive samples during the training process.
3.4.2 Self-supervised Signal
In addition to label noisy learning, we incorporate self-supervised learning techniques into the training process. By designing these auxiliary tasks carefully, we can encourage the model to learn more robust and invariant representations, which can help mitigate the effects of label noise and improve generalization performance. Specifically, our second method to obtain positive feature involves performing semantically invariant image augmentation on the anchor point :
| (9) |
where is a stochastic data augmentation module that applies random transformations to a given data example , generating two correlated views referred to as and , which we consider as a positive pair. Follow SimCLR [13], we employ a sequential application of three simple augmentations: random cropping and flipping followed by resizing back to original size, random color distortions, and random Gaussian blur.
Our third method to obtain positive examples involving a mixture of positive feature representations, which can be seen as a mixup of positive samples to obtain the most representative positive instances:
| (10) |
The primary distinction from data augmentation approaches exemplified by SimCLR lies in the nature of positive examples. In SimCLR, positive examples are augmented versions of the anchor point, implying that two views of the same sample are defined as positives, with each sample representing a unique class, leading to instance-level contrast. Under such circumstances, positive examples do not fully encapsulate the general class information. In contrast, the proposed method defines positive examples as the mean of the same-class samples that are identical to the anchor point, essentially representing the most representative features fo positive samples, which can be interpreted as class prototypes. Compared to instance-level contrast, the feature representations of class prototypes offer more robust information for comparison, thereby better capturing class information. The positive feature representation obtained from Eq. (10) represents the class centroid of M positive examples . In other words, it synthesizes a virtual representative positive sample.
The aforementioned three methods of obtaining positive examples combine the use of label noisy learning for supervised signals and data augmentation for self-supervised signals. These three types of positive examples are randomly mixed with probabilities , , and respectively, where . Our approach aims to improve the quality of supervised signals utilized in the training process. By integrating these techniques, we effectively mitigate the impact of noisy and false labels, increase the resilience of models to errors and variations in labeled datasets, and ultimately enhance the generalization ability of models to unseen data.
By addressing the above three challenges, our approach improves the encoding capability of the shared encode, ultimately leading to improved generalization performance in AU detection. The pseudocode for the algorithm is provided in Algorithm. 1.
3.5 Encoder for AU detection
To preserve the fairness of the comparison with conventional pixel-level feature learning methods, our encoder is consistent with the network structure of the first training stage in MEGraph [26], consisting of Swin-transformer backbone and AU Relationship-aware Node Feature Learning module. The input to the encoder consists of an contrastive larning image pair consisting of an anchor and a random sample, and the encoder is optimized by AUNCE only.
4 Evaluation
4.1 Experiment Setting
4.1.1 Datasets
In our experiments, we extensively utilize four well-established datasets in constrained scenarios for AU detection, namely BP4D [27], DISFA [28], BP4D+ [29], GFT [30], and one well-established dataset in unconstrained scenarios, namely Aff-Wild2 [31]. Our primary focus is on assessing frame-level AU detection, as opposed to datasets that solely provide video-level annotations.
BP4D [27]: This dataset includes 41 participants (23 females, 18 males), each appearing in 8 sessions with 2D and 3D video recordings. It contains approximately 140,000 frames, each labeled for AU occurrence and annotated with 68 facial landmarks. A three-fold cross-validation is used for evaluation.
DISFA [28]: Comprising 27 videos from 15 men and 12 women, this dataset includes 130,788 frames annotated with 68 facial landmarks and AU intensities (0-5). Frames with intensities 2 are positive; others are negative. Three-fold cross-validation is applied for evaluation, similar to BP4D.
BP4D+ [29]: Featuring 82 females and 58 males across 10 sessions, this dataset expands upon BP4D in scale and diversity. Of the 10 sessions, 4 provide 197,875 AU-labeled frames annotated with 49 facial landmarks. Following [6], we train on BP4D and test on BP4D+.
GFT [30]: This dataset records 96 participants in 32 unscripted conversational groups, primarily capturing moderate out-of-plane poses. Annotations include 10 AUs and 68 facial landmarks. Training involves 78 participants (108,000 frames), while testing uses 18 participants (24,600 frames) based on standard splits.
Aff-Wild2 [31]: This in-the-wild dataset includes 305 training videos (1.39 million frames) and 105 validation videos (440,000 frames), sourced from YouTube with diverse demographics and conditions. Each frame is annotated with 12 AUs and 68 facial landmarks. We follow [32] by training on the training set and evaluating on the validation set.
The occurrence rates of AUs in the training sets of these datasets are presented in Table 1. It is evident from the table that the class imbalance issue of each type of AU is prevalent across all datasets, especially on the DISFA, GFT and Aff-Wild2 datasets.
| Dataset | AU Index | ||||||||||||||
| 1 | 2 | 4 | 6 | 7 | 9 | 10 | 12 | 14 | 15 | 17 | 23 | 24 | 25 | 26 | |
| BP4D [27] | 21.1 | 17.1 | 20.3 | 46.2 | 54.9 | - | 59.4 | 56.2 | 46.6 | 16.9 | 34.4 | 16.5 | 15.2 | - | - |
| BP4D+ [29] | 10.0 | 8.0 | 6.0 | 50.0 | 66.0 | - | 65.0 | 58.0 | 60.0 | 11.0 | 13.0 | 17.0 | 4.0 | - | - |
| DISFA [28] | 5.0 | 4.0 | 15.0 | 8.1 | - | 4.3 | - | 13.2 | - | - | - | - | - | 27.8 | 8.9 |
| GFT [30] | 3.7 | 13.5 | 3.7 | 28.3 | - | - | 24.6 | 29.3 | 3.1 | 10.7 | - | 25.0 | 14.1 | - | - |
| Aff-Wild2 [31] | 11.9 | 5.1 | 16.0 | 26.5 | 39.9 | - | 34.5 | 24.3 | - | 2.8 | - | 3.1 | 2.8 | 62.8 | 7.6 |
4.1.2 Implementation Details
Following the preprocessing method used in MEGraph [26], the 68 facial landmarks undergo a conversion into 49 facial internal landmarks, excluding those associated with the facial contour. Subsequently, the images undergo augmentation through similarity transformation, encompassing in-plane rotation, uniform scaling, and translation, utilizing the 49 facial landmarks. The resulting images are standardized to a resolution of 2562563 pixels and then randomly cropped into 2242243 pixels, with the addition of a random horizontal flip.
For the pre-training process, the encoder is conducted on one NVIDIA GeForce RTX 3090 GPU with 24GB for one day and implemented by PyTorch using an AdamW optimizer with = 0.9, = 0.999 and weight decay of . We set a learning rate of 10-5 and 60 epochs. In our discriminative contrastive learning framework, where sample pairs are selected within the same batch, the batch size significantly impacts the experimental results. For consistency, we have set the batch size to 32 in our experiments. In terms of the hyperparameters in AUNCE, is set as 12 for BP4D, BP4D+, Aff-Wild2, 10 for GFT, and 8 for DISFA respectively, and the temperature coefficient is 0.5. The analysis for and , , will introduce in Section. 4.4.1.
For the linear evaluation protocol [9, 13], we extract 2048-dimensional feature vectors from the model pre-trained using the AUNCE loss. A linear classifier is then trained on these features using AdamW optimizer with the same settings as the pre-training phase, a batch size of 256 on a single GPU, a learning rate of 10-3, and 100 epochs. The results are obtained through training with the weighted cross-entropy loss (WCE), and the highest test accuracy across our models serves as a surrogate measure for the quality of the learned representations.
4.1.3 Evaluation Metrics
Aligned with current state-of-the-art methodologies, we evaluate our AU detection method using three frame-based metrics: F1-macro score, F1-micro score, and Accuracy. The F1-macro score is obtained by calculating the F1 score for each AU class individually and then averaging these values, which is a standard metric employed by many existing methods. Inspired by the work of Hinduja et al. [33], we also incorporate the F1-micro score, which is computed by aggregating the true positives, false positives, and false negatives across all classes before calculating the overall F1-score. This metric is particularly useful for evaluating performance in imbalanced datasets. Additionally, we include Accuracy, which is defined as the ratio of correctly classified frames to the total number of frames, to provide a more comprehensive assessment of model performance. For simplicity, we will refer to the F1-macro score as F1-score in the remainder of the text.
| Method | Source | AU Index | Avg. | |||||||||||
| 1 | 2 | 4 | 6 | 7 | 10 | 12 | 14 | 15 | 17 | 23 | 24 | |||
| Regional feature learning-based methods | ||||||||||||||
| EAC-Net [4] | 2018 TPAMI | 39.0 | 35.2 | 48.6 | 76.1 | 72.9 | 81.9 | 86.2 | 58.8 | 37.5 | 59.1 | 35.9 | 35.8 | 55.9 |
| ROI [3] | 2017 CVPR | 36.2 | 31.6 | 43.4 | 77.1 | 73.7 | 85.0 | 87.0 | 62.6 | 45.7 | 58.0 | 38.3 | 37.4 | 56.4 |
| ARL [5] | 2019 TAC | 45.8 | 39.8 | 55.1 | 75.7 | 77.2 | 82.3 | 86.6 | 58.8 | 47.6 | 62.1 | 47.4 | 55.4 | 61.1 |
| AC2D [34] | 2024 IJCV | 54.2 | 54.7 | 56.5 | 77.0 | 76.2 | 84.0 | 89.0 | 63.6 | 54.8 | 63.6 | 46.5 | 54.8 | 64.6 |
| Multi-task learning-based methods | ||||||||||||||
| MAL [35] | 2023 TAC | 47.9 | 49.5 | 52.1 | 77.6 | 77.8 | 82.8 | 88.3 | 66.4 | 49.7 | 59.7 | 45.2 | 48.5 | 62.2 |
| JA-Net [6] | 2021 IJCV | 53.8 | 47.8 | 58.2 | 78.5 | 75.8 | 82.7 | 88.2 | 63.7 | 43.3 | 61.8 | 45.6 | 49.9 | 62.4 |
| GeoConv [36] | 2022 PR | 48.4 | 44.2 | 59.9 | 78.4 | 75.6 | 83.6 | 86.7 | 65.0 | 53.0 | 64.7 | 49.5 | 54.1 | 63.6 |
| Semantic prior knowledge-based methods | ||||||||||||||
| MMA-Net [37] | 2023 PRL | 52.5 | 50.9 | 58.3 | 76.3 | 75.7 | 83.8 | 87.9 | 63.8 | 48.7 | 61.7 | 46.5 | 54.4 | 63.4 |
| SEV-Net [38] | 2021 CVPR | 58.2 | 50.4 | 58.3 | 81.9 | 73.9 | 87.7 | 87.5 | 61.6 | 52.6 | 62.2 | 44.6 | 47.6 | 63.9 |
| Correlational information-based methods | ||||||||||||||
| AAR [32] | 2023 TIP | 53.2 | 47.7 | 56.7 | 75.9 | 79.1 | 82.9 | 88.6 | 60.5 | 51.5 | 61.9 | 51.0 | 56.8 | 63.8 |
| MEGraph [26] | 2022 IJCAI | 52.7 | 44.3 | 60.9 | 79.9 | 80.1 | 85.3 | 89.2 | 69.4 | 55.4 | 64.4 | 49.8 | 55.1 | 65.5 |
| SACL [39] | 2024 TAC | 57.8 | 48.8 | 59.4 | 79.1 | 78.8 | 84.0 | 88.2 | 65.2 | 56.1 | 63.8 | 50.8 | 55.2 | 65.6 |
| Contrastive learning-based methods | ||||||||||||||
| SimCLR [13] | 2020 ICML | 38.0 | 36.4 | 37.2 | 66.6 | 64.7 | 76.2 | 76.2 | 51.1 | 29.8 | 56.1 | 27.5 | 37.7 | 49.8 |
| MoCo [14] | 2020 CVPR | 30.8 | 41.3 | 42.1 | 70.2 | 70.4 | 78.7 | 82.5 | 53.3 | 25.2 | 59.1 | 31.5 | 34.3 | 51.6 |
| EmoCo [23] | 2021 FG | 50.2 | 44.7 | 53.9 | 74.8 | 76.6 | 83.7 | 87.9 | 61.7 | 47.6 | 59.8 | 46.9 | 54.6 | 61.9 |
| CLP [11] | 2023 TIP | 47.7 | 50.9 | 49.5 | 75.8 | 78.7 | 80.2 | 84.1 | 67.1 | 52.0 | 62.7 | 45.7 | 54.8 | 62.4 |
| KSRL [21] | 2022 CVPR | 53.3 | 47.4 | 56.2 | 79.4 | 80.7 | 85.1 | 89.0 | 67.4 | 55.9 | 61.9 | 48.5 | 49.0 | 64.5 |
| CLEF [19] | 2023 ICCV | 55.8 | 46.8 | 63.3 | 79.5 | 77.6 | 83.6 | 87.8 | 67.3 | 55.2 | 63.5 | 53.0 | 57.8 | 65.9 |
| AUNCE(Ours) | - | 53.6 | 49.8 | 61.6 | 78.4 | 78.8 | 84.7 | 89.6 | 67.4 | 55.1 | 65.4 | 50.9 | 58.0 | 66.1 |
| ( | ( | ( | ( | ( | ( | ( | ( | ( | ( | ( | ( | ( | ||
| 0.15) | 0.12) | 0.17) | 0.21) | 0.19) | 0.22) | 0.22) | 0.17) | 0.14) | 0.15) | 0.14) | 0.15) | 0.17) | ||
| Method | Source | AU Index | Avg. | |||||||
| 1 | 2 | 4 | 6 | 9 | 12 | 25 | 26 | |||
| Regional feature learning-based methods | ||||||||||
| EAC-Net [4] | 2018 TPAMI | 41.5 | 26.4 | 66.4 | 50.7 | 80.5 | 89.3 | 88.9 | 15.6 | 48.5 |
| ROI [3] | 2017 CVPR | 41.5 | 26.4 | 66.4 | 50.7 | 80.5 | 89.3 | 88.9 | 15.6 | 48.5 |
| ARL [5] | 2019 TAC | 43.9 | 42.1 | 63.6 | 41.8 | 40.0 | 76.2 | 95.2 | 66.8 | 58.7 |
| AC2D [34] | 2024 IJCV | 57.8 | 59.2 | 70.1 | 50.1 | 54.4 | 75.1 | 90.3 | 66.2 | 65.4 |
| Multi-task learning-based methods | ||||||||||
| MAL [35] | 2023 TAC | 43.8 | 39.3 | 68.9 | 47.4 | 48.6 | 72.7 | 90.6 | 52.6 | 58.0 |
| JA-Net [6] | 2021 IJCV | 62.4 | 60.7 | 67.1 | 41.1 | 45.1 | 73.5 | 90.9 | 67.4 | 63.5 |
| GeoConv [36] | 2022 PR | 65.5 | 65.8 | 67.2 | 48.6 | 51.4 | 72.6 | 80.9 | 44.9 | 62.1 |
| Semantic prior knowledge-based methods | ||||||||||
| SEV-Net [38] | 2021 CVPR | 55.3 | 53.1 | 61.5 | 53.6 | 38.2 | 71.6 | 95.7 | 41.5 | 58.8 |
| MMA-Net [37] | 2023 PRL | 63.8 | 54.8 | 73.6 | 39.2 | 61.5 | 73.1 | 92.3 | 70.5 | 66.0 |
| Correlational information-based methods | ||||||||||
| MEGraph [26] | 2022 IJCAI | 52.5 | 45.7 | 76.1 | 51.8 | 46.5 | 76.1 | 92.9 | 57.6 | 62.4 |
| AAR [32] | 2023 TIP | 62.4 | 53.6 | 71.5 | 39.0 | 48.8 | 76.1 | 91.3 | 70.6 | 64.2 |
| SACL [39] | 2024 TAC | 62.0 | 65.7 | 74.5 | 53.2 | 43.1 | 76.9 | 95.6 | 53.1 | 65.5 |
| Contrastive learning-based methods | ||||||||||
| SIMCLR [13] | 2020 ICML | 21.2 | 23.3 | 47.5 | 42.4 | 35.5 | 66.8 | 81.5 | 52.7 | 46.4 |
| MoCo [14] | 2020 CVPR | 22.7 | 18.2 | 45.9 | 45.4 | 34.1 | 72.9 | 83.4 | 54.5 | 47.1 |
| CLP [11] | 2023 TIP | 42.4 | 38.7 | 63.5 | 59.7 | 38.9 | 73.0 | 85.0 | 58.1 | 57.4 |
| EmoCo [23] | 2021 FG | 42.7 | 41.0 | 66.3 | 45.1 | 50.9 | 75.5 | 88.9 | 58.6 | 58.6 |
| KSRL [21] | 2022 CVPR | 60.4 | 59.2 | 67.5 | 52.7 | 51.5 | 76.1 | 91.3 | 57.7 | 64.5 |
| CLEF [19] | 2023 ICCV | 64.3 | 61.8 | 68.4 | 49.0 | 55.2 | 72.9 | 89.9 | 57.0 | 64.8 |
| AUNCE(Ours) | - | 61.8 | 58.9 | 74.9 | 49.7 | 56.2 | 73.5 | 92.1 | 64.2 | 66.4 |
| ( | ( | ( | ( | ( | ( | ( | ( | ( | ||
| 0.37) | 0.22) | 0.42) | 0.31) | 0.36) | 0.49) | 0.42) | 0.28) | 0.36) | ||
| Method | Source | AU Index | Avg. | |||||||||||
| 1 | 2 | 4 | 6 | 7 | 10 | 12 | 14 | 15 | 17 | 23 | 24 | |||
| ARL [5] | 2019 TAC | 29.9 | 33.1 | 27.1 | 81.5 | 83.0 | 84.8 | 86.2 | 59.7 | 44.6 | 43.7 | 48.8 | 32.3 | 54.6 |
| EAC-Net [4] | 2018 TPAMI | 38.0 | 37.5 | 32.6 | 82.0 | 83.4 | 87.1 | 85.1 | 62.1 | 44.5 | 43.6 | 45.0 | 32.8 | 56.1 |
| JA-Net [6] | 2021 IJCV | 39.7 | 35.6 | 30.7 | 82.4 | 84.7 | 88.8 | 87.0 | 62.2 | 38.9 | 46.4 | 48.9 | 36.0 | 56.8 |
| AC2D [34] | 2024 IJCV | 42.3 | 35.4 | 26.7 | 80.7 | 87.0 | 90.9 | 85.8 | 73.3 | 45.3 | 43.4 | 50.3 | 29.0 | 57.5 |
| AUNCE(Ours) | - | 42.5 | 41.5 | 27.9 | 84.1 | 86.5 | 91.7 | 91.3 | 72.1 | 49.7 | 48.8 | 48.0 | 33.5 | 59.8 |
| ( | ( | ( | ( | ( | ( | ( | ( | ( | ( | ( | ( | ( | ||
| 0.18) | 0.46) | 0.14) | 0.32) | 0.23) | 0.17) | 0.14) | 0.49) | 0.33) | 0.25) | 0.12) | 0.24) | 0.26) | ||
| Method | Source | AU Index | Avg. | |||||||||
| 1 | 2 | 4 | 6 | 10 | 12 | 14 | 15 | 23 | 24 | |||
| EAC-Net [4] | 2018 TPAMI | 15.5 | 56.6 | 0.1 | 81.0 | 76.1 | 84.0 | 0.1 | 38.5 | 57.8 | 51.2 | 46.1 |
| MoCo [14] | 2020 CVPR | 35.9 | 45.4 | 13.5 | 83.4 | 71.3 | 78.1 | 23.3 | 37.3 | 26.6 | 50.7 | 46.5 |
| SimCLR [13] | 2020 ICML | 39.6 | 48.3 | 5.6 | 80.7 | 76.2 | 80.6 | 18.1 | 41.6 | 46.1 | 43.8 | 48.1 |
| ARL [5] | 2019 TAC | 51.9 | 45.9 | 13.7 | 79.2 | 75.5 | 82.8 | 0.1 | 44.9 | 59.2 | 47.5 | 50.1 |
| JA-Net [6] | 2021 IJCV | 46.5 | 49.3 | 19.2 | 79.0 | 75.0 | 84.8 | 44.1 | 33.5 | 54.9 | 50.7 | 53.7 |
| CLP [11] | 2023 TIP | 44.6 | 58.7 | 34.7 | 75.9 | 78.6 | 86.6 | 20.3 | 44.8 | 56.4 | 42.2 | 54.3 |
| AAR [32] | 2023 TIP | 66.3 | 53.9 | 23.7 | 81.5 | 73.6 | 84.2 | 43.8 | 53.8 | 58.2 | 46.5 | 58.5 |
| MAL [35] | 2023 TAC | 52.4 | 57.0 | 54.1 | 74.5 | 78.0 | 84.9 | 43.1 | 47.7 | 54.4 | 51.9 | 59.8 |
| AC2D [34] | 2024 IJCV | 60.9 | 58.2 | 24.4 | 83.3 | 75.9 | 87.4 | 56.4 | 46.5 | 58.3 | 50.9 | 60.2 |
| AUNCE(Ours) | - | 53.6 | 62.8 | 51.3 | 80.6 | 82.1 | 88.2 | 48.2 | 49.8 | 54.6 | 58.9 | 63.0 |
| ( | ( | ( | ( | ( | ( | ( | ( | ( | ( | ( | ||
| 0.33) | 0.18) | 0.28) | 0.24) | 0.41) | 0.11) | 0.35) | 0.23) | 0.42) | 0.35) | 0.29) | ||
| Method | Source | AU Index | Avg. | |||||||||||
| 1 | 2 | 4 | 6 | 7 | 10 | 12 | 15 | 23 | 24 | 25 | 26 | |||
| EAC-Net [4] | 2018 TPAMI | 49.6 | 33.7 | 55.6 | 66.4 | 82.3 | 81.4 | 76.9 | 11.8 | 12.5 | 12.2 | 93.7 | 26.8 | 50.2 |
| ARL [5] | 2019 TAC | 59.2 | 48.2 | 54.9 | 70.0 | 83.4 | 80.3 | 72.0 | 0.1 | 0.1 | 17.3 | 93.0 | 37.5 | 51.3 |
| JA-Net [6] | 2021 IJCV | 61.7 | 50.1 | 56.0 | 71.7 | 81.7 | 82.3 | 78.0 | 31.1 | 1.4 | 8.6 | 94.8 | 37.5 | 54.6 |
| AAR [32] | 2023 TIP | 65.4 | 57.9 | 59.9 | 73.2 | 84.6 | 83.2 | 79.9 | 21.8 | 27.4 | 19.9 | 94.5 | 41.7 | 59.1 |
| AC2D [34] | 2024 IJCV | 63.8 | 53.1 | 66.0 | 66.6 | 80.7 | 80.1 | 78.0 | 30.3 | 26.5 | 29.2 | 93.3 | 41.4 | 59.1 |
| AUNCE(Ours) | - | 68.8 | 67.6 | 64.7 | 74.8 | 88.6 | 78.4 | 81.3 | 26.9 | 36.7 | 18.6 | 96.1 | 43.8 | 62.2 |
| ( | ( | ( | ( | ( | ( | ( | ( | ( | ( | ( | ( | ( | ||
| 0.25) | 0.37) | 0.28) | 0.33) | 0.12) | 0.47) | 0.31) | 0.17) | 0.08) | 0.42) | 0.39) | 0.32) | 0.29) | ||
| Dataset | Method | AU Index | Avg. | |||||||||
| 1 | 2 | 4 | 6 | 10 | 12 | 14 | 15 | 23 | 24 | |||
| BP4D → GFT | AC2D [34] | 28.0 | 35.7 | 22.7 | 70.5 | 69.2 | 65.2 | 16.3 | 29.0 | 40.8 | 45.2 | 42.3 |
| Ours (WCE) | 30.2 | 37.9 | 24.8 | 66.4 | 72.3 | 62.6 | 20.1 | 28.6 | 44.6 | 38.8 | 42.6 | |
| Ours (AUNCE) | 32.4 | 50.1 | 10.5 | 71.0 | 77.6 | 70.2 | 22.3 | 26.5 | 50.9 | 40.4 | 45.2 | |
| GFT → BP4D | Ours (WCE) | 49.5 | 45.5 | 26.0 | 20.4 | 52.3 | 36.6 | 17.3 | 18.6 | 50.5 | 54.4 | 37.1 |
| AC2D [34] | 51.9 | 49.3 | 25.8 | 24.6 | 50.1 | 40.9 | 15.3 | 20.1 | 47.2 | 58.3 | 38.4 | |
| Ours (AUNCE) | 52.3 | 50.8 | 24.6 | 18.7 | 58.8 | 38.8 | 20.6 | 22.5 | 56.6 | 62.9 | 40.7 | |
4.2 Comparison with State-of-the-Art Methods
4.2.1 Evaluation on BP4D
Since we use AU labels to assist the process of selecting positive sample pairs, we introduce five groups of supervised AU detection frameworks to compare with our method. The quantitative results of state-of-the-art methods from the past seven years for BP4D dataset are shown in Table 2. Compared to the latest state-of-the-art results, our method AUNCE demonstrates significantly superior performance.
Methods in the first group are based on feature extraction of regional area around AUs, including EAC-Net [4], ROI [3], ARL [5] and AC2D [34]. Our approach achieves a notable improvement, with an increase in F1-score ranging from 1.5% to 10.2% over these methods. This advancement is primarily due to the feature extraction methods of these frameworks neglecting critical correlation information among AUs and failing to specifically address the class imbalance issue for each AU. Furthermore, the precision of the encoders utilized by these methods is generally lower.
Methods in the second group are based on a multi-task learning strategy, including MAL [35], JA-Net [6] and GeoConv [36]. Our method surpasses MAL by 3.9%, primarily due to the ability of AUNCE to help the encoder address the class imbalance issue among different AUs, and the facial expression recognition component in MAL introduces some negative transfer effects on AU detection. The 3.7% improvement over JA-Net can be attributed to the influence of the facial landmark detection task within the multi-task learning framework on AU detection, which is also affected by the weighting of different losses. Additionally, the modest 2.5% improvement over GeoConv is due to the relatively limited impact of integrating 3D information on enhancing the performance of 2D AU detection.
Methods in the third group mainly utilize the semantic prior knowledge, including MMA-Net [37] and SEV-Net [38]. Our approach demonstrates an average improvement of 2.7% and 2.2%, respectively. This phenomenon can be attributed to the inherent limitations of these methods in effectively capturing and representing the distinct information encoded within AUs using simple semantic descriptions.
Methods in the fourth group focus on capturing correlational information among AUs, including AAR [32], SACL [39] and MEGraph [26]. Our approach exhibits a performance advantage of approximately 0.5%-2.3% in F1-score. This underscores the efficacy of our supervised discriminative contrastive learning paradigm in effectively capturing differential information between AUs from each sample pair instead of pixel-level information of the entire face associated with AU. It is noteworthy that the encoder used in our method is only the same as the network MEGraph used for the first stage of training, with reduced parameters by nearly 7M. This highlights learning only the difference information among features is more efficient than learning the whole pixel-level information.
Methods in the last group are based on contrastive learning, including SIMCLR [13], MoCo [14], EmoCo [23], CLP [11], KSRL [21] and CLEF [19]. When compared to these methods, our approach demonstrates a performance advantage of approximately 0.2% to 16.3% in F1-score. This improvement is attributed to the efficacy of our proposed negative sample re-weighting strategy and positive sample sampling strategy, specifically tailored for the AU detection task using static images. In addition, compared to contrastive learning methods based on weighted cross-entropy loss, our approach significantly reduces the extraction of pixel-level redundant information.
4.2.2 Evaluation on DISFA
Comparable outcomes are evident in the DISFA dataset, as outlined in Table 3, where AUNCE attains the highest overall performance in AU detection. Furthermore, a comparison between Table 2 and Table 3 reveals that recent methods such as EmoCo, CLP, and MEGraph demonstrate strong performance on the BP4D dataset but achieve only mediocre results on the DISFA dataset. This disparity suggests their limited generalizability. The more pronounced class imbalance issue in DISFA, as shown in Table 1, likely contributes to this performance gap. In contrast, AUNCE consistently delivers robust performance on both BP4D and DISFA datasets and achieves more stable results across various AUs due to our proposed negative sample re-weighting strategy.
4.2.3 Evaluation on BP4D+
To assess the model’s performance on a larger and more diverse test set, we train AUNCE on the full BP4D and evaluate it on the entire BP4D+ using a cross-dataset testing protocol. The comparative results are presented in Table 4. Notably, AUNCE achieves superior performance in terms of the average F1-score, outperforming previous methods. This indicates that AUNCE maintains robust performance even when the testing data significantly increases in both scale and diversity.
4.2.4 Evaluation on GFT
The F1-score results on GFT are summarized in Table 5, where the proposed AUNCE method demonstrates a clear advantage over previous approaches. Unlike BP4D, BP4D+, and DISFA, which predominantly consist of near-frontal facial images, GFT features a substantial number of images captured with out-of-plane poses, posing greater challenges for accurate AU detection. While methods such as ARL, CLP and AC2D encounter significant performance limitations under these conditions, AUNCE achieves an impressive average F1-score of 63.0%, highlighting its robustness in handling complex pose variations.
4.2.5 Evaluation on Aff-Wild2
We have validated the performance of our AUNCE method in constrained scenarios. To further assess its effectiveness in unconstrained scenarios, we compared it with other approaches on the challenging Aff-Wild2 dataset, as shown in Table 6. Our AUNCE method demonstrates a higher average F1-score than previous methods. Notably, while EAC-Net leverage external training data, our method achieves superior overall performance using only the Aff-Wild2 dataset. By comparing the results of ARL, JA-Net, AAR and AC2D to our AUNCE method across Table 2 to Table 6, it is evident that the performance margins between our AUNCE method and other methods on GFT and Aff-Wild2 are larger than those on BP4D, BP4D+ and DISFA. This indicates that AUNCE is more effective at handling challenging cases in AU detection.
4.2.6 Cross dataset validation of AUNCE
To evaluate the generalization and cross-dataset reliability of our framework, we compare AUNCE with two baselines: one using the same encoder with weighted cross-entropy loss (WCE) and another, AC2D [34]. Results are presented in Table 7. Since the 10 AUs in the GFT dataset overlap with the 12 AUs in BP4D, we perform cross-dataset evaluations between BP4D and GFT. For BP4D-to-GFT, we use the three BP4D models trained via 3-fold cross-validation and report the average results. For GFT-to-BP4D, the trained GFT model is tested on the three BP4D test sets, and average results are reported.
As shown in Tables 2 and 5, the performance of AUNCE is notably lower in this cross-dataset evaluation. This performance drop can be attributed to the substantial domain gap between BP4D and GFT. Additionally, our findings show that AUNCE demonstrates superior performance compared to the other two approaches that rely on WCE loss in both BP4D → GFT and GFT → BP4D tasks. This result further underscores the robustness and generalization capability of our proposed discriminative contrastive learning framework.
| Backbone | Source | Loss | Dataset | |
| BP4D | DISFA | |||
| ResNet50 [40] | 2016CVPR | WCE | 56.2 | 45.2 |
| WFL | 57.71.5↑ | 47.01.8↑ | ||
| AUNCE | ||||
| ROI [3] | 2017CVPR | WCE | 56.4 | 48.5 |
| WFL | 57.00.6↑ | 50.62.1↑ | ||
| AUNCE | ||||
| JA-Net [6] | 2021IJCV | WCE | 62.4 | 63.5 |
| WFL | 63.81.4↑ | 63.60.1↑ | ||
| AUNCE | ||||
| MEGraph (Onestage) [26] | 2022IJCAI | WCE | 63.6 | 60.8 |
| WFL | 64.20.6↑ | 61.81.0↑ | ||
| AUNCE | ||||
4.3 Ablation Study
4.3.1 Compared with weighted cross-entropy loss and weighted focal loss
The primary innovation of this paper is the introduction of AUNCE, a novel contrastive loss designed to be compatible with various AU detection encoders. To assess its effectiveness, we compare the proposed AUNCE loss with traditional weighted cross-entropy loss (WCE) and the recently introduced weighted focal loss (WFL) [7] for AU detection during the pretraining phase, across multiple AU detection encoders. The results, presented in Table 8, demonstrate that AUNCE consistently outperforms the other losses in AU detection. Notably, the MEGraph encoder achieves the highest performance, with scores of 66.1% and 66.4% on BP4D and DISFA datasets, respectively, when trained using AUNCE. This highlights the advantage of emphasizing the capture of distinct features from individual samples, rather than solely relying on pixel-level information of the entire face in relation to AU detection.
| Dataset | Loss | Complexity | Frame Rate(FPS) | 1 Epoch Time(s) |
| BP4D | WFL | 0.0293 | 2959 | |
| WCE | 0.0271 | 2734 | ||
| AUNCE | 0.0138 | 1388 | ||
| DISFA | WFL | 0.0284 | 2473 | |
| WCE | 0.0265 | 2308 | ||
| AUNCE | 0.0136 | 1189 |
We compare the computational complexity and efficiency of the three losses. WCE and WFL both have an asymptotic complexity of , as both of them involve computing probabilities for classes and summing over all samples, and WFL introducing negligible overhead due to the power and multiplication operations from the probability margin . In contrast, AUNCE has a lower complexity of , as it processes one anchor point, one positive sample, and negative samples, making it approximately twice as efficient as WCE and WFL when . This suggests that AUNCE, by focusing on differential information between AUs, is more efficient for training the encoder compared to methods that capture entire facial information.
To further validate this advantage, we evaluate computational efficiency using two metrics: frame rate and training time per epoch. As shown in Table 9, under identical encoder parameters, AUNCE improves frame rate and reduces epoch training time by nearly half compared to WCE and WFL. These results confirm AUNCE’s superior efficiency in training, delivering comparable or better performance with significantly reduced computational overhead.
| Model | BL | PS | NS | AU Index | F1-Macro | F1-Micro | Accuracy | ||||||||||||
| 1 | 2 | 4 | 6 | 7 | 10 | 12 | 14 | 15 | 17 | 23 | 24 | (%) | (%) | (%) | |||||
| A | 39.8 | 44.3 | 58.8 | 76.0 | 77.7 | 76.9 | 88.0 | 64.5 | 49.0 | 59.0 | 43.5 | 43.4 | 60.1 | 57.0 | 79.1 | ||||
| B | 40.1 | 43.0 | 58.9 | 75.4 | 79.3 | 78.8 | 87.8 | 64.1 | 48.7 | 61.0 | 46.9 | 47.5 | 61.00.9↑ | 57.20.2↑ | 79.30.2↑ | ||||
| C | 51.1 | 45.6 | 58.3 | 77.5 | 77.0 | 84.5 | 89.0 | 63.7 | 54.6 | 65.5 | 46.8 | 53.3 | 63.83.7↑ | 57.60.6↑ | 79.80.7↑ | ||||
| D | 50.2 | 43.0 | 58.7 | 77.9 | 77.3 | 83.7 | 88.7 | 64.2 | 53.9 | 64.9 | 50.0 | 56.4 | 64.14.0↑ | 57.70.7↑ | 79.90.8↑ | ||||
| E | 53.6 | 49.8 | 61.6 | 78.4 | 78.8 | 84.7 | 89.6 | 67.4 | 55.1 | 65.4 | 50.9 | 58.0 | |||||||
4.3.2 Evaluating other components
We further assess the effectiveness of all proposed components. Quantitative results of ablation study are summarized in Table 10. The baseline (BL) is based on SIMCLR [13], with positive sample pairs replaced by images most similar to the original ones. Other components include the weight coefficient () for both WCE and AUNCE, the positive sample sampling strategy (PS), and the negative sample re-weighting strategy (NS).
Weight coefficient : The weights have been pointed out as a fixed value in Section. 3.1, which achieve an increase of 0.9% in F1-macro score, 0.2% in F1-micro score and 0.2% in Accuracy. For an AU, its activation indicator is a binary variable, and the corresponding information content can be measured using entropy: . Therefore, AUs with lower activation probabilities carry more information and should be assigned higher weights. This forms the theoretical basis for our weighting strategy.
Positive sample sampling strategy: As shown in Table 10, the positive sample sampling strategy improves the F1-macro score by 2.8%, the F1-micro score by 0.4%, and Accuracy by 0.5% compared to model B. This demonstrates that selecting diverse positive sample pairs with appropriate probabilities helps mitigate issues related to noisy or false AU labels. The strategy utilizes three types of positive sample pairs: self-supervised signal pairs, highest similarity pairs, and mixed feature pairs. By incorporating these varied pairs, the model benefits from more informative inputs, enhancing its generalization ability and discriminative power. These improvements enable more effective AU detection, even in the presence of label noise and class imbalance, reinforcing the model’s robustness across various AU detection scenarios.

(a) Visualizing feature maps generated by model E (With re-weighting strategy)

(b) Visualizing feature maps generated by model C (Without re-weighting strategy)
Negative sample re-weighting strategy: The negative sample re-weighting strategy, which prioritizes minority AUs during training, improves the F1-macro score by 3.1%, the F1-micro score by 0.5%, and accuracy by 0.6% compared to model B, demonstrating its ability to adjust backpropagation gradients for minority and majority classes, enabling faster updates with fewer samples. Additionally, model E achieves a 2.3% average increase in F1-macro score compared to model C, further validating the strategy’s effectiveness. As shown in Fig. 4, model E (top row) focuses more on facial regions relevant to rare AUs, enhancing the detection of these challenging cases and reinforcing its utility in addressing class imbalance.

(a)
(b)

(c)

(d)

(e)

(f)

(g)

(h)

(i)

(j)

(k)

(l)
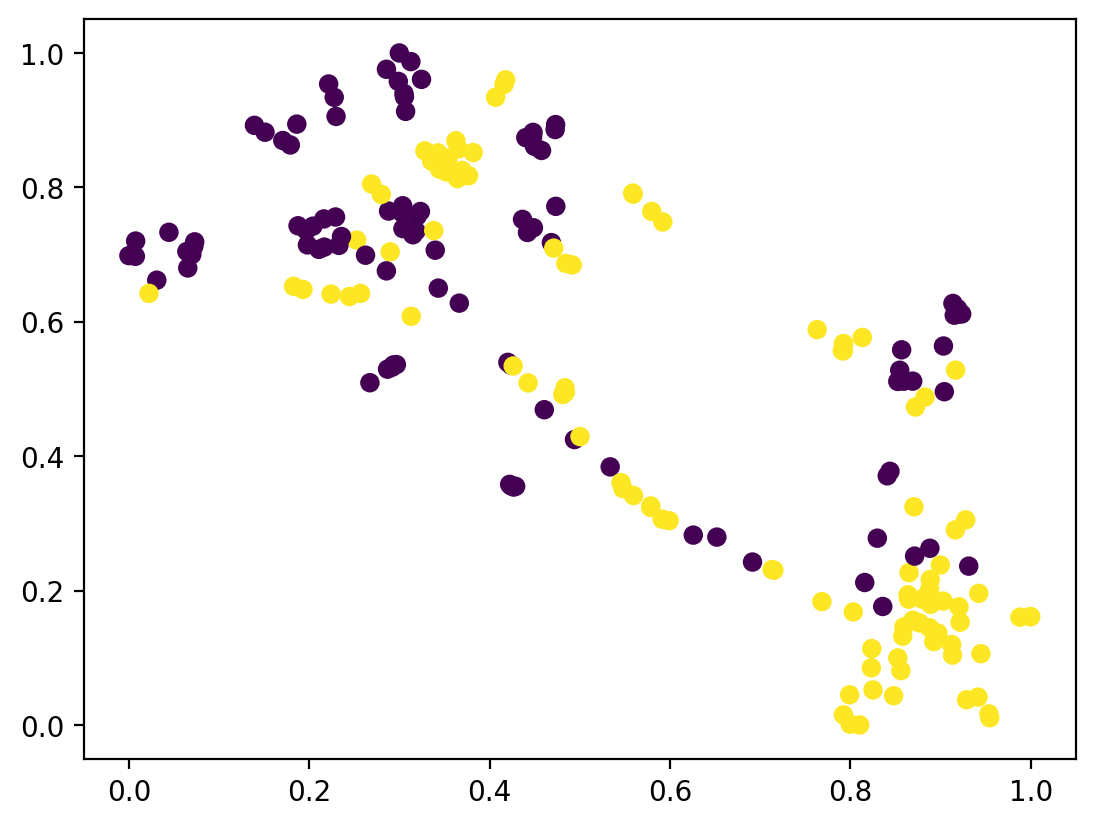
To qualitatively assess the efficacy of our discriminative contrastive learning paradigm, we visualize the learned feature representations optimized by AUNCE and WCE using T-SNE dimensionality reduction, as shown in Fig.5. A random sample of 200 images from each dataset is used for illustration. Comparing Fig.5(a), Fig.5(f) with Fig.5(g), Fig.5(l) demonstrates that features learned with AUNCE show greater separability than those optimized by WCE. Additionally, Fig.5(b)-(f) and Fig. 5(g)-(l) highlight the contribution of each component in our ablation study.
The ablation studies confirm that the proposed discriminative contrastive learning paradigm enhances the encoder’s feature representation capability, addresses class imbalance for each AU type, and improves robustness to noisy and false labels, ultimately boosting generalization performance in AU detection. Each component contributes to performance gains, with NS proving most effective. Furthermore, as shown in Table 10, the addition of , PS, and NS consistently improves or maintains performance across nearly all AUs.
4.3.3 , the probabilities of various positive sample pairs
In our paper, represents the probabilities of images with the highest similarity to original images, represents the probabilities of self-supervised images enhanced by simple augmentations, represents the probabilities of a mixture of all positive samples, and represents the probabilities of images with the lowest similarity to original images. Given that , , , and address the problem of AU labels tainted by noise and errors, we systematically vary these probabilities from 0 to 1 to investigate their impact on our framework. As and are deemed reliable positive samples, we set their values to be the same during the variation.
The experimental results are presented in Table 11. When =0.15, =0.15, =0.7, and =0, the experimental result is optimal. It is observed that images with the lowest similarity to original images contribute minimally to the training process, as these images essentially represent noise and errors. The mixture of all positive samples plays a pivotal role, as it encourages the feature representation of each instance to be closer to the class centroid, facilitating the capture of essential characteristics of the positive class. The indispensability of the remaining two positive samples lies in their ability to mitigate the impact of noisy and false samples, thereby reinforcing the robustness of the training process.
However, hyperparameter tuning is a limitation of our paper. Although the proposed method yields promising results, we observed that the performance is highly sensitive to the values of , , and , with their optimal settings varying across different datasets. Moreover, the parameter tuning process can only be guided by experience gained from extensive experimentation, which results in a tuning scheme that lacks flexibility.
4.4 Hyperparameters Analysis
| F1-Score(%) | |||||
| Probabilities | 1 | 0 | 0 | 0 | 60.1 |
| 0 | 1 | 0 | 0 | 48.4 | |
| 0 | 0 | 1 | 0 | 63.2 | |
| 0 | 0 | 0 | 1 | 17.6 | |
| 0.1 | 0.1 | 0.8 | 0 | 63.8 | |
| 0.15 | 0.15 | 0.7 | 0 | 66.1 | |
| 0.2 | 0.2 | 0.6 | 0 | 65.7 | |
| 0.25 | 0.25 | 0.5 | 0 | 65.2 | |
| 0.3 | 0.3 | 0.4 | 0 | 64.3 | |
| 0.4 | 0.4 | 0.2 | 0 | 58.8 |
4.4.1 Backpropagation rate controller
As is well understood, the hyperparameter plays a crucial role in governing the relative importance of minority and majority class samples during the parameter update process. It ensures that the model allocates more attention to minority class samples when necessary and balances the gradient magnitudes accordingly. To explore its effects, we systematically vary the hyperparameter for the minority class from 0.8 to 1.8, with for the majority class fixed at 0.4. Additionally, we vary for the majority class from 0.2 to 1.2, keeping for the minority class fixed at 1.2.
The experimental results are depicted in Fig. 6. The optimal experimental outcome is observed when for the minority class is set to 1.2, and for the majority class is fixed at 0.4. Hence, when , the impact of the class imbalance issue can be effectively mitigated.

(a)

(b)
5 Conclusion
In this paper, we propose a discriminative contrastive learning framework tailored for AU detection, introducing a novel contrastive loss named AUNCE. Building upon the InfoNCE loss, AUNCE refines the task by shifting focus from learning pixel-level information of the entire face to capturing subtle feature variations during AU activation, thus improving detection efficiency. We also introduce a positive sample sampling strategy that constructs three types of positive sample pairs, selectively augmenting positive samples, especially in the presence of noisy and false AU labels. This approach ensures the model is trained on more reliable examples, improving upon conventional methods that lack adaptive sampling. To address class imbalance in AU detection, we implement a negative sample re-weighting strategy that prioritizes minority AUs, helping the model focus on hard-to-detect samples. This strategy promotes hard example mining by giving more weight to underrepresented classes, enhancing model performance and generalization. Experimental results demonstrate that AUNCE consistently outperforms existing methods, particularly those utilizing weighted cross-entropy loss.
However, hyperparameter tuning remains a limitation of our study. While the proposed method demonstrates promising results, we found that performance is highly sensitive to the values of certain hyperparameters, with optimal settings varying across different datasets. The parameter tuning process is largely driven by empirical experience gained from extensive experimentation, which results in a tuning scheme that lacks the necessary flexibility. To address this limitation, our future work will focus on the development of adaptive hyperparameter selection techniques that can dynamically adjust to different datasets and conditions, enabling more robust and generalized performance across a variety of tasks and settings.
Acknowledgement
This research was supported by the National Natural Science Foundation of China (Nos. 62176221, 61572407), and Sichuan Province Science and Technology Support Program (Nos. 2024NSFTD0036, 2024ZHCG0166).
Declaration of generative AI and AI-assisted technologies in the writing process
During the preparation of this work the author(s) used in order to polish our paper. After using this tool/service, the author(s) reviewed and edited the content as needed and take(s) full responsibility for the content of the publication.
References
- [1] E. L. Rosenberg, P. Ekman, What the face reveals: Basic and applied studies of spontaneous expression using the Facial Action Coding System (FACS), Oxford University Press, 2020.
- [2] A. Fathallah, L. Abdi, A. Douik, Facial expression recognition via deep learning, in: Proc. AICCSA, IEEE, 2017, pp. 745–750.
- [3] W. Li, F. Abtahi, Z. Zhu, Action unit detection with region adaptation, multi-labeling learning and optimal temporal fusing, in: Proc. CVPR, 2017, pp. 1841–1850.
- [4] W. Li, F. Abtahi, Z. Zhu, L. Yin, Eac-net: Deep nets with enhancing and cropping for facial action unit detection, IEEE transactions on pattern analysis and machine intelligence 40 (11) (2018) 2583–2596.
- [5] Z. Shao, Z. Liu, J. Cai, Y. Wu, L. Ma, Facial action unit detection using attention and relation learning, IEEE transactions on affective computing (2019).
- [6] Z. Shao, Z. Liu, J. Cai, L. Ma, Jaa-net: Joint facial action unit detection and face alignment via adaptive attention, International Journal of Computer Vision 129 (2) (2021) 321–340.
- [7] Z. Shang, B. Liu, Facial action unit detection based on multi-task learning strategy for unlabeled facial images in the wild, Expert Systems with Applications 253 (2024) 124285.
- [8] M. Assran, Q. Duval, I. Misra, P. Bojanowski, P. Vincent, M. Rabbat, Y. LeCun, N. Ballas, Self-supervised learning from images with a joint-embedding predictive architecture, in: Proc. CVPR, 2023, pp. 15619–15629.
- [9] A. v. d. Oord, Y. Li, O. Vinyals, Representation learning with contrastive predictive coding, arXiv preprint arXiv:1807.03748 (2018).
- [10] B. Zhou, Q. Cui, X.-S. Wei, Z.-M. Chen, Bbn: Bilateral-branch network with cumulative learning for long-tailed visual recognition, in: Proc. CVPR, 2020, pp. 9719–9728.
- [11] Y. Li, S. Shan, Contrastive learning of person-independent representations for facial action unit detection, IEEE Transactions on Image Processing (2023).
- [12] H. Zhang, mixup: Beyond empirical risk minimization, arXiv preprint arXiv:1710.09412 (2017).
- [13] T. Chen, S. Kornblith, M. Norouzi, G. Hinton, A simple framework for contrastive learning of visual representations, in: Proc. ICML, PMLR, 2020, pp. 1597–1607.
- [14] K. He, H. Fan, Y. Wu, S. Xie, R. Girshick, Momentum contrast for unsupervised visual representation learning (2020) 9729–9738.
- [15] X. Chen, K. He, Exploring simple siamese representation learning, in: Proc. CVPR, 2021, pp. 15750–15758.
- [16] P. Khosla, P. Teterwak, C. Wang, A. Sarna, Y. Tian, P. Isola, A. Maschinot, C. Liu, D. Krishnan, Supervised contrastive learning, Advances in neural information processing systems 33 (2020) 18661–18673.
- [17] T. Chen, S. Kornblith, K. Swersky, M. Norouzi, G. E. Hinton, Big self-supervised models are strong semi-supervised learners, Advances in neural information processing systems 33 (2020) 22243–22255.
- [18] X. Niu, H. Han, S. Shan, X. Chen, Multi-label co-regularization for semi-supervised facial action unit recognition, Advances in neural information processing systems 32 (2019).
- [19] X. Zhang, T. Wang, X. Li, H. Yang, L. Yin, Weakly-supervised text-driven contrastive learning for facial behavior understanding, in: Proc. ICCV, 2023, pp. 20751–20762.
- [20] Z. Liu, R. Liu, Z. Shi, L. Liu, X. Mi, K. Murase, Semi-supervised contrastive learning with soft mask attention for facial action unit detection, in: Proc. ICASSP, IEEE, 2023, pp. 1–5.
- [21] Y. Chang, S. Wang, Knowledge-driven self-supervised representation learning for facial action unit recognition, in: Proc. CVPR, 2022, pp. 20417–20426.
- [22] V. Suresh, D. C. Ong, Using positive matching contrastive loss with facial action units to mitigate bias in facial expression recognition, in: Proc. ACII, IEEE, 2022, pp. 1–8.
- [23] X. Sun, J. Zeng, S. Shan, Emotion-aware contrastive learning for facial action unit detection, in: Proc. FG, IEEE, 2021, pp. 01–08.
- [24] X.-S. Wei, Y.-Z. Song, O. Mac Aodha, J. Wu, Y. Peng, J. Tang, J. Yang, S. Belongie, Fine-grained image analysis with deep learning: A survey, IEEE transactions on pattern analysis and machine intelligence 44 (12) (2021) 8927–8948.
- [25] J. Robinson, C.-Y. Chuang, S. Sra, S. Jegelka, Contrastive learning with hard negative samples, Proc. ICLR (2020).
- [26] C. Luo, S. Song, W. Xie, L. Shen, H. Gunes, Learning multi-dimensional edge feature-based au relation graph for facial action unit recognition, arXiv preprint arXiv:2205.01782 (2022).
- [27] X. Zhang, L. Yin, J. F. Cohn, S. Canavan, M. Reale, A. Horowitz, P. Liu, J. M. Girard, Bp4d-spontaneous: a high-resolution spontaneous 3d dynamic facial expression database, Image and Vision Computing 32 (10) (2014) 692–706.
- [28] S. M. Mavadati, M. H. Mahoor, K. Bartlett, P. Trinh, J. F. Cohn, Disfa: A spontaneous facial action intensity database, IEEE Transactions on Affective Computing 4 (2) (2013) 151–160.
- [29] Z. Zhang, J. M. Girard, Y. Wu, X. Zhang, P. Liu, U. Ciftci, S. Canavan, M. Reale, A. Horowitz, H. Yang, et al., Multimodal spontaneous emotion corpus for human behavior analysis, in: Proc. CVPR, 2016, pp. 3438–3446.
- [30] J. M. Girard, W.-S. Chu, L. A. Jeni, J. F. Cohn, Sayette group formation task (gft) spontaneous facial expression database, in: Proc. FG, IEEE, 2017, pp. 581–588.
- [31] D. Kollias, S. Zafeiriou, Expression, affect, action unit recognition: Aff-wild2, multi-task learning and arcface, arXiv preprint arXiv:1910.04855 (2019).
- [32] Z. Shao, Y. Zhou, J. Cai, H. Zhu, R. Yao, Facial action unit detection via adaptive attention and relation, IEEE Transactions on Image Processing (2023).
- [33] S. Hinduja, T. Nourivandi, J. F. Cohn, S. Canavan, Time to retire f1-binary score for action unit detection, Pattern Recognition Letters 182 (2024) 111–117.
- [34] Z. Shao, H. Zhu, Y. Zhou, X. Xiang, B. Liu, R. Yao, L. Ma, Facial action unit detection by adaptively constraining self-attention and causally deconfounding sample, International Journal of Computer Vision (2024) 1–16.
- [35] Y. Li, S. Shan, Meta auxiliary learning for facial action unit detection, IEEE Transactions on Affective Computing (2023).
- [36] Y. Chen, G. Song, Z. Shao, J. Cai, T.-J. Cham, J. Zheng, Geoconv: Geodesic guided convolution for facial action unit recognition, Pattern Recognition 122 (2022) 108355.
- [37] Z. Shang, C. Du, B. Li, Z. Yan, L. Yu, Mma-net: Multi-view mixed attention mechanism for facial action unit detection, Pattern Recognition Letters (2023).
- [38] H. Yang, L. Yin, Y. Zhou, J. Gu, Exploiting semantic embedding and visual feature for facial action unit detection, in: Proc. CVPR, 2021, pp. 10482–10491.
- [39] X. Liu, K. Yuan, X. Niu, J. Shi, Z. Yu, H. Yue, J. Yang, Multi-scale promoted self-adjusting correlation learning for facial action unit detection, IEEE Transactions on Affective Computing (2024).
- [40] K. He, X. Zhang, S. Ren, J. Sun, Deep residual learning for image recognition, in: Proc. CVPR, 2016, pp. 770–778.