Large-Scale Data Extraction From the OPTN Organ Donor Documents
Abstract
In this paper we focus on three major task: 1) discussing our methods: Our method captures a portion of the data in DCD flowsheets, kidney perfusion data, and Flowsheet data captured peri-organ recovery surgery. 2) demonstrating the result: We built a comprehensive, analyzable database from 2022 OPTN data. This dataset is by far larger than any previously available even in this preliminary phase; and 3) proving that our methods can be extended to all the past OPTN data and future data.
The scope of our study is all Organ Procurement and Transplantation Network (OPTN) data of the USA organ donors since 2008. The data was not analyzable in a large scale in the past because it was captured in PDF documents known as “Attachments”, whereby every donor’s information was recorded into dozens of PDF documents in heterogeneous formats. To make the data analyzable, one needs to convert the content inside these PDFs to an analyzable data format, such as a standard SQL database. In this paper we will focus on 2022 OPTN data, which consists of PDF documents spanning millions of pages. The entire OPTN data covers 15 years (2008–20022). This paper assumes that readers are familiar with the content of the OPTN data.
1 Background
We introduce a multi-faceted, interdisciplinary problem with paramount importance to millions of people worldwide, and especially to Americans with end-stage kidney disease (ESKD) who require dialysis. We aim to address the inefficiencies in organ quality assessment by making previously inaccessible data analyzable through large-scale curation. The symptom of under-par performance of the system is gradual increase in the number of organs that are not used (discarded), e.g., nearly 30% of recovered kidneys are not transplanted, gradually increasing from 8% in the 1980s. If the non-use ratio is reduced, potentially thousands of lives would be saved in the U.S. alone, and dramatically improve life quality for most patients who spent 12 hours a day undergoing hemodialysis which results from a successful kidney transplant. The total cost of dialysis in the US is over $30 billion ($100,000 per patient per year) and simple cost analysis shows that a kidney transplant reduces this to a small fraction, potentially a 3-fold cost reduction per patient. The interdisciplinary research and software here described in this paper target the inefficiencies flow of information in the U.S. organ transplant system, where the primary vehicle for communications is a collection of PDF documents (“PDF attachments”) associated with every donated organ.
The interdisciplinary research and software here described in this paper target the inefficiencies flow of information in the US organ transplant system, where the primary vehicle for communications is a collection of PDF documents (“PDF attachments”) associated with every donated organ. The subject of investigation by our interdisciplinary group is the record of all US organ transplants since electronic data collection started (2008-2022) acquired from OPTN. For practical reasons in this stage of our project we narrowed the dataset to the 2022 portion (10% of the data), which is representative of the entire data, but much easier to manage in the software development cycle. In the current paper we report the preliminary results obtained from this portion of the data, with future publications planned to cover all aspects of the project.
1.1 UNOS, Organ Procurement Organizations and DonorNet
In 1984 the United States 98th Congress passed the National Organ Transplant Act (NOTA: P.L. 98-507) to regulate organ donation, matching, and placement process [13]. The NOTA launched the Organ Procurement and Transplantation Network (OPTN) which has been operated by a private, independent, and non-profit organization called United Network for Organ Sharing (UNOS) under the supervision of the Federal government during the past four decades (https://unos.org/about/national-organ-transplant-system/). UNOS develops organ allocation policies, manages the national transplant waitlist, matches donors to recipients via a computerized algorithm, maintains an organ transplant database, and educates the public and transplant community.
When a patient is diagnosed with brain death while being treated as an inpatient, U.S. donor hospitals are obligated to inform and collaborate with Organ Procurement Organizations (OPO) operating within their respective donor service area (DSA). The OPOs, which are not-for-profit entities, are regulated by the Centers for Medicare and Medicaid Services (CMS). The United States has a total of 57 OPOs, each holds the responsibility of obtaining consent from donor families, transmitting donor medical data to UNOS via UNet (a web portal that connects the OPOs and transplant centers), procuring organs, and facilitating their delivery to over 250 transplant centers (TC). The OPTN uses UNet as a main tool to collect and verify data, which was implemented on October 25, 1999 [5, 12]. The OPOs have access to donor data at more than 1,000 donor hospitals in real-time. UNOS completed integration of DonorNet into UNet in 2008, which enables the OPOs to upload and update deceased donor information digitally.
1.2 Source Data and PDF Attachments
Depending on the OPOs, the forms/content used to upload the same donor information may vary. For example, there are over 25 different types of forms used for kidney anatomy and pathology reporting. By reviewing critical information in the donor attachments, the TC of receiving organ offers can make informed decisions regarding organ utilization and the system may improve efficiency of organ placement [12]. The TCs build their provisional acceptance decision of a kidney offer predominantly based on donors’ characteristics, which is summarized in Kidney Donor Profile Index (KDPI). At the time of a deceased donor organ recovery surgery, the surgical team generally communicates donor anatomy (kidney length, vascular plaques in aorta and renal artery, number of renal arteries and ureters, kidney tumors, infarcts, thrombosis) to the accepting TC. Organ utilization decision is mostly finalized based on a combination of post-recovery data (e.g. donor anatomy [15, 9, 18, 7, 4] , recovery type and associated cold and warm ischemia time [6, 2], procurement kidney biopsy results [17, 10, 8, 3, 11], and pulsatile machine perfusion values [16].
Over 99% of donor data (including detailed post-recovery data) has been stored in each donor’s profile as individual PDF attachments in the DonorNet since 2008. There are 135,446 deceased donors with over 1 million PDF attachments between 2008 to 2021 [14], as each deceased donor in the DonorNet generally has 10–20 PDF attachments. These PDF attachments consist of donor forms (information captured in checkboxes, handwritten digits, and comments, typed text and/or handwritten annotations), image-only content such as photographs taken during organ procurement, X-rays, and digital pathology slides. Furthermore, short video clips featuring echocardiograms, angiograms, and bronchoscopies may be attached. A detailed discussion of the content of the PDF attachments and challenges that they pose is available in the other paper. [1]
1.3 The focus of the preliminary study
The collection of 1 million PDF attachments represents a substantial volume of data, totaling approximately 10 terabytes in size. Given that the data consisting of individual medical records and health information, it is required to process the data within a HIPAA-compliant environment. This makes this problem formidable in terms of computing resources and organizational effort required to perform the tasks described in this paper. We are currently using the new HIPAA-compliant HPC cluster at the University of Arizona called Soteria.
In this phase we focused on data in native-born (“pure”) PDFs. While PDF files are primarily designed for storing and presenting textual and graphical content, they can also include binary data such as images, audio, video, and other non-textual elements. In other words, PDF is a flexible container file format.
This distinction is important because handling documents stored as images requires additional processing, including Optical Character Recognition (OCR). Moreover, many images are captured by smartphones’ cameras, and are subject to perspective distortion, which requires application of computer vision techniques. We have developed relevant techniques over the past few years, but building a complete set of software tool kits capable of processing the entire OPTN dataset has not been completed because of lack of sufficient funding.
The current study was approved by the University of Arizona Institutional Review Board (IRB).
2 A case study: extraction of DCD flowsheets
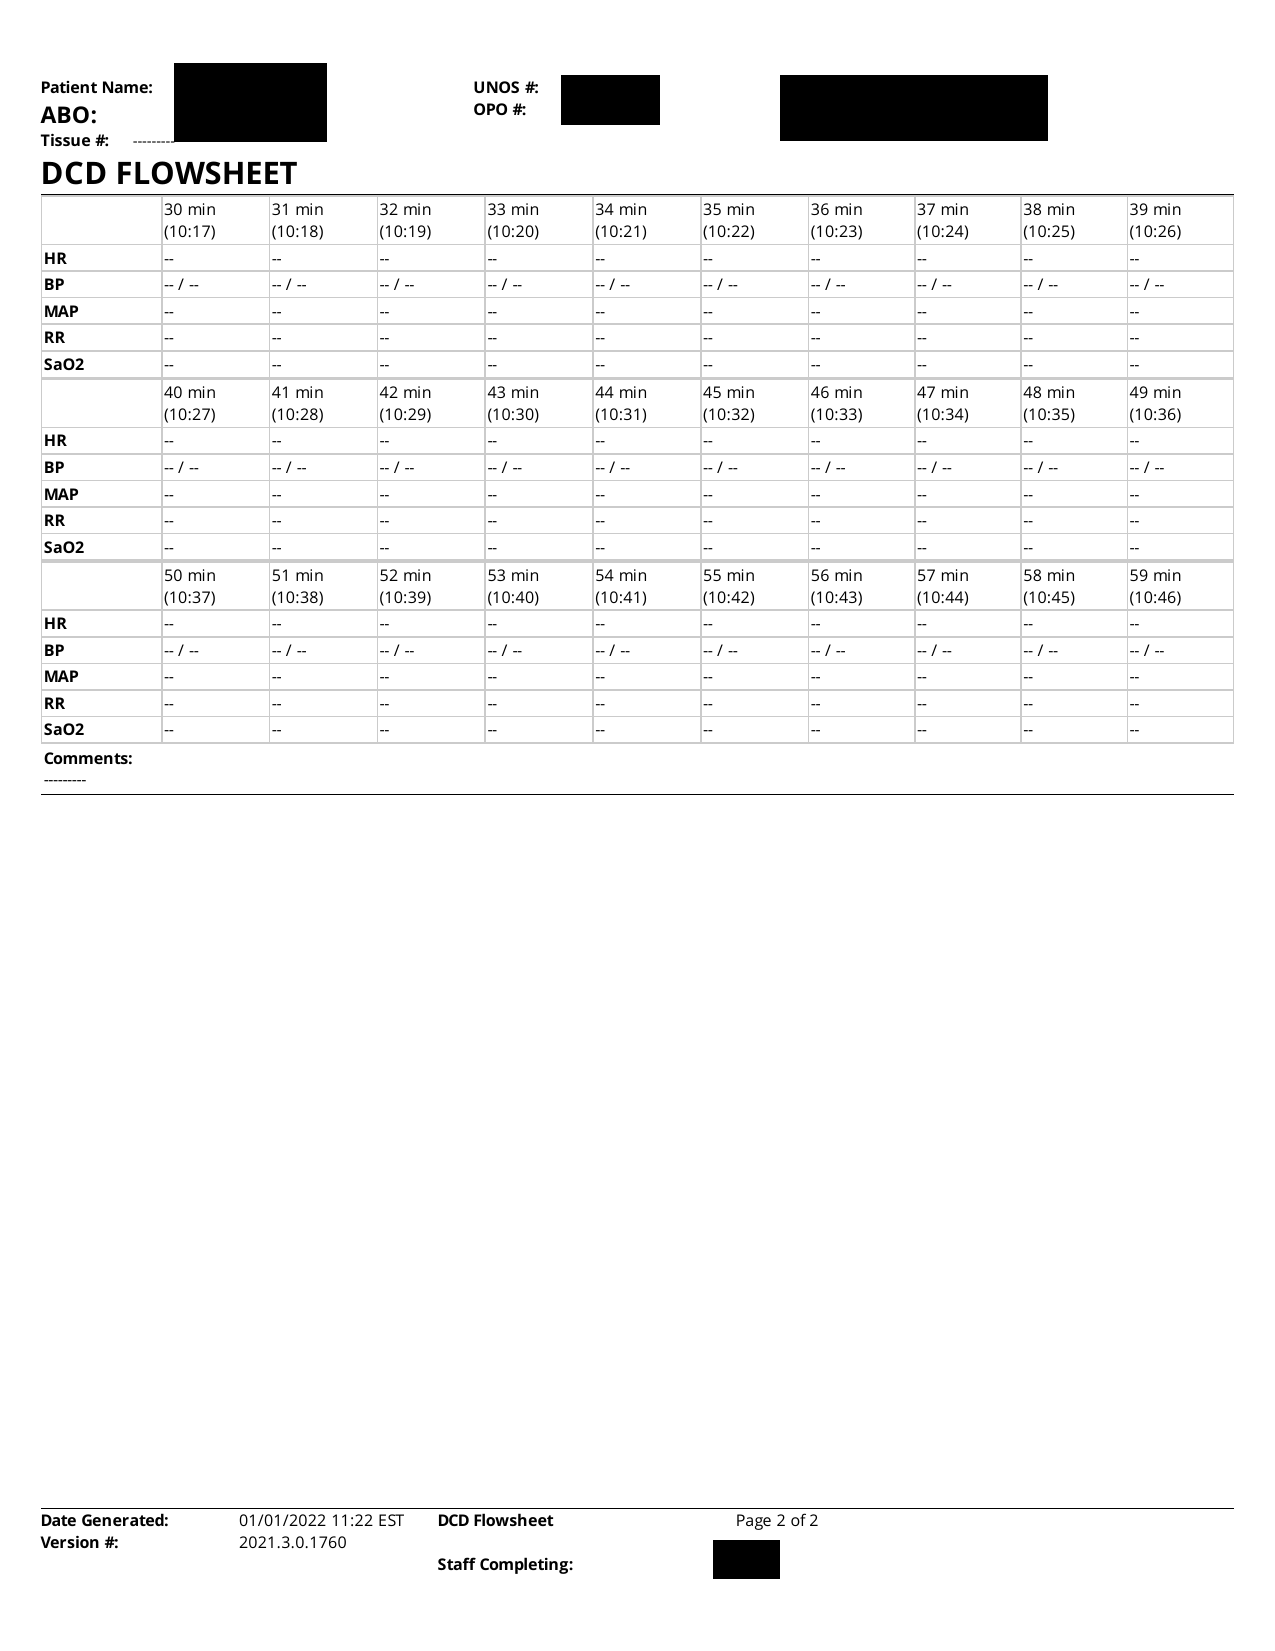
The PDF attachments of interest in the case of DCD donors include the DCD Flowsheet shown in Figure 1. The main data in this form is a time series representing vital signs of a donor in the agonal phase, to be used as predictor of the organ damage, and ultimately determines the graft survival and durability.
Extraction of the time series from PDF documents consists of complex tasks. The textual data can be extracted from PDF in a straightforward fashion (without OCR), and is 100% accurate (in the absence of software glitches and human error). For this task we use open software written in Java, PDFBox, along with an enhancement of the PDF text extraction PDFLayoutTextStripper. This software extracts formatted text. Unlike the software provided inside PDFBox called PDFTextStripper, the enhanced version preserves the layout of the text on the page, thus allowing us to sufficiently correct page segmentation (e.g., discovery of table boundaries). It should be mentioned that PDF is a rich format, which allows storing data tables in native PDF tables. However, these mechanisms are not used in the PDF attachments. The reason can be traced to the fact that the original document is in the Microsoft Word format (.docx) and the PDF is a product of exporting the document to PDF file format. Multiple tools are used to perform the Word-to-PDF conversion, resulting in PDFs that differ internally and significantly enough to trip up schemes relying upon cutting-edge features of the PDF format. The approximation of the plain text content of the PDF preserving layout turns out to be the lowest common denominator which allows achieving almost all objectives related to data extraction.
Other data, besides the time series, includes a survey with questions with answers which are either categorical (often: Yes/No) or factual questions such as dates, person names, and volumes. The data is relatively easy to extract. The main issue is that the lack of standard formatting and many ways to refer to the same categorical variable value.

2.1 The “Checkbox Problem” and our solution
One critical problem is to decode information captured by checkbox questions. Some answers are provided as checkmarks (checked or unchecked box). For example, in the ’DCD flowsheet’ (Figure 1(a)) the question ’Heparin:’ (i.e., whether heparin was used) is answered by checking a box. While the field ’Dosage:’ and ’Time:’ are indications that heparin was used, allowing to infer the answer the question ’Heparin’ indirectly in this form, other forms make much more extensive use of checkboxes, with some forms including checkboxes on a single page. Therefore, the “Checkbox Problem” needed to be solved, and the effort spent was justified.
Ideally, the checked and unchecked box would be a part of the PDF text, as they are valid Unicode characters (Unicode characters 2610 and 2611). Unfortunately, the great majority of PDF forms containing checkboxes do not use the designated Unicode for the purpose. Instead, the checkbox is drawn by PDF drawing commands (instructions that draw parts of the box as lines, and shading portions of the box). The important observation is that PDF standards include a programming language allowing inclusion of programs with graphical output, such as the checkboxes. However, it is a very wasteful way to store binary information, such as 1 bit of data telling us whether heparin was used or not. A detailed study of the PDF in question revealed that the particular checkmark in the DCD Flowsheet form is stored in a program that requires 18,000 bits to store. Furthermore, it is virtually impossible to identify a large quantity of checkmarks by looking at the PDF as a computer program.
The approach we developed uses features of PDF and their implementations in PDFBox to our advantage. The PDF is viewed as a stream of objects, some representing textual information and some representing graphics. The two types of objects can be separated by writing a Java program using the PDFBox API. We used this capability of PDFBox to extract all textual information. The remaining graphical objects were stored in a new PDF document, which was subsequently converted to JPEG, and subjected to image processing.


The tools were provided by commercial software MATLAB, which is the main framework used in this project. MATLAB provides extensions known as “toolboxes” and the “Image Processing Toolbox” has been the tool of choice for decades for tasks such as image segmentation. The ability to detect and classify “objects” in images based on diverse criteria is provided by the functions bwconn (detector of connected components in monochrome images), regionprops (an extensive object feature extractor). We suppressed the table boundaries based on the fact that they are gray rather than black, by using command imbinarize. While this command is very useful in analyzing OCR-based documents, in our case we can just use thresholding to eliminate table boundaries. Finally, the checked and unchecked boxes can be easily distinguished, by setting a threshold for the number of foreground pixels (obviously, checked boxes have many more foreground pixels). Figure 2 shows the image with all graphical objects, and the result of its binarization.
3 Regular languages, grammars and regular expressions
The PDF attachments and medical forms in general present an interesting case of a restricted domain language. Natural language processing (NLP) and computer science (theory of compilation) has made an extensive use of regular grammars, a relatively simple mechanisms for capturing syntax of relatively simple languages. Our method of parsing the documents in question is based on the premise that medical forms can be accurately parsed by regular grammars.
In large problems, such as ours, we are dealing with dozens of medical form types, with many variations amongst them. Therefore, it is important to streamline the process of constructing form-specific regular grammars. In our work to date we constructed them mostly “by-hand”. A rough algorithm is this:
-
1.
Extract plain text of a page of a document
-
2.
Note fixed text (queries, table headings, etc.)
-
3.
Note the data type of the variable portions of the form and construct a regular expression that captures their structure best. This includes numerical data, dates, names, etc.
-
4.
Try parsing a representative sample of documents in question
-
5.
Identify failures, repeat.
Typically, after several iterations of this process most documents () are matched and parsed correctly. The byproduct of parsing is assigning semantic values to the patterns representing the variable portions of medical forms, i.e. user input. The process of mapping the obtained values to a database is relatively straightforward.
There are two main ways to represent regular grammars:
-
1.
use BNF notation;
-
2.
use regular expression.
In applications like ours, the approach based on constructing regular expression appears more productive. As an example, the regular expression in Table 1 matches the text at top of the first page of the DCD flowsheet (“PRE-OPERATIVE MANAGMENT” section). Reading and understanding this page-long regular expression is a daunting task. It should be noted that there are two possible approaches:
-
1.
Top down, as described above, where variable portions of the text are replaced with small regular expressions.
-
2.
Bottom up approach, where regular expressions are constructed for smaller portions of the text, such as lines of text, and combined
We found the bottom-up approach quicker when building the expressions “by hand”. The term “by hand” does not accurately reflect the process, as in practice we developed a computer program that writes the regular expression in Table 1.


The regular expression, such as the one in Table 1 is of tremendous value because it is a concise and readable (with some practice), description of a language parser. This description allows to complete the task of parsing with one line of code using MATLAB (and other high-level software environments). E.g., in MATLAB the code is this
The system builds a data structure which binds named tokens, such as ’(?<extubated>)’, ’(?<heparine_dosage>)’, etc., to their semantic values set by user when filling out the form, located at the lines 3 and 4 in the JSON output of Table 2.
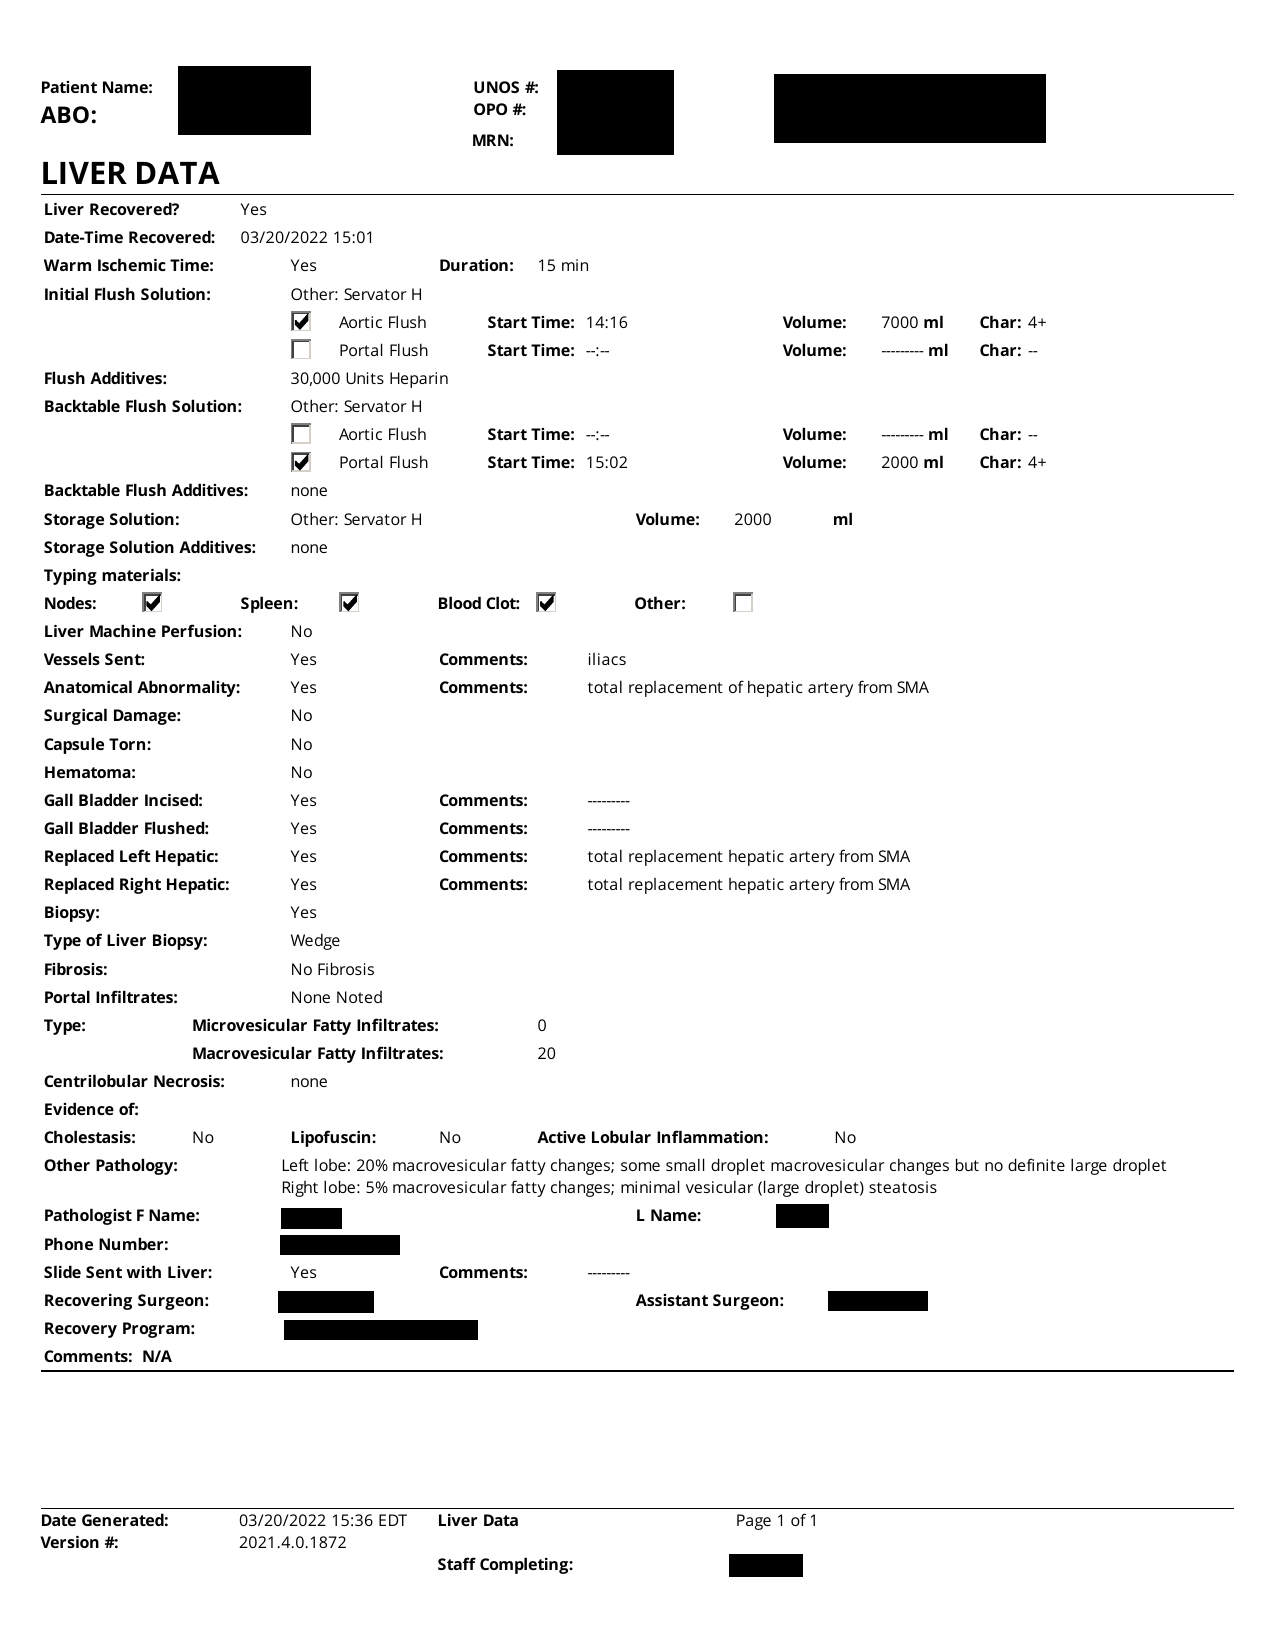
4 A case study: extraction of liver data
An example of a form entitled “LIVER DATA” is shown in Figure 3. As we can see, the form is similar to the “PRE-OPERATIVE MANAGMENT” section of the DCD Flowsheet. The notable difference is the presence of 8 checkboxes. To correctly decode this form we must decode the content of the checkboxes, as the status of the checkmark cannot be inferred from the textual information in the form. The method we outlined for the DCD Flowsheets works well here and the block of checkboxes can be seen in Figure 3(c). It should be noted that MATLAB software scans objects left-to-right and then top-down, resulting in the specific ordering of checkboxes. It should be noted that although checkboxes in the PDF file are “perfect” and resolution-independent in the PDF file, they must be rendered (in this case, the resolution is 300dpi) and binarized, which results in minor artifacts. However, all checkboxes are approximately 80-by-80 images, and the threshold of 2500 foreground pixels separates the checked from unchecked checkboxes well.
5 Database Schema and preparing for data analysis
Data is analyzable if it is amenable to statistical analysis. The process of data preparation and normalization encompasses
-
1.
Identification of captured variables.
-
2.
Classification of variables into common classes: quantitative, ordered categorical, unordered categorical.
In addition, to capture tens to hundreds of millions of records present in the dataset we need to design a database schema which will permit efficient statistical analysis and be suitable for machine learning.
It is straightforward to identify the variables, as they closely correspond to the fields present in the forms. This leaves the problem of naming the variables that promotes analysis and is compatible with other available databases. An example of a database table with adopted variable naming conventions is presented in Table 3. The variable names are chosen to work well as “identifiers” in most programming languages. However, SQL allows any naming convention by using double quotes: any string is a valid identifier (table column name) as long as it is quoted with double quotes (").
We represented the time series data by a typical table which stores time as one of the variable. It is noted that handling time in the PDF attachments is far from perfect, because handling time correctly is a difficult problem due to varying standards and daylight saving time.
| Minute | Time | HR | BP_Systolic | BP_Diastolic | MAP | RR | SaO2 |
|---|---|---|---|---|---|---|---|
| 0 | 2022-01-01 09:47 EST | 100 | 170 | 87 | 115 | 12 | 88 |
| 1 | 2022-01-01 09:48 EST | 108 | 191 | 97 | 128 | 27 | 70 |
| 2 | 2022-01-01 09:49 EST | 111 | 203 | 102 | 136 | 33 | 38 |
| 3 | 2022-01-01 09:50 EST | 102 | 117 | 68 | 84 | 28 | 0 |
| 4 | 2022-01-01 09:51 EST | 88 | 96 | 63 | 74 | 8 | 0 |
| 5 | 2022-01-01 09:52 EST | 54 | 72 | 49 | 57 | 0 | 0 |
| 6 | 2022-01-01 09:53 EST | 0 | 0 | 0 | 0 | 0 | 0 |
| 7 | 2022-01-01 09:54 EST | 0 | 0 | 0 | 0 | 0 | 0 |
| 8 | 2022-01-01 09:55 EST | 0 | 0 | 0 | 0 | 0 | 0 |
| 9 | 2022-01-01 09:56 EST | 0 | 0 | 0 | 0 | 0 | 0 |
| 10 | 2022-01-01 09:57 EST | 0 | 0 | 0 | 0 | 0 | 0 |
| 11 | 2022-01-01 09:58 EST | 0 | 0 | 0 | 0 | 0 | 0 |
| 12 | 2022-01-01 09:59 EST | 0 | 0 | 0 | 0 | 0 | 0 |
| 13 | 2022-01-01 10:00 EST | 0 | 0 | 0 | 0 | 0 | 0 |
| 14 | 2022-01-01 10:01 EST | NaN | NaN | NaN | NaN | NaN | NaN |
| 15 | 2022-01-01 10:02 EST | NaN | NaN | NaN | NaN | NaN | NaN |
| 16 | 2022-01-01 10:03 EST | NaN | NaN | NaN | NaN | NaN | NaN |
| 17 | 2022-01-01 10:04 EST | NaN | NaN | NaN | NaN | NaN | NaN |
| 18 | 2022-01-01 10:05 EST | NaN | NaN | NaN | NaN | NaN | NaN |
| 19 | 2022-01-01 10:06 EST | NaN | NaN | NaN | NaN | NaN | NaN |
| 20 | 2022-01-01 10:07 EST | NaN | NaN | NaN | NaN | NaN | NaN |
The data from the “PRE-OPERATIVE MANAGMENT” portion of the DCD Flowsheet form require a second table. Thus, one relatively short form may leads to 2 or more tables in the target database. This table has a large number of mostly categorical variables and is best presented in a format which lists variables vertically rather than horizontally, such as JSON shown in Table 2. Another objective of generating JSON is to confirm that our data can be stored in JSON-oriented databases, such as MongoDB.
It should be noted that the data extracted from the PDF attachements is captured in native MATLAB datastructures, which is the directly produced intermediate format resulting from MATLAB programming. Subsequently, APIs have been constructed, so that we can export the data in various formats. The format of the exported data is compatible with industry-standard RDBMS systems and, at the time of this writing, the relational database consists of 18 tables, quickly growing as new types of medical forms are incorporated. Currently implemented forms are identified by their titles:
-
1.
“DCD FLOWSHEET”
-
2.
“PRE-OPERATIVE MANAGMENT” (separate table holding a portion of the “DCD Flowsheet”)
-
3.
“FLOWSHEET”
-
4.
“KIDNEY PERFUSION FLOW SHEET”
-
5.
“LIVER DATA”
-
6.
“REFERRAL WORKSHEET”
The form with title “FLOWSHEET” is actually a collection of subforms, which we mapped to separate database tables:
-
1.
“VITAL SIGNS”
-
2.
“VENT SETTINGS”
-
3.
“INTAKE”
-
4.
“Medications Dosage”
-
5.
“OUTPUT”
-
6.
“Comments”
The remaining tables consist of book-keeping data, such as patient information, document version information, and timestamps when document was generated.
This data is then exported using MATLAB built-in interfaces to the following data formats
-
1.
SQL database (we’re using SQLite via a JDBC driver).
-
2.
MongoDB using MATLAB wrapper around ’mongoc’, which is a C-based API for MongoDB, and JSON generated by MATLAB command ’jsonencode’.
-
3.
Plain SQL file obtained by exporting the SQLite database to SQL (equivalent to a complete database backup).
-
4.
CSV, suitable for a quick export of individual data tables.
6 Highlights of processing
Soteria is a HIPAA-compliant HPC system, which holds the OPTN dataset (HIPAA-compliance is mandated). The system features 96 CPU and GPU (currently not used in our project), running a flavor of Linux. The software is build on top of MATLAB and its add-on packages called Toolboxes. Full version of MATLAB with toolboxes is a rich programming environment. When installed, it occpuies 20-30 GB of disk space. We call Java libraries, such as PDFBox and in-house built Java packages, from MATLAB, thanks to a very functional MATLAB-Java interface.
As an example, as 36-page PDF attachment is processed in seconds on a single CPU. This size is representative of the avarage size of an attachment, but they widely vary in size. Thus, the 2022 dataset may take seconds, or hours. Given that files can be processed in parallel (“trivial parallelism”) the real time of processing can be reduced to as little as hours. In practice, the time is approximately of that because many attachments can be skipped (e.g., image-based PDFs).
It is clear that software performance is not an issue, as the entire national organ transplant dataset can be processed in hours, i.e. roughly 3 days. Hence, our system architecture is suited to fully addressing the problem at hand.
7 Image-based PDF
The methodology for image-based PDF is different, as it required OCR. OCR, by its nature, does not recover text with absolute accuracy, but our preliminary results indicate that, combined with NLP techniques (e.g., a custom spell-checker) and custom training on the fonts that are actually used in the OPTN forms, we demonstrated near-100% accuracy on selected forms, e.g, “RENAL DATA” which contains detailed kidney anatomy information. In future papers we will cover image-based PDF in more detail.
8 Large Language Models
Large Language Models (LLM) are gaining prominence due to the launch of ChatGPT. The data extracted from PDF contains blocks of free-form text containing valuable information. Incorporation of LLMs into our software is ongoing, and will be present the results in future papers.
9 Conclusions
In U.S. Donor data has been stored in OPTN’s DonorNet as each donor’s profile as individual PDF attachments since 2008. With 57 OPOs using over 25 different forms to capture kidney anatomy and pathology reporting, Over 1 million PDF attachments for 135,000 deceased donors covering 2008 to 2021 are identified.
The article discusses a methodology for extracting and analyzing data from the PDF attachments, specifically focusing on medical forms like DCD flowsheets. The process involves converting the PDF documents into analyzable data formats, which are then subjected to image processing and regular grammar-based parsing.
Acknowledgement: The data reported here been supplied by UNOS as the contractor for the Organ Procurement and Transplantation Network (OPTN). The interpretation and reporting of these data are the responsibility of the author(s) and in no way should be seen as an official policy of or interpretation by the OPTN or the U.S. Government.
This study used data from the Organ Procurement and Transplantation Network (OPTN). The OPTN data system includes data on all donor, wait-listed candidates, and transplant recipients in the US, submitted by the members of the Organ Procurement and Transplantation Network (OPTN). The Health Resources and Services Administration (HRSA), U.S. Department of Health and Human Services provides oversight to the activities of the OPTN contractor.
References
Bibliography & References Cited
- [1] Yan Han Marek Rychlik “Extracting Semantics with text from PDFs”, In preparation, 2023
- [2] Corey Brennan et al. “Impact of warm ischemia time on outcomes for kidneys donated after cardiac death Post-KAS” In Clinical transplantation 34.9 Denmark: Wiley Subscription Services, Inc, 2020, pp. e14040–n/a DOI: 10.1111/ctr.14040
- [3] Dustin Carpenter et al. “Procurement Biopsies in the Evaluation of Deceased Donor Kidneys” D.C. and S.A.H. contributed equally to this work. In Clinical journal of the American Society of Nephrology 13.12 United States: American Society of Nephrology, 2018, pp. 1876–1885 DOI: 10.2215/CJN.04150418
- [4] Anna J Dare, Gavin J Pettigrew and Kourosh Saeb-Parsy “Preoperative Assessment of the Deceased-Donor Kidney: From Macroscopic Appearance to Molecular Biomarkers” In Transplantation 97.8 United States: by Lippincott Williams & Wilkins, 2014, pp. 797–807 DOI: 10.1097/01.TP.0000441361.34103.53
- [5] D. Gerber et al. “DonorNet and the Potential Effects on Organ Utilization” Note on sources: The articles in this report are based on the reference tables in the 2009 OPTN/SRTR Annual Report. Table numbers are noted in brackets and may be found online at In American journal of transplantation 10.4p2 Malden, USA: Blackwell Publishing, 2010, pp. 1081–1089 DOI: 10.1111/j.1600-6143.2010.03036.x
- [6] John Gill et al. “Use and Outcomes of Kidneys from Donation after Circulatory Death Donors in the United States” In Journal of the American Society of Nephrology 28.12 United States: American Society of Nephrology, 2017, pp. 3647–3657 DOI: 10.1681/ASN.2017030238
- [7] S Ali Husain et al. “Number of Donor Renal Arteries and Early Outcomes after Deceased Donor Kidney Transplantation” In Kidney360 2.11, 2021, pp. 1819–1826 DOI: 10.34067/KID.0005152021
- [8] S. Husain et al. “Impact of Deceased Donor Kidney Procurement Biopsy Technique on Histologic Accuracy” In Kidney international reports 5.11 United States: Elsevier Inc, 2020, pp. 1906–1913 DOI: 10.1016/j.ekir.2020.08.004
- [9] Anke Keijbeck et al. “The Association Between Macroscopic Arteriosclerosis of the Renal Artery, Microscopic Arteriosclerosis, Organ Discard, and Kidney Transplant Outcome” In Transplantation 104.12 United States: Copyright Wolters Kluwer Health, Inc. All rights reserved, 2020, pp. 2567–2574 DOI: 10.1097/TP.0000000000003189
- [10] Krista L. Lentine, Bertram Kasiske and David A. Axelrod “Procurement Biopsies in Kidney Transplantation: More Information May Not Lead to Better Decisions” In Journal of the American Society of Nephrology 32.8, 2021, pp. 1835–1837 DOI: 10.1681/ASN.2021030403
- [11] Krista L. Lentine et al. “Variation in use of procurement biopsies and its implications for discard of deceased donor kidneys recovered for transplantation” This study was approved by the Saint Louis University Institutional Review Board. Individual participant deidentified data will not be shared by the authors due to restrictions of Data Use Agreements. SRTR registry data can obtained from the SRTR. In American journal of transplantation 19.8 United States: Wiley Subscription Services, Inc, 2019, pp. 2241–2251 DOI: 10.1111/ajt.15325
- [12] A. Massie, S. Zeger, R. Montgomery and D. Segev “The Effects of DonorNet 2007 on Kidney Distribution Equity and Efficiency” In American journal of transplantation 9.7 Malden, USA: Blackwell Publishing, 2009, pp. 1550–1557 DOI: 10.1111/j.1600-6143.2009.02670.x
- [13] “Public Law 98-507-Oct.19, 1984. The National Organ Transplant Act” Accessed on 9/24/2022 URL: https://www.congress.gov/98/statute/STATUTE-98/STATUTE-98-Pg2339.pdf
- [14] “The UNOS STAR Deceased Donor SAF file” accessed on 9/21/2022
- [15] EL Tierie, J.I Roodnat and F Dor “Systematic Surgical Assessment of Deceased-Donor Kidneys as a Predictor of Short-Term Transplant Outcomes” In European surgical research 60.3-4, 2019, pp. 97–105
- [16] Samuel J Tingle et al. “Machine perfusion preservation versus static cold storage for deceased donor kidney transplantation” Editorial Group: Cochrane Kidney and Transplant Group. In Cochrane database of systematic reviews 2019.3 Chichester, UK: John Wiley & Sons, Ltd, 2019, pp. CD011671–CD011671 DOI: 10.1002/14651858.CD011671.pub2
- [17] C.. Wang, J.. Wetmore, G.. Crary and B.. Kasiske “The Donor Kidney Biopsy and Its Implications in Predicting Graft Outcomes: A Systematic Review” In American journal of transplantation 15.7 United States: Wiley Subscription Services, Inc, 2015, pp. 1903–1914 DOI: 10.1111/ajt.13213
- [18] Annemie Woestenburg, Jacques Sennesael, Jean-Louis Bosmans and Dierik Verbeelen “Vasculopathy in the kidney allograft at time of transplantation: impact on later function of the graft” In Transplantation 85.7 Suppl, 2008, pp. S10–S18 DOI: 10.1097/TP.0b013e318169c311