Large bubble drives melting in circular DNA
Abstract
We investigate the melting transition of non-supercoiled circular DNA of different lengths, employing Brownian dynamics simulation. In the absence of supercoiling, we find that melting of circular DNA is driven by a large bubble, which agrees with the previous predictions of circular DNA melting in the presence of supercoiling. By analyzing sector-wise changes in average base-pair distance, our study reveals that the melting behavior of circular DNA closely resembles that of linear DNA. Additionally, we find a marked difference in the thermal stability of circular DNA over linear DNA at very short length scales, an effect that diminishes as the length of circular DNA increases. The stability of smaller circular DNA is linked to the occurrence of transient small bubbles, characterized by a lower probability of growth.
I Introduction
DNA serves as the repository of genetic information, encompassing the instructions essential for the development, survival, and reproduction of all living organisms, ranging from the simplest prokaryotes, such as bacteria [1, 2] and viruses [3, 4], to the more intricate eukaryotes, including humans [5]. Prokaryotic DNA takes the form of a continuous loop without loose ends, characterized by its circular structure. On the other hand, eukaryotes typically exhibit linear DNA with distinct ends. Additionally, recent research findings indicate that extrachromosomal circular DNAs (eccDNAs) are present independently of linear chromosomal DNA in eukaryotes as well [6, 7]. The stability of DNA depends on the a number of physical and chemical parameters, such as the pH value of the environment [8], salt concentration, temperature [9] as well as mechanical forces [10, 11]. The thermal denaturation transition, i.e. melting [12] of DNA, in particular, has been studied for the last 50 years, both in its biological specificity, as well as a statistical and polymer physics problem, due to the greater accessibility of heating experiments in vitro and the importance of DNA melting to the polymerase chain reaction [13]. The melting of linear DNA has been understood theoretically, largely as a sharp first-order phase transition [14]. The linear DNA melting is driven by the replication fork or the Y-fork, since the base-pairs at the ends are entropically favoured to open up. However, the thermal melting of circular DNA is comparatively less understood, although the importance of circular DNA in human pathology [15] is becoming increasingly clear.
In the absence of free ends in circular DNA, the melting behavior is controlled by the presence of bubbles. The majority of theoretical studies have investigated circular DNA within the framework of topological constraints, where the twisting and bending dynamics of DNA are inherently interconnected [16, 17, 18, 19, 20]. This is because the Calugareanu-Fuller-White theorem [21] places a strict constraint on the linking number difference of any circular DNA system. Any flexibility gained by one part of the system by opening up a few base-pairs will have to be compensated by the twist and writhe of other parts of the molecule [22], where the base-pairs are hard to open up. These constraints, relaxed in linear DNA, result in a distinct melting behavior – the transition in topologically constrained DNA, such as closed circular viral DNA, is far less abrupt compared to that in linear DNA [23]. Studies have demonstrated that the competition between melting and local supercoiling induces phase coexistence of denatured and intact phases at the single-molecule level, contributing to the broadening of the transition in circular DNA [24, 18].
The bubble-mediated melting theory shows that the nature of DNA melting is reliant on the non-extensive logarithmic contribution to the entropy, which is of the form for a bubble of length with as the bulk entropy per unit length and is the reunion exponent for bubble formation [25, 26, 27, 28]. In this scheme, a circular DNA under overtwist and supercoiling has been shown to undergo a continuous melting transition with the emergence of a macroscopic loop at [29, 30]. The bubble length grows monotonically with temperature until a maximum of half the chain is denatured, as the topological constraints prevent complete melting of the DNA molecule, unlike the linear case. Experiments conducted on supercoiled molecules also indicate that only one denatured bubble occurs per molecule [17]. Moreover, no stable bubbles could be detected when supercoiling was absent due to their short lifetime [31, 17, 32], although these measurements were made away from melting due to experimental aims and constraints. In the absence of supercoiling, one would also expect complete denaturation of the molecule, similar to the prediction of a diverging bubble size at criticality in the original Poland-Scheraga (PS) model.
It is important to acknowledge the existence of circular DNA structures without helical intertwining or topological linkages between strands, such as the singly-nicked polyoma form II DNA [4, 23] and relaxed plasmid DNA [17], and multiple other studies have both proposed and found evidence for topologically unconstrained closed circular DNA [33, 34, 35]. These structures provide an opportunity to unravel the effects of two separate kinds of constraints that could be applied to a closed circular DNA: (a) the helical winding of the two strands and the consequent torsional stress and supercoiling, and (b) the topological constraint of closure of the two covalent bonded strands individually while in the bound state. In the absence of a constraint of the first kind, which may be relaxed either via nicking or topoisomerase, the thermal behaviour and sedimentation analysis of circular DNA was at first seen to be very similar to linear DNA [36, 23]. One would generally expect that singly-nicked circular DNA will undergo melting due to the fraying of its ends originating from the nicked site and results in melting similar to that observed in linear DNA. However, the specific impact of dual covalent bond closure alone in relaxed circular DNA melting, as compared to linear DNA, remains open for investigation.
To address this, we use coarse-grained Brownian dynamics simulations to study the melting transition in non-supercoiled circular and linear DNA. Section II describes our model and the details of our simulations. Section III describes the melting mechanism employed in circular DNA, and the transient involvement of bubbles in the melting process. We summarize our findings in Section IV. Some of the details are provided in the Supplementary Information in the form of figures.
II Model and Method
We utilize a simplified, low-resolution model for homopolymeric DNA composed of two complementary strands [37]. The energy function governing the interactions of base-pair DNA in this model is . Here, and represent the potential functions characterizing each individual DNA strand, given by
| (3) | |||||
| (4) |
The distance between beads is defined as , where and are the position vectors of beads and , respectively with . We use dimensionless distances with and . The energy parameters in the Hamiltonian are in units of where is the Boltzmann constant (set to ) and is the temperature measured in reduced units. The harmonic spring with dimensionless spring constant connecting adjacent beads along the strand, is given by the first term on the rhs of Eq. 4. The second term in Eq. 4 with spring constant is responsible for connecting the first and last beads on each strand. The third term introduces a repulsive potential that prevents the overlap of non-native pairs of monomers in strand-I and strand-II [38, 39, 40]. The two complementary strands of DNA interact via the following potential
| (5) | |||||
The base pairing between strand-I and strand-II is considered using the first term on the rhs of Eq. 5 with . The native base-pair contacts (same of both the chains [38, 37]) give rise to the ladder like structure of DNA. The second repulsive term of the potential energy in Eq. (5) prevents overlapping of non-native pairs of monomers of strand-I and strand-II [37, 38, 39, 40].
The dynamics of this system is governed by the Brownian equations, given by
| (6) |
Here, is the conservative force and is the sum of , and . is the friction coefficient, here set to 50, and is the random force, a white noise with zero mean and correlation . These equations of motion are integrated via the Euler method with time step for iterations at every temperature. To investigate how topology affects the DNA melting process, chains were subjected to topological constraints by setting , effectively creating circular DNA. The melting of linear DNA, which lacks topological constraints () has been studied extensively [41, 42, 43, 44, 45, 46, 47] and provides a platform for investigating the influence of topology on the melting of DNA.

In the absence of a free end, circular DNA can undergo melting through the formation of bubbles. To obtain a microscopic view of the bubbles involved in the melting of circular DNA devoid of supercoiling, we partitioned the entire chain into three equal sections and monitored sector-wise change in average base-pair distance, denoted as , and , relative to the initial bound state. The sector wise measurements enable the detailed characterization of large or small bubbles within the system. If one or two segments play a substantial role, with or assuming a significant magnitude, while takes on a comparatively smaller value, an anticipated structure involves a large bubble, resembling the configuration in Fig. 1a. Conversely, if each segment contributes roughly equally i.e. , the resulting structure is multiple small bubbles distributed uniformly along the chain in Fig 1b. Hence, the melting of circular DNA can be characterized by two types of possible pathways : (i) Type-I, marked by the emergence of a large bubble, and (ii) Type-II, where small bubbles uniformly form across the entire chain. As temperature increases, these bubbles grow, which eventually leads to the melting of the whole circular DNA. It would be interesting to investigate whether the melting of circular DNA (without supercoiling) follows the Type-I pathway (distinguished by a large bubble) as proposed in earlier studies for supercoiled DNA [18, 17, 30] or if it employs the Type-II pathway, especially in the presence of small bubbles.
III Results
III.1 Melting and Sectorwise Basepair Opening
In the context of DNA melting, the fraction of fully bound base pairs serve as an order parameter. In the fully bound state, where all base pairs remain intact, takes on a value . As the temperature increases, the fraction of fully bound base pairs decreases, indicating a transition toward a more disordered (unbound) state. A base-pair is classified as bound when its native base-pair-distance is below the standard cutoff distance of 1.5. A completely unbound state is characterized by . The widely used definition for melting point is a temperature at which half of the base-pairs of the DNA chain are open. The peak position in the specific heat vs temperature curve also gives the melting temperature (). Here, we examined the melting of DNA chains of different lengths (18bp, 36bp, 72bp, and 144bp), both in the presence and absence of the constraint . We observe that the fraction of fully bound base pairs goes from 1 to 0 (see Figure S1 in Supplementary Information). We note that the melting temperature () of circular DNA is noticeably higher than that of linear DNA when considering a length of bp and bp. Nevertheless, as the chain size increases (bp, bp), this distinction in for circular and linear DNA appears to diminish (see Figures S1 and S2 in Supplementary Information). Although both ends of DNA strands are covalently linked in our model, our findings are nevertheless in accordance with experimental observations that circular polyoma form II viral DNA (singly nicked) shares the same melting temperature as linear T7 DNA [23], since both systems are torsionally relaxed and therefore devoid of supercoiling.


In order to probe the melting mechanism, we characterize the Type-I and Type-II transitions quantitatively. The Type-I transitions require that, at least one sector should contribute, on average, approximately of the total change in average base-pair-distance ), while the combined contribution of the other two sectors should be approximately of the R in the transition region. The transition region is defined as the region where the number of intact base-pairs decreases from to . In a Type-II transition, each sector must contribute over of the R for the chain in the transition region. We conduct 100 independent simulations each, for both circular and linear DNA of different lengths, and classify each trajectory using the same criteria for all lengths. The results are shown in Fig. 2. Our findings suggest that the melting behaviour of circular DNA (bp, bp, bp and bp) is predominantly characterized by Type-I transitions, marked by the formation of a substantially large bubble. We also investigated the melting behavior of linear DNA by employing sector-wise change in average base-pair distance measures. We observe that the melting process of linear DNA is also governed by Type-I transitions (see Figure S3 in Supplementary Information).
To explore the microscopic picture in Type-I pathway, we examine representative trajectories for circular and linear DNA (bp), depicted in Fig. 3. The three sectors of circular/linear DNA are represented using three distinct colors: grey, orange, and green. At the onset of the transition, most base-pairs remain intact, with the total number of bound base pair fraction close to 1 (Fig 3a). As expected, the corresponding sectorwise changes in average base-pair-distance , , and are approximately 0 (Fig 3b). The resulting structure corresponds to bound circular DNA. As time progresses, the fraction of intact base pairs starts decreasing (Fig 3a). The begins to exhibit an increase in magnitude, followed by a rise in , while remains near zero (Fig 3b). A bubble emerges in the orange sector and grows substantially (snapshot I in (Fig 3c), characterized by a large , while a smaller bubble forms in the green sector, exhibiting a slightly reduced with unchanged i.e. intact grey sector. As time progresses, the bubble in green sector also grows along with bubble in orange sector(snapshot II in (Fig 3c). At later times, the number of bound base pairs approaches zero, and approach their maximum values, finally followed by an increase in as well (Fig 3a-b). This continues until the whole DNA gets separated (snapshot III in Fig 3c). In linear DNA, at the onset of the transition region, all base-pairs remain intact (Fig 3d), and the breakage of base pairs initiates from the free ends 3e, 3f), due to high end-entropy. As time progresses, a large Y-fork originates in the grey and orange sectors (see snapshot-I Fig 3f) with some broken base-pairs in the green sector as well, representing a smaller Y-fork at the opposite end of the linear DNA. The change in average base-pair distance and fraction of bound base-pairs plots (Fig. 3d, e) also indicate the closure of one Y-fork at later times and large Y-fork at other end (snapshot-II in Fig. 3f), as evidenced by smaller values of and . Therefore, the melting process of linear DNA occurs through the Y-forks, as previously investigated [47, 12, 14].
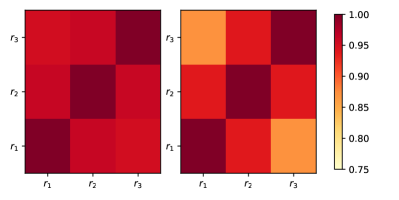
We also sought correlations between , and to elucidate the statistical behavior of DNA melting for both circular and linear DNA. The correlation between different sectors shows uniformity (Fig. 4a) for circular DNA. The melting process in circular DNA is characterized by the emergence of large bubbles in two adjoining segments. Since these large bubbles can emerge between any two segments, the time- and ensemble-averaged correlation map will be uniform overall. In the case of linear DNA, the correlation map indicates that the two ends are less correlated compared to the adjacent sectors (see Fig. 4b). A Y-fork structure can form at either end of DNA due to its symmetry, and the formation is equally likely from any side, but not usually simultaneously in both (see Figure S4 of Supplementary Information). Therefore, melting of linear DNA usually takes place by utilizing single large Y-fork.
III.2 Stable Bubbles and Typical Behaviour
The fixed linking number constraint inherent in supercoiled circular DNA may lead to the dismissal of the possibility of Type-II melting therein. Our current investigation into circular DNA devoid of supercoiling also does not reveal the presence of Type-II melting. This prompts an inquiry into why Type-II melting, typically associated with multiple small bubbles, is absent in circular DNA devoid of supercoiling.

To address this, we extend an algorithm by Hillebrand et. al. [48] and examine the probability of occurrence of bubbles of different sizes in circular DNA of various lengths (bp, bp, bp, bp). Our findings indicate that smaller bubbles exhibit a higher occurrence probability compared to larger bubbles as shown in by solid black line in Fig. 5. However, it’s important to note that static measurements of bubble size provide no insight into the dynamics of bubbles, such as whether they will grow or shrink over time. For that, we track the dynamical behaviour of bubbles over time. If a bubble of a given size exists at time , we examine what this bubble does at the next recorded time-step (for us, timesteps) – does it grow, does it shrink or does it stay the same length?
To do this, we set up three counters for any bubble of length (i.e. consecutive broken bonds) – these three counters denote the number of growing, maintaining or shrinking events for any such bubble. We track every instance of a bubble of length appearing at time , and the subsequent behaviour of this bubble at time . We consider a bubble at time to be the same bubble at if they share any bases. If the length of the bubble decreases, , we increment by 1. If the length remains the same, we increment by 1. If the length increases, , we increment by 1. Over an entire simulation, a bubble of size appears times, and gives the total number of occurrences of bubbles of any length throughout the chain. The ratio of to gives us the probability, or relative likelihood, of the occurrence of a bubble of length in the simulation, while the ratio of the number of growing (), maintaining () or shrinking events () to the total number of occurrences of this bubble () gives us a statistical picture of its typical behaviour, which is then further averaged over all our simulations.
Our analysis shows that larger bubbles are less likely to occur compared to smaller ones (solid black line in Fig 5), but once they do, they tend to persist or expand, while smaller bubbles are more likely to shrink (blue and red lines in Fig 5). By comparing the probabilities of bubble sustenance and shrinkage, we can find the stable bubble nucleation threshold lengths, with crossover around for certain bubble lengths, (see Figure 5). Beyond this length, bubbles are more likely to be stable and long-lived, and therefore contribute to the melting of the whole molecule. We find the threshold size for bubble growth to be bp. This is comparable to earlier studies [43, 44, 49, 46], that found nucleation thresholds to be around –bp for bubbles trapped between bound double-stranded sections in linear DNA (comparable to bubbles forming in closed circular DNA).
The statistical behaviour for various bubble sizes indicates that although multiple small bubbles (approximately ) may emerge at different times throughout the entire chain with a higher likelihood (as would be required for a Type-II transition), the simultaneous presence of a uniform distribution of large bubbles () along the chain is very unlikely, assuming that the behavior of well-separated bubbles can be considered as independent events. Thus, while Type-II melting may be anticipated for smaller-size bubbles, it is not supported by observations, as these bubbles are more likely to shrink. Ultimately, the melting of circular DNA is driven by a large bubble (Type-I), given that the homogeneous distribution of large bubbles all along the chain (Type-II) is less probable.
These results also clarify the effect of system size on the bubble dynamics in circular DNA. In smaller circular DNA molecules (bp and bp), the threshold size for bubble formation is approximately bp, constituting around of the total chain length. Bubbles smaller than this threshold size may form, but are likely to quickly shrink. Thus, increasing the temperature until a relatively larger bulge forms is necessary to initiate melting, explaining the requirement for a higher melting temperature () for bp and bp circular DNA, compared to linear DNA of the same size. However, for the larger systems we studied (bp, bp), a bubble of size bp, i.e. of the total length, is stable, can grow, and will lead to melting of the whole chain, similar to linear DNA, where Y-fork openings at the ends have a low nucleation threshold and initiate melting[43, 44](see Figure S6 in Supplementary Information for more details). As we increase the system size, the effect of the topological constraint is progressively washed out, and circular DNA starts to behave more like linear DNA.
IV Conclusions
In this paper, we investigated the thermal melting of non-supercoiled circular and linear DNA of four different lengths using Brownian dynamics simulations across a range of temperatures. Our study revealed that covalently closed circular DNA exhibits a higher melting temperature than linear DNA, particularly at smaller length scales. In circular DNA, we identified a critical minimum length threshold for bubbles, which is crucial for their growth or maintenance. Bubbles shorter than this specific threshold tend to shrink rather than maintain stability or expand. This result has significant implications as shorter DNA chains can only accommodate small bubbles, rendering the latter susceptible to shrinkage. As a result, higher temperatures are required to facilitate the formation of larger bubbles within smaller DNA chains, ultimately leading to the chain’s melting. Unlike circular DNA, there is no such restriction on threshold length scale in linear DNA. Our findings also confirmed that the melting of linear DNA occurs through Y-forks originating from either end. However, there is a weak correlation between the Y-forks at opposite ends of linear DNA, meaning that only one side predominates at any one time. We also ruled out the possibility of melting of non-supercoiled circular DNA via the proliferation of bubbles distributed along the chain. We reaffirmed that the melting of circular DNA predominantly occurs through the formation of one large bubble due to the significantly lower probability of occurrence of multiple threshold-sized bubbles along the chain compared to smaller bubbles.
Acknowledgements
GM gratefully acknowledges the financial support from SERB India for a start-up grant with file Number SRG/2022/001771. SS acknowledges the financial support from Ashoka University and Ashoka’s High-Performance-Computing Cluster.
References
- Roth and Helinski [1967] T. F. Roth and D. R. Helinski, Proc. Natl. Acad. Sci. U.S.A. 58, 650 (1967).
- Bhagavan [2002] N. V. Bhagavan, in Medical Biochemistry (Fourth Edition), edited by N. V. Bhagavan (Academic Press, San Diego, 2002) pp. 521–543.
- Tisza et al. [2020] M. J. Tisza, D. V. Pastrana, N. L. Welch, B. Stewart, A. Peretti, G. J. Starrett, Y.-Y. S. Pang, S. R. Krishnamurthy, P. A. Pesavento, D. H. McDermott, P. M. Murphy, J. L. Whited, B. Miller, J. Brenchley, S. P. Rosshart, B. Rehermann, J. Doorbar, B. A. Ta’ala, O. Pletnikova, J. C. Troncoso, S. M. Resnick, B. Bolduc, M. B. Sullivan, A. Varsani, A. M. Segall, and C. B. Buck, eLife 9, e51971 (2020).
- Vinograd and Lebowitz’ [1966] J. Vinograd and J. Lebowitz’, J. Gen. Physiol. 49, 103 (1966).
- Alberts et al. [2002] B. Alberts, A. Johnson, J. Lewis, M. Raff, K. Roberts, and P. Walter, Molecular Biology of the Cell, 4th ed. (Garland Science, 2002).
- Wahl [1989] G. M. Wahl, Cancer Research 49, 1333 (1989).
- Yan et al. [2020] Y. Yan, G. Guo, J. Huang, M. Gao, Q. Zhu, S. Zeng, Z. Gong, and Z. Xu, J. Hematol. Oncol. 13, 124 (2020).
- Ageno et al. [1969] M. Ageno, E. Dore, and C. Frontali, Biophys. J. 9, 1281 (1969).
- Wartell and Benight [1985] R. M. Wartell and A. S. Benight, Physics Reports 126, 67 (1985).
- Bhattacharjee [2000] S. M. Bhattacharjee, J. Phys. A: Math. Gen. 33, L423 (2000).
- Orlandini et al. [2001] E. Orlandini, S. M. Bhattacharjee, D. Marenduzzo, A. Maritan, and F. Seno, J. Phys. A: Math. Gen. 34, L751 (2001).
- Theodorakopoulos [2020] N. Theodorakopoulos, Statistical Physics of DNA: An Introduction to Melting, Unzipping and Flexibility of the Double Helix (World Scientific, 2020).
- Mullis and Faloona [1987] K. B. Mullis and F. A. Faloona, in Methods in Enzymology, Recombinant DNA Part F, Vol. 155 (Academic Press, 1987) pp. 335–350.
- Kafri et al. [2000] Y. Kafri, D. Mukamel, and L. Peliti, Phys. Rev. Lett. 85, 4988 (2000).
- Barreto et al. [2014] S. C. Barreto, M. Uppalapati, and A. Ray, Malays J Med Sci. 21, 4 (2014).
- Benham [1992] C. J. Benham, J. Mol. Biol. 225, 835 (1992).
- Jeon et al. [2010] J.-H. Jeon, J. Adamcik, G. Dietler, and R. Metzler, Phys. Rev. Lett. 105, 208101 (2010).
- Fosado et al. [2017] Y. Fosado, D. Michieletto, and D. Marenduzzo, Phys. Rev. Lett. 119, 118002 (2017).
- Skoruppa et al. [2018] E. Skoruppa, S. K. Nomidis, J. F. Marko, and E. Carlon, Phys. Rev. Lett. 121, 088101 (2018).
- Fosado et al. [2021] Y. A. G. Fosado, D. Michieletto, C. A. Brackley, and D. Marenduzzo, Proc. Natl. Acad. Sci. U.S.A. 118, e1905215118 (2021).
- Fuller [1978] F. B. Fuller, Proc. Natl. Acad. Sci. U.S.A. 75, 3557 (1978).
- Morozov et al. [2005] V. F. Morozov, E. S. Mamasakhlisov, A. V. Grigoryan, A. V. Badasyan, S. Hayryan, and C.-K. Hu, Physica A 348, 327 (2005).
- Vinograd et al. [1968] J. Vinograd, J. Lebowitz, and R. Watson, J. Mol. Biol. 33, 173 (1968).
- Benham [1979] C. J. Benham, Proc. Natl. Acad. Sci. U.S.A. 76, 3870 (1979).
- Poland and Scheraga [1966] D. Poland and H. A. Scheraga, J Chem Phys 45, 1464 (1966).
- Poland and Scheraga [1970] D. Poland and H. A. Scheraga, Theory of helix-coil transitions in biopolymers, Tech. Rep. (Academic Press, 1970).
- Fisher [1966] M. E. Fisher, J. Chem. Phys. 45, 1469 (1966).
- Fisher [1984] M. E. Fisher, J Stat Phys 34, 667 (1984).
- Bar et al. [2012] A. Bar, A. Kabakçıoğlu, and D. Mukamel, Phys. Rev. E 86, 061904 (2012).
- Kabakçıoğlu et al. [2012] A. Kabakçıoğlu, A. Bar, and D. Mukamel, Phys. Rev. E 85, 051919 (2012).
- Jeon and Sung [2008] J.-H. Jeon and W. Sung, Biophys. J. 95, 3600 (2008).
- Sicard et al. [2020] F. Sicard, N. Destainville, P. Rousseau, C. Tardin, and M. Manghi, Phys. Rev. E 101, 012403 (2020).
- Rodley et al. [1976] G. A. Rodley, R. S. Scobie, R. H. Bates, and R. M. Lewitt, Proc. Natl. Acad. Sci. U.S.A. 73, 2959 (1976).
- Wu and Te Wu [1996] R. Wu and T. Te Wu, Bltn Mathcal Biology 58, 1171 (1996).
- Biegeleisen [2002] K. Biegeleisen, Bull. Math. Biol. 64, 589 (2002).
- Bates et al. [2005] A. D. Bates, A. Maxwell, A. D. Bates, and A. Maxwell, DNA Topology (Oxford University Press, Oxford, New York, 2005).
- Mishra et al. [2011] G. Mishra, D. Giri, M. S. Li, and S. Kumar, J. Chem. Phys. 135, 035102 (2011).
- Mishra et al. [2013] G. Mishra, P. Sadhukhan, S. M. Bhattacharjee, and S. Kumar, Phys. Rev. E 87, 022718 (2013).
- Allen and Tildesley [2017] M. P. Allen and D. J. Tildesley, Computer Simulation of Liquids, second edition ed. (Oxford University Press, Oxford, New York, 2017).
- Frenkel and Smit [2023] D. Frenkel and B. Smit, Understanding molecular simulation: from algorithms to applications, third edition ed. (Academic Press, an imprint of Elsevier23.2651/18, London San Diego,CA Cambridge, MA Kidlington, 2023).
- Azbel [1979] M. Y. Azbel, Phys. Rev. A 20, 1671 (1979).
- Theodorakopoulos et al. [2000] N. Theodorakopoulos, T. Dauxois, and M. Peyrard, Phys. Rev. Lett. 85, 6 (2000).
- Zeng et al. [2004] Y. Zeng, A. Montrichok, and G. Zocchi, J. Mol. Biol. 339, 67 (2004).
- Ares et al. [2005] S. Ares, N. K. Voulgarakis, K. O. Rasmussen, and A. R. Bishop, Phys. Rev. Lett. 94, 035504 (2005).
- Theodorakopoulos [2008] N. Theodorakopoulos, Phys. Rev. E 77, 031919 (2008).
- Rieloff et al. [2017] E. Rieloff, S. C. C. Nunes, A. A. C. C. Pais, and M. Skepö, ACS Omega 2, 1915 (2017).
- Majumdar and Bhattacharjee [2020] D. Majumdar and S. M. Bhattacharjee, Phys. Rev. E 102, 032407 (2020).
- Hillebrand et al. [2020] M. Hillebrand, G. Kalosakas, C. Skokos, and A. R. Bishop, Phys. Rev. E 102, 062114 (2020).
- Alexandrov et al. [2009] B. S. Alexandrov, V. Gelev, S. W. Yoo, A. R. Bishop, K. O. Rasmussen, and A. Usheva, PLoS Comput Biol 5, e1000313 (2009).
Supplementary Information
“Large bubble drives melting in circular DNA”
Souradeep Sengupta, Somendra M. Bhattacharjee and Garima Mishra
Department of Physics, Ashoka University, Sonepat 131029, India
Email: [email protected]


