Joint Calibration to SPX and VIX Derivative Markets with Composite Change of Time Models
Abstract
The Chicago Board Options Exchange Volatility Index (VIX) is calculated from SPX options and derivatives of VIX are also traded in market, which leads to the so-called “consistent modeling” problem. This paper proposes a time-changed Lévy model for log price with a composite change of time structure to capture both features of the implied SPX volatility and the implied volatility of volatility. Consistent modeling is achieved naturally via flexible choices of jumps and leverage effects, as well as the composition of time changes. Many celebrated models are covered as special cases. From this model, we derive an explicit form of the characteristic function for the asset price (SPX) and the pricing formula for European options as well as VIX options. The empirical results indicate great competence of the proposed model in the problem of joint calibration of the SPX/VIX Markets.
Keywords: Time change; Lévy process; Option pricing; Consistent Modeling
1 Motivation and Formulation
1.1 Consistent Modeling Problem
By the definition from CBOE, Volatility Index (VIX), as an indicator of implied volatility in the following days, is given as
where and is the risk neutral measure of the equity market. If continuity of the asset price process is assumed, then equivalently
| (1) | ||||
where is the squared volatility of . Even though the asset price is not continuous, formula (1) only leads to a third-order error , as shown in Carr and Wu (2009). Hence the analysis below is still effective for general jump models to a large degree.
Likewise, we have the formula of VVIX, the volatility of volatility computed from VIX market:
| (2) | ||||
where is the variance of . It is important to note that the first equality holds if we believe that measure is risk-neutral in both SPX option market and the VIX market. That is, the two markets can be consistently modeled.
The problem of joint calibration for SPX market and VIX market is equivalent to (or at least incorporates) the calibration of current VIX and VVIX, which can be approximated by and , volatility and volatility of volatility respectively, if we consider a Markov setup and that is small. More generally, we have and by equation (1) and (2), where are functions determined by model parameters. Therefore, it is crucial to study the relationship of and in the problem of consistent modeling.
In the past literature on consistent modeling, there have been a lot of research on such volatility relationship. One line of work is aimed at reconstructing the widely used stochastic volatility models (SVMs) by allowing for more realistic and flexible vol-of-vol functionals. One such example is the 3/2 model in Drimus (2012) and in Baldeaux and Badran (2014). Fouque and Saporito (2018) proposed a Heston vol-of-vol model, where the vol-of-vol consists of additional stochastic factors. Additionally, following the work of Gatheral et al. (2018), authors including Bayer et al. (2016), Jacquier et al. (2018) and Gatheral et al. (2020) proposed rough volatility models in the joint calibration of stock and volatility smiles. And according to Lin and Chang (2010) and Kokholm and Stisen (2015), the role of jumps were studied and highlighted in the consistent modeling. Moreover, Papanicolaou (2022) studied the consistency condition of recovering SVMs from market models of the VIX futures term structure. Another category of models suggest a multi-factor specification of volatility. The first attempt was made by Gatheral (2008) and Bayer et al. (2013), who adopted a continuous diffusion model with double mean reverting structure. Multifactor affine specification was considered in Cont and Kokholm (2013), Cheng (2019) and Pacati et al. (2018). And Papanicolaou and Sircar (2014) considered a regime-switching Heston model, where sharp volatility regime shifts captures both volatility skews. Yuan (2020) and Bardgett et al. (2019) adopted multi-factor stochastic jump intensity models. A theoretical drawback of their models is that the variance process in their models can be negative. Finally, there is some recent research that characterizes the volatility relationship using a non-parametric framework. Guo et al. (2022) introduced a time-continuous formulation of the joint calibration problem, followed by Guyon (2020), who built a non-parametric discrete-time model that achieved exact joint calibration.
While many models above achieves satisfactory consistent modeling results, our approach, apart from having good joint calibration performance, can theoretically decoupling smiles from the two markets. Such nice interpretation of our model is achieved via time change technique by representing the vol-of-vol in a linear mixture form of and another free factor. We present the following examples to show how restrictive or implicit the volatility relationship is in certain SVMs.
Example 1 (Heston Model)
with We may compute the volatility of volatility under the assumption that approximates :
Such an inverse relationship is unrealistic for VIX and VVIX, and therefore explains the unfavorable calibration result of Heston model. In fact, empirical results show that Heston models generates downward-sloping volatility smiles in VIX market as opposed to the upward-sloping observed smile, as shown in Drimus (2012) and Baldeaux and Badran (2014). The model is poorly fitted under consistent modeling even if jump structures are incorporated, see Kokholm and Stisen (2015).
Example 2 (3/2 Model)
with By the same reasoning, we obtain
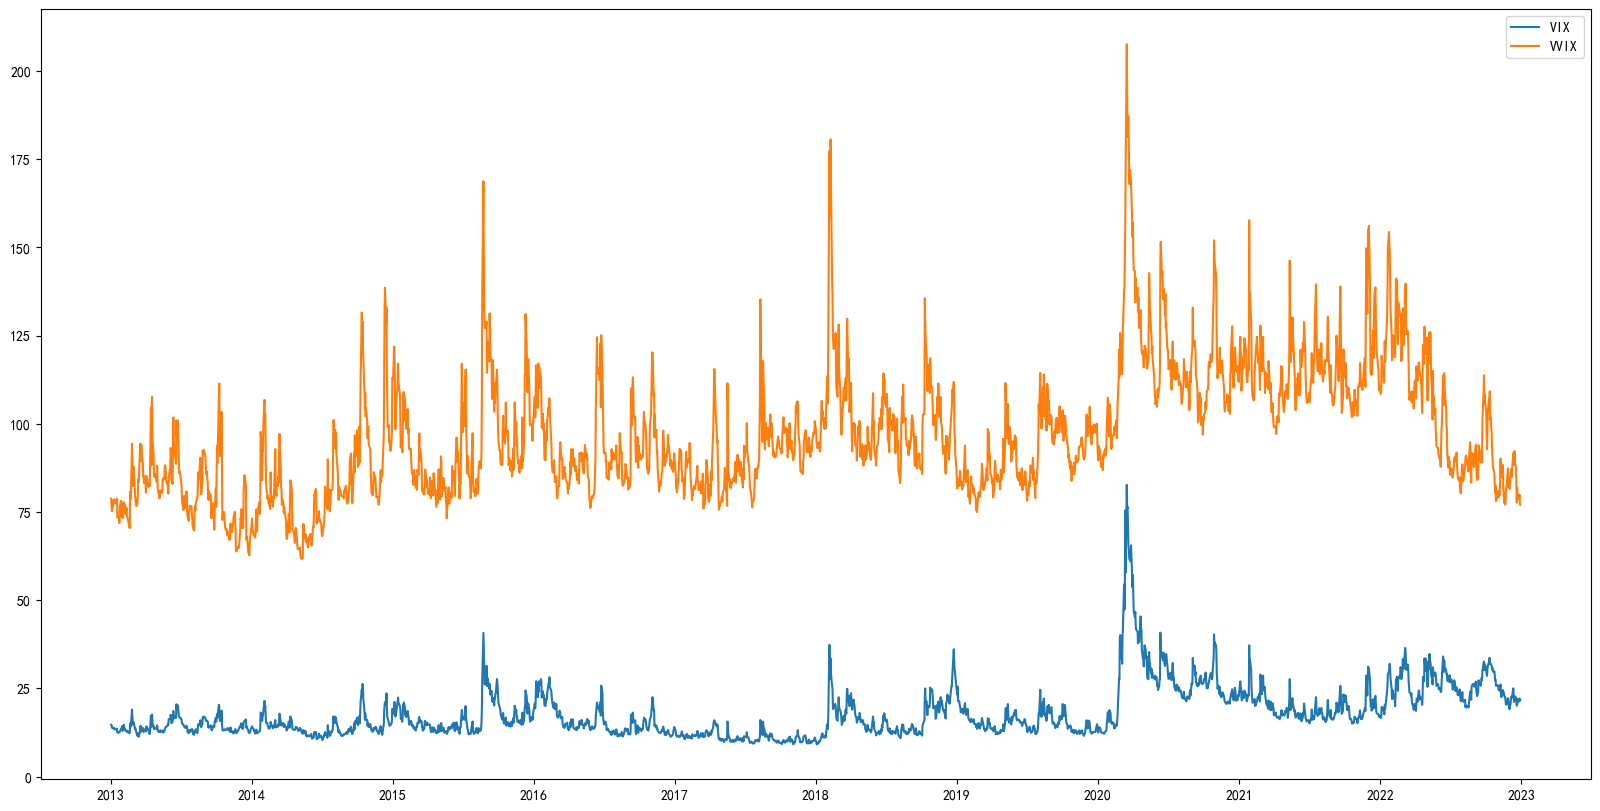
which is more close to empirical data, see figure 1. In fact, the correlation between VIX and VVIX is high in the past ten years (2013-2023), usually around 0.7.
Moreover, 3/2 model generates upward sloping volatility smiles and captures the behavior of VIX better than a variety of stochastic volatility models in Goard and Mazur (2013).
Despite its success in volatility market, the 3/2 model is restrictive in the situation of consistent modeling in the sense that is directly determined by .
Example 3 (Multi-factor Heston Model)
In the multi-factor Heston specification for volatility process, we have, by a reasoning similar to the Heston model,
where are volatility factors and the corresponding coefficients. However, it is implicit how each factor acts upon the volatility of volatility.
Example 4 (Heston vol-of-vol; Fouque and Saporito (2018))
where is a stochastic factor correlated with and . Then
Although the randomness of improves the calibration of , directly depends on and hence is not flexible enough.
1.2 Decoupling Smiles via Composite Time Change Approach
To study the volatility relationship in composite time change (CTC) models, we first introduce some background knowledge on time change approaches. Time changes can be interpreted as the intensity of business activities that drives the variation in volatility of an asset. The original clock is referred to as calendar time, and the time change process is called business time. The log-price process of an asset is originally thought to be stationary and of independent increment, i.e., a Lévy process . Every time a market event happens and drives the variation in volatility, the change is reflected in the time change, either via accelerating or slowing the business clock. The real market price of the asset is then updated under the business clock, namely .
Originally, Clark (1973) and Geman et al. (2001) proposed a subordinated Brownian motion model for log price. The time change introduces jumps in volatility. Carr et al. (2003) and Carr and Wu (2004) introduced time-changed Lévy models, where the time change is absolutely continuous, through which stochastic volatility is introduced. Luciano and Schoutens (2006), Luciano and Semeraro (2007) and Eberlein and Madan (2009) modeled the dependence of multi-assets via correlation of subordinated Brownian motions. Mendoza-Arriaga et al. (2010) extended the time-changed Lévy model by considering the combination of time change and a certain type of composite time change. Recently, Ballotta and Rayée (2022) established a unified TCLM structure that allows leverage via diffusion as well as jumps.
However, like SVMs, TCMs with specifications shown in Carr and Wu (2004) are restricted by the relationship for a model-determined function . When extended to composite time change, the model may generate the form of vol-of-vol as:
| (3) |
where is the idiosyncratic component of and are determined by model parameters, typically considered steady in short periods. This linear combination satisfies both the need for the dependence of VVIX on VIX and the flexibility of VVIX. is calibrated to the SPX market, while a free factor is calibrated to the VIX market.
Definition 1
A time change is a non-decreasing and right-continuous process such that , as and is a stopping time for evert
Definition 2
A composite time change has the form where and are time changes.
Here we assume time changes to be absolutely continuous and the base Lévy process to be a standard Brownian motion. Specifically, and where and are two independent Itô processes. Then the instantaneous variance of the model is Then the product rule
gives
| (4) |
Equation (4) results in different linear mixture forms according to the specification of activity rate process. And the ideal form of equation (3) can be achieved by the composite 3/2 model proposed in section 3.2. In addition, the model parameters in time change and are naturally separated and linearly combined in form.
1.3 Organization of the Paper
The article is organized as follows. In section2, we summarize the theory of time-changed Lévy models developed by Carr and Wu (2004) and Ballotta and Rayée (2022) and we show how the technique of leverage neutral measure change helps form the characteristic function; section 3 develops the theory of composite time change models, where a general form is considered and characteristic fuctions derived. We also discusses some useful specifications of CTC models. In Section 4, we introduce the application of the model in derivative pricing, including European options and VIX options. We show that the European option pricing in CTC models can be conducted quite efficiently. In section 5, we perform real-market joint calibration and discusses the results. And the last section concludes.
2 Preliminaries: time-changed Lévy processes
2.1 Lévy processes
Definition 3
A Lévy process, , on a filtered probability space is a continuous-time process with independent and stationary increments with a characteristic function with characteristic exponent
where and is a positive measure on such that , . The triplet determines the Lévy process and is referred to as differential characteristics.
A subordinator is a Lévy process such that is non-decreasing.
2.2 Time-changed Lévy Processes
Leverage neutral measure, first introduced in Carr and Wu (2004), is a complex-valued measure change technique that enables the explicit computation of the characteristic function (characteristic function) of time-changed Lévy process , especially when and are not independent.
Assumption 1
The Lévy processes considered in this paper are sufficiently integrable. That is, there exists such that for all .
Assumption 2
Given Lévy process , there are three versions of conditions for time change in the order of restrictiveness.
-
1.
(Type 1) satisfies sufficient regularity conditions. That is, there exists such that
-
2.
(Type 2) condition of type 1 and is in synchronization with , i.e. is constant a.s. on the interval for each .
-
3.
(Type 3) condition of type 1 and the time change is absolutely continuous with a.s..
Assume that time change is of type 1. Denote by . If is independent of , then the characteristic function of is
Otherwise, it is shown (Appendix A) that
where is the characteristic function of , and denote expectations under measures and , respectively. The new class of complex-valued measures is absolutely continuous with respect to and is defined by
| (5) |
with
As a result, the characteristic exponent of under the leverage neutral measure is given by
| (6) |
for any well-defined . This property is useful for deriving the dynamic of under .
Remark 1
Readers can refer to Carr and Wu (2004), Huang and Wu (2004) and Ballotta and Rayée (2022) for more details for the definition of leverage-neutral measure. In the works above, is defined on filtration , but here is defined in the original filtration . Equation (6) is easily followed from the definition.
Extra condition for is required to characterize the time-changed process . Specifically, if is of type 2, then semimartingale has local characteristics
where is the Lévy characteristic of (see Küchler and Sorensen (2006)).
3 Composite Time Change Models
In this section, we assume a composite time change model , where both and are increasing continuous processes with activity rates and , respectively. Furthermore, we assume to be the risk-neutral measure and the original filtration under which the base Lévy process is adapted and , are time changes. We define filtration , and denote by the expectation taken under filtration
Remark 2
In this setup, both and are type-3 time changes. The filtration is defined such that the composite activity rate process is adapted.
3.1 Model Theory
Under the setup above, a risk-neutral CTC model is specified as follows:
where are -Brownian motions, is a pure-jump -Lévy process, are -subordinators and . In addition, are unspecified functions. Finally, we require to guarantee the positivity of and .
To introduce leverage effect, we assume that , but and are independent. We also assume that and have joint distribution , and have joint distribution . and are independent.
Remark 3
If we let be affine and be constant, then , both have an affine structure.
Under the leverage-neutral measure defined by Equation (5), we have the following result of the characteristic function of .
Theorem 1
The characteristic function of the composite time-changed process is given by
| (7) |
where, under the leverage neutral measure , and are given by
where are -Brownian motions. The characteristic exponent of are given by
| (8) |
where is the characteristic exponent of .
Next, we derive the dynamics of and under the leverage-neutral measure . By Equation (6), the characteristic exponent of under measure is given by
By the independence of Brownian motions and jump processes, the characteristic exponent of under measure is
Therefore is a -Brownian motion. And by the correlation , is a -Brownian motion. is defined likewise.
Next we show the characteristic function of and . The single joint distribution at any determines the joint distribution of and at all time . Under the leverage neutral measure, the characteristic function of becomes
where is the characteristic exponent of . It follows that
As a computable example, we consider imposing an affine structure on time changes. We denote by
and for short if there is no confusion.
Corollary 1
When affine structure is imposed, that is, , and , , , then characteristic function of is explicit as follows:
| (9) |
where with and
with the affine exponents solutions to the system of Riccati-type ODEs
| (10) | ||||
with . The function is given by
| (11) |
with coefficients satisfying
| (12) | ||||
with . The characteristic exponent of are given in equation (8).
Proof By the inverse Laplace transform,
where with . If an affine structure is imposed for and , then as is given in Filipović (2001), the Laplace transform of is given by
where coefficients and are given by the equation (12). Likewise, the characteristic function of has coefficients given by the equation (10). Then the result follows.
3.2 Specifications
Example 5 (Composite 3/2 Model)
with , and .
In this specification, we have by equation (4) that
a linear combination of factors as in equation (3).
We clearly see a separation of effects, including the effect of VIX and the idiosyncratic component. The SPX market calibrates and implies a general relationship of model parameters and , while the VIX market calibrates and determines the model parameters. In other specifications likewise, we also obtain a linear combination of factors.
To derive the characteristic function under composite 3/2, we note that, according to Carr and Sun (2007), the Laplace transform of has
where
and is the confluent hypergeometric function, defined as
and
And if follows that
where
| (13) | ||||
Despite its nice interpretation, the composite 3/2 can be time-consuming in pricing, particularly in VIX pricing. A modified version of composite 3/2 model is constructed:
| (14) |
That is, the second time change is substituted by a CIR process. It’s shown in the section of VIX pricing that such formation is efficient in the method of exact simulation.
Example 6 (Composite 3/2 + Jump)
with , , and is a Lévy process. Under the specification, we only change in Equation (13) as
for the computation of characteristic function.
Example 7 (Composite Heston Model)
| (15) |
where and
Likewise, we have
The composite version of Heston inherits the inverse relationship between VIX and VVIX, but a linear mixture effect is incorporated.
Example 8
Brought up in Mendoza-Arriaga et al. (2010), the composite time change is a pure-jump process. and are independent of as well as of each other.
The model exhibits stochastic jump intensity even if has no jumps.
However, the model is theoretically redundant in the sense that is in fact a Lévy process under the model assumption. Nevertheless, the composite version of Lévy process is convenient in exhibiting flexible moments of distribution, which is usually meaningful in practice.
Example 9 (Jump Heston)
where is the negative part of the CGMY process . The model exhibits leverage effect purely by co-jumps in the base process and activity rate process. The model has also shown superior performance in Ballotta and Rayée (2022).
Example 10 (Composite Jump Heston)
| (16) |
where is the negative component of the CGMY processes , and is a Brownian motion. In this specification, leverage is introduced purely by simultaneous jumps of return and volatility. Ballotta and Rayée (2022) demonstrate a superior performance of a single time change JH model over other classic models, e.g. Heston, BNS.
Example 11 (Compound Poisson With General Leverage)
where the jump sizes and are correlated with the joint distribution .
Under the leverage neutral measure, the characteristic exponent of becomes
where
It can be interpreted as a new (complex-valued) compound Poisson process with jump intensity and jump size with a tilted distribution .
Example 12 (Multifactor)
It has been shown in empirical study that risks reflected in diffusion and jumps are of different sources. It is therefore natural to consider a TCL of the form
4 Application In Derivatives Pricing
4.1 CTC-COS Method
Since we’ve obtained the expression for the characteristic function of log price process , the pricing of European options follows directly. For example, readers may consider acceleration methods such as FFT ( Carr and Madan (1999)) or COS method (Fang and Oosterlee (2009)), to efficiently compute option prices.
In our CTC model, we show how the characteristic function and option prices can be efficiently computed with a CTC-COS method as follows.
Theorem 2 (CTC-COS)
Given current time and expiry date , the price of a European call option with strike is numerically approximated by
| (17) | ||||
where are integration range,
| (18) |
and
| (19) |
Proof According to the cosine expansion method,
with
What we do in the transformation above is performing double cosine series expansions and then re-ordering the summation and integration. Since the summations within the integral are separate, the overall complexity is under affine specifications, where is the discretization degree of numerical integration. Thus, the affine CTC models has the same order of computation cost as their ordinary time-change counterparts, e.g. Jump Heston in Example 9.
In practice, when pricing the whole volatility surface, the number of strike prices does not add computational complexity since fourier-based methods like COS allows for a separation of strikes and the underlying asset. Meanwhile, the temporal discretizations of function and are computed by numerically solving ODE systems, enabling the computation on all maturities at once.
4.2 VIX Options
To price VIX derivatives, it is common practice to first derive the relationship between the VIX and spot variance at maturity since the distribution of VIX is not directly available. It’s known that is linearly dependent on the spot variance for the Heston model. However, for most other models, such relationship is implicit and requires simulation or a numerical procedure to derive.
Example 13 (Rough Bergomi)
As shown in Jacquier et al. (2018) for rough Bergomi models, the is expressed as an integral form and a computationally costly simulation is needed to obtain samples of .
Example 14 (3/2 Model)
The VIX-Spot relationship is also implicit for a 3/2 model. A numerical differentiation is needed and leads to additional computational cost in numerical pricing.
Next, we will show that both single time change models and CTC models have simple VIX-Spot forms if the time changes have affine activity rates. Non-affine VIX-Spot relationship are also discussed.
4.2.1 Ordinary Time Change Models
Proposition 1
When a single time change is considered with an affine process as considered in Corollary 1,
with ,
and and we denote for short if there is no confusion.
Proof
where . Since
where . It is then solved as
Since the characteristic function of is easily obtained by solving an ODE system, the pricing formula of VIX options is given as:
4.2.2 CTC Models
For the case of affine CTC models, the VIX-spot relationship is still explicit and easy to obtain.
Proposition 3
For a CTC model with affine activity rates as considered in Corollary 1,
| (20) |
where coefficients
and
with a common multiplier
Proof
| (21) | ||||
where and
For other specification of time changes, there generally does not exist explicit expression for . Still, we could recover it from the Laplace transform. That is,
| (22) |
where
The Laplace transform can be explicitly computed via
where and generalized Laplace transform are computed conditional on
In practice, the formula above is computed based on a large amount of simuated and and the whole time cost is high. But in the special case where an affine is considered, but not necessarily , the characteristic function is exponentially-affine with respect to and, based on such explicit linear dependence, the computation is significantly faster.
4.2.3 Exact Simulation of Spot Variances
Despite its explicit VIX-Spot relationship, a simulation procedure for and is still needed. While Monte Carlo method is commonly slow in practice, we argue that there exists exact simulation methods for certain models. That is, we only need to simulation the distributions at maturity as opposed to the whole trajectories. As a result, there is no discretization error and the simulation procedure can be quite fast.
We assume that the characteristic function of is known and follows a CIR process. Given maturity date , our main concern is to simulate and . Then the sample of VIX is obtained from formula (20).
- Step 1
-
Simulate from a non-central chi-square distribution.
- Step 2
-
Simulate the conditional distribution by the method of Glasserman and Kim (2011).
By the independence of and , we may simulate first and then simulate with a non-central chi-square distribution. Therefore, the conditional distribution of , in the form of , needs to be derived. This is the exactly same problem faced in the Heston simulation, as brought up in Broadie and Kaya (2006). We then apply the method of gamma expansion in Glasserman and Kim (2011), where the conditional distribution is efficiently simulated as a sum of independent variables.
- Step 3
-
Simulate by inverting the characteristic function of at .
The characteristic function of is explicit for some models, e.g. Heston and 3/2 models given in Carr and Sun (2007). For composite JH model (16), we can ease the computation by precomputing the characteristic function of for a range of along the numerical discretization of the corresponding ODE. The sample of is then obtained by matching the precomputed values with samples.
- Step 4
-
Obtain by formula (20) and compute by taking the mean of the payoff.
To sum up, we price European options by
5 Joint Calibration
5.1 Data
We use the S&P 500 equity-index and VIX options traded on CBOE to test the performance of the proposed models. In order to compare with existing works, we choose the dataset used in Yuan (2020). The dataset we consider spans ten years, containing the implied volatility surfaces of the SPX and VIX options from April 2, 2007, to December 29, 2017. the options data are sampled every Wednesday to avoid weekday effects, resulting in 557 weeks in total.
To obtain option moneyness, we compute the implied futures price using put-call parity from the pair of options with the strike price closest to the index. Then we use the futures price to compute moneyness. The options are selected through the following procedures:
-
•
Remove options quotes with zero trading volume.
-
•
Remove options quotes that violates standard arbitrage conditions (see Kokholm and Stisen (2015) for example).
-
•
Remove SPX (VIX) option quotes with maturity fewer than 7 (7) days or more than 365 (160) days.
-
•
Remove SPX (VIX) option quotes whose moneyness does not fall in , .
-
•
Remove all ITM options.
Some of the filtering conditions are common practice, as introduced in Bakshi et al. (1997) and Bardgett et al. (2019), and some are adopted to be in line with Yuan (2020). Finally, we obtain a daily average of 352 SPX options and 73 VIX options. In comparison, Yuan (2020) obtained a daily average of 426 SPX options and 58 VIX options.
5.2 Calibration Procedure
The sample is divided into an in-sample period from April 4, 2007 to April 1, 2015, and an out-of-sample period from April 8, 2015 to December 27, 2017.
In the in-sample period, we calibrate on every daily subsample by solving the optimization problem below.
| (23) | ||||
where and are the number of SPX and VIX options quotes in the sample, is the -th implied volatility computed by a given model and is the -th market implied volatility.
To perform an out-of-sample test of pricing models, we divide the model parameters into structural parameters (still denoted by ) and state parameters (denoted by ). First, we choose a small sample before the out-of-sample period to optimize the structural parameters, and solve an aggregate optimization problem
| (24) |
where is the error function (23) on date . Denote by the resulting optimized set structural parameters. Then in step 2, we solve daily out-of-sample optimization problems by optimizing the state parameters
| (25) |
5.3 Results
Below are the results of joint calibration under the four models: JH, 2F-JH, CJH and 2F-CJH. The performance error is measured by the rooted mean squared relative error of implied volatility, defined as
| (26) |
In Table 1, the performance of model CJH (2F-CJH) is better than JH (2F-JH) with a mild cost of parameters.
| Heston | CHeston | JH | CJH | |
|---|---|---|---|---|
| In-sample | 0.1422 (0.0547) | 0.1144 (0.0333) | 0.0764 (0.0337) | 0.0612 (0.0330) |
| Out-of-sample | - | - | 0.0922 (0.02412) |
| Model | Heston | CHeston | JH | CJH | |||
|---|---|---|---|---|---|---|---|
| N.Para. | 5 | 9 | 9 | 13 | 13 | 16 | 21 |
| Insample Error | 0.1422 | 0.1144 | 0.0764 | 0.0547 | 0.1010 | 0.0664 | 0.0638 |
| Heston | CHeston | JH | CJH | |||||
|---|---|---|---|---|---|---|---|---|
| 13.9178 | 8.2248 | 3.0450 | 3.8720 | |||||
| 0.0777 | 0.1529 | 0.4507 | 0.4849 | |||||
| 1.9329 | 1.6834 | 1.7165 | 1.2897 | |||||
| 2.8954 | 4.3276 | |||||||
| 1.2401 | 0.9096 | |||||||
| 0.4752 | 0.4110 | |||||||
| 0.6519 | 1.3918 | |||||||
| 0.8318 | 0.6567 | |||||||
| 9.5092 | 5.0340 | |||||||
| 1.6231 | 1.6870 | |||||||
| -0.7096 | -0.5889 | |||||||
| 0.4992 | 0.2157 | |||||||
| 0.0313 | 0.0500 | 0.1084 | 0.0714 | |||||
| 1.3112 | 1.5074 | |||||||
6 Conclusion
In this paper, the contributions of our work are three-folded.
Firstly, we develop a generalized form of composite time-changed Lévy models. These models have the advantage of exhibiting various variance, skewness and kurtosis. Moreover, as we show in detail in section 4, CTC models typically have good tractability. It only requires a complexity of if the affine structure of time changes is imposed.
Secondly, we theoretically demonstrate the effectiveness of our model in consistent modeling. Unlike historical works of consistent modeling, the composite time change models provide explicit interpretation in its decoupling mechanism of volatility and volatility of volatility.
Finally, we validates the superiority of our proposed model in the consistent modeling problem. We develop its option pricing theory and test its performance in the joint calibration problem of SPX and VIX option market. As shown in section 5, the composite time change models successfully calibrate the joint smiles in real market.
Appendix A Proof of Theorem 1
Lemma 1
Consider a filtered space with probability measure and a complex-valued measure . Assume that is locally dominated by with Radon-Nikodym derivative , i.e.,
Then for any finite stopping time , we have and
The lemma is an extension of Jacod and Shiryaev (2013) (Theorem III.3.4.(ii)). Proof Since , we see that , and as is a bounded stopping time, it follows by the optional stopping theorem that
To prove the theorem, it is enough to show for . Then choose , we have
And the result follows.
Now we start the proof of Theorem 1.
Proof Since time change is of type 1, is well-defined. When is an independent time change, using iterated conditioning argument:
When is not independent of . First we show that is a -martingale. Denote
which is a complex-valued martingale. As a result of lemma 1, is a -martingale. And the characteristic function of follows from direct computation.
Since is a Lévy process under filtration , we have that
Thus, we have
Appendix B COS Method for VIX Options
According to COS method in Fang and Oosterlee (2009), the price at time of a European style option is
where are integration range and
where is the payoff function w.r.t. the underlying asset with value . The analytically formula of for call options is known if the log-asset price has analytical characteristic function
Since
In affine models, we can show that for some constants and .
Let , for VIX options, we have the analytical expression for the characteristic function of VIX2, then
the integral can be done numerically. Then the pricing formula becomes
Appendix C Calibration Details
Spot index prices like SPX and VIX are not used in the calibration because they are not directly traded in the market, see also Lian and Zhu (2012). They are recovered from the market according to the put-call parity as discounted futures price. Meanwhile, such implied spot prices contain the term structure of future dividend expectations.
-
•
SPX options with AM settlement are specially treated with 1 day less maturity
-
•
The risk-free rate is quoted from daily U.S. treasury bond rates with Spline interpolation
-
•
Implied volatility is a function of moneyness (and no additional rates) because
yields
To price and compute IV, it’s enough to obtain the moneyness. By put-call parity,
if is known, then
References
- Bakshi et al. (1997) Gurdip Bakshi, Charles Cao, and Zhiwu Chen. Empirical performance of alternative option pricing models. The Journal of finance, 52(5):2003–2049, 1997.
- Baldeaux and Badran (2014) Jan Baldeaux and Alexander Badran. Consistent modelling of VIX and equity derivatives using a 3/2 plus jumps model. Applied Mathematical Finance, 21(4):299–312, 2014.
- Ballotta and Rayée (2022) Laura Ballotta and Grégory Rayée. Smiles & smirks: Volatility and leverage by jumps. European Journal of Operational Research, 298(3):1145–1161, 2022.
- Bardgett et al. (2019) Chris Bardgett, Elise Gourier, and Markus Leippold. Inferring volatility dynamics and risk premia from the S&P 500 and VIX markets. Journal of Financial Economics, 131(3):593–618, 2019.
- Bayer et al. (2013) Christian Bayer, Jim Gatheral, and Morten Karlsmark. Fast ninomiya–victoir calibration of the double-mean-reverting model. Quantitative Finance, 13(11):1813–1829, 2013.
- Bayer et al. (2016) Christian Bayer, Peter Friz, and Jim Gatheral. Pricing under rough volatility. Quantitative Finance, 16(6):887–904, 2016.
- Broadie and Kaya (2006) Mark Broadie and Özgür Kaya. Exact simulation of stochastic volatility and other affine jump diffusion processes. Operations research, 54(2):217–231, 2006.
- Carr and Madan (1999) Peter Carr and Dilip Madan. Option valuation using the fast fourier transform. Journal of computational finance, 2(4):61–73, 1999.
- Carr and Sun (2007) Peter Carr and Jian Sun. A new approach for option pricing under stochastic volatility. Review of Derivatives Research, 10:87–150, 2007.
- Carr and Wu (2004) Peter Carr and Liuren Wu. Time-changed Lévy processes and option pricing. Journal of Financial economics, 71(1):113–141, 2004.
- Carr and Wu (2009) Peter Carr and Liuren Wu. Variance risk premiums. The Review of Financial Studies, 22(3):1311–1341, 2009.
- Carr et al. (2003) Peter Carr, Hélyette Geman, Dilip B Madan, and Marc Yor. Stochastic volatility for Lévy processes. Mathematical finance, 13(3):345–382, 2003.
- Cheng (2019) Ing-Haw Cheng. The VIX premium. The Review of Financial Studies, 32(1):180–227, 2019.
- Clark (1973) Peter K Clark. A subordinated stochastic process model with finite variance for speculative prices. Econometrica: journal of the Econometric Society, pages 135–155, 1973.
- Cont and Kokholm (2013) Rama Cont and Thomas Kokholm. A consistent pricing model for index options and volatility derivatives. Mathematical Finance: An International Journal of Mathematics, Statistics and Financial Economics, 23(2):248–274, 2013.
- Drimus (2012) Gabriel G Drimus. Options on realized variance by transform methods: a non-affine stochastic volatility model. Quantitative Finance, 12(11):1679–1694, 2012.
- Eberlein and Madan (2009) Ernst Eberlein and Dilip B Madan. On correlating Lévy processes. Robert H. Smith School Research Paper No. RHS, pages 06–118, 2009.
- Fang and Oosterlee (2009) Fang Fang and Cornelis W Oosterlee. A novel pricing method for european options based on fourier-cosine series expansions. SIAM Journal on Scientific Computing, 31(2):826–848, 2009.
- Filipović (2001) Damir Filipović. A general characterization of one factor affine term structure models. Finance and Stochastics, 5:389–412, 2001.
- Fouque and Saporito (2018) J-P Fouque and Yuri F Saporito. Heston stochastic vol-of-vol model for joint calibration of VIX and S&P 500 options. Quantitative Finance, 18(6):1003–1016, 2018.
- Gatheral (2008) Jim Gatheral. Consistent modeling of SPX and VIX options. In Bachelier congress, volume 37, pages 39–51, 2008.
- Gatheral et al. (2018) Jim Gatheral, Thibault Jaisson, and Mathieu Rosenbaum. Volatility is rough. Quantitative finance, 18(6):933–949, 2018.
- Gatheral et al. (2020) Jim Gatheral, Paul Jusselin, and Mathieu Rosenbaum. The quadratic rough heston model and the joint S&P 500/VIX smile calibration problem. arXiv preprint arXiv:2001.01789, 2020.
- Geman et al. (2001) Hélyette Geman, Dilip B Madan, and Marc Yor. Time changes for Lévy processes. Mathematical Finance, 11(1):79–96, 2001.
- Glasserman and Kim (2011) Paul Glasserman and Kyoung-Kuk Kim. Gamma expansion of the heston stochastic volatility model. Finance and Stochastics, 15:267–296, 2011.
- Goard and Mazur (2013) Joanna Goard and Mathew Mazur. Stochastic volatility models and the pricing of VIX options. Mathematical Finance: An International Journal of Mathematics, Statistics and Financial Economics, 23(3):439–458, 2013.
- Guo et al. (2022) Ivan Guo, Grégoire Loeper, Jan Obłój, and Shiyi Wang. Joint modeling and calibration of SPX and VIX by optimal transport. SIAM Journal on Financial Mathematics, 13(1):1–31, 2022.
- Guyon (2020) Julien Guyon. The joint S&P 500/VIX smile calibration puzzle solved. Risk, April, 2020.
- Huang and Wu (2004) Jing-zhi Huang and Liuren Wu. Specification analysis of option pricing models based on time-changed Lévy processes. The Journal of Finance, 59(3):1405–1439, 2004.
- Jacod and Shiryaev (2013) Jean Jacod and Albert Shiryaev. Limit theorems for stochastic processes, volume 288. Springer Science & Business Media, 2013.
- Jacquier et al. (2018) Antoine Jacquier, Claude Martini, and Aitor Muguruza. On VIX futures in the rough bergomi model. Quantitative Finance, 18(1):45–61, 2018.
- Kokholm and Stisen (2015) Thomas Kokholm and Martin Stisen. Joint pricing of VIX and SPX options with stochastic volatility and jump models. The Journal of Risk Finance, 16(1):27–48, 2015.
- Küchler and Sorensen (2006) Uwe Küchler and Michael Sorensen. Exponential families of stochastic processes. Springer Science & Business Media, 2006.
- Lian and Zhu (2013) Guang-Hua Lian and Song-Ping Zhu. Pricing VIX options with stochastic volatility and random jumps. Decisions in Economics and Finance, 36:71–88, 2013.
- Lian and Zhu (2012) Guanghua Lian and Song-Ping Zhu. Pricing VIX options with stochastic volatility and random jumps. Available at SSRN 2065065, 2012.
- Lin and Chang (2010) Yueh-Neng Lin and Chien-Hung Chang. Consistent modeling of S&P 500 and VIX derivatives. Journal of Economic Dynamics and Control, 34(11):2302–2319, 2010.
- Luciano and Schoutens (2006) Elisa Luciano and Wim Schoutens. A multivariate jump-driven financial asset model. Quantitative finance, 6(5):385–402, 2006.
- Luciano and Semeraro (2007) Elisa Luciano and Patrizia Semeraro. Extending time-changed Lévy asset models through multivariate subordinators. 2007.
- Mendoza-Arriaga et al. (2010) Rafael Mendoza-Arriaga, Peter Carr, and Vadim Linetsky. Time-changed markov processes in unified credit-equity modeling. Mathematical Finance: An International Journal of Mathematics, Statistics and Financial Economics, 20(4):527–569, 2010.
- Pacati et al. (2018) Claudio Pacati, Gabriele Pompa, and Roberto Renò. Smiling twice: the heston++ model. Journal of Banking & Finance, 96:185–206, 2018.
- Papanicolaou (2022) Andrew Papanicolaou. Consistent time-homogeneous modeling of SPX and VIX derivatives. Mathematical Finance, 32(3):907–940, 2022.
- Papanicolaou and Sircar (2014) Andrew Papanicolaou and Ronnie Sircar. A regime-switching heston model for VIX and S&P 500 implied volatilities. Quantitative Finance, 14(10):1811–1827, 2014.
- Yuan (2020) Peixuan Yuan. A new model for the joint valuation of S&P 500 and VIX options: Specification analysis. Management Science accepted, 2020.