11email: {bridget.smart, joshua.watt, sara.benedetti, lewis.mitchell, matthew.roughan} @adelaide.edu.au
set.adelaide.edu.au/mathematical-sciences
#IStandWithPutin versus #IStandWithUkraine:
The interaction of bots and humans in discussion of the Russia/Ukraine war
Abstract
The 2022 Russian invasion of Ukraine emphasises the role social media plays in modern-day warfare, with conflict occurring in both the physical and information environments. There is a large body of work on identifying malicious cyber-activity, but less focusing on the effect this activity has on the overall conversation, especially with regards to the Russia/Ukraine Conflict. Here, we employ a variety of techniques including information theoretic measures, sentiment and linguistic analysis, and time series techniques to understand how bot activity influences wider online discourse. By aggregating account groups we find significant information flows from bot-like accounts to non-bot accounts with behaviour differing between sides. Pro-Russian non-bot accounts are most influential overall, with information flows to a variety of other account groups. No significant outward flows exist from pro-Ukrainian non-bot accounts, with significant flows from pro-Ukrainian bot accounts into pro-Ukrainian non-bot accounts. We find that bot activity drives an increase in conversations surrounding angst (with ) as well as those surrounding work/governance (with ). Bot activity also shows a significant relationship with non-bot sentiment (with ), where we find the relationship holds in both directions. This work extends and combines existing techniques to quantify how bots are influencing people in the online conversation around the Russia/Ukraine invasion. It opens up avenues for researchers to understand quantitatively how these malicious campaigns operate, and what makes them impactful.
Keywords:
Bot Nets Information Flow Sentiment Analysis Linguistic Analysis Disinformation Campaigns Influence Campaigns Twitter.1 Introduction

Social media is a critical tool in information warfare, playing a large role in the 2022 Russian invasion of Ukraine [6, 30]. Disinformation and more generally reflexive control [38] have been used by Russia and other countries against their enemies and internally for many years [10]. A relative newcomer in this space – Twitter – has already been extensively used for such purposes during military conflicts, for instance in Donbass [10], but its role in conflicts is evolving and not fully understood. Both sides in the Ukrainian conflict use the online information environment to influence geopolitical dynamics and sway public opinion. Russian social media pushes narratives around their motivation, and Ukrainian social media aims to foster and maintain external support from Western countries, as well as promote their military efforts while undermining the perception of the Russian military. Examples of these narratives include allegations: that Ukraine was developing biological weapons [40], that President Volodymyr Zelenskyy had surrendered [5, 16], and that there is a sustained campaign showing the apparent success of ‘The Ghost of Kiev’ [18]. Some of the information being pushed is genuine, and some is malicious. It is not easy to discriminate which is which.
Understanding and measuring information flows and various language features has previously allowed researchers to understand community dynamics and identify inauthentic accounts and content [36, 31, 1]. Here we apply and extend these techniques to understand and quantify the influence of bot-like accounts on online discussions, using Twitter data focussed on the Russian invasion of Ukraine. In essence we seek to determine whether the malicious influence campaigns work as intended.
Our dataset consists of 5,203,764 tweets, retweets, quote tweets and replies posted to Twitter between February 23rd and March 8th 2022, containing the hashtags #(I)StandWithPutin, #(I)StandWithRussia, #(I)SupportRussia, #(I)StandWithUkraine, #(I)StandWithZelenskyy and #(I)SupportUkraine [39]. See Section 3 for further details. A summary plot of the data is shown in Figure 1. The figure also shows a measure of the proportion of bot traffic over the same time period, as estimated by the bot-detection tool Botometer [33].
In all time series figures, we present five significant events that provide context for our findings: when the conflict begins (24th February 2022), when the fighting in Mariupol begins (26th February 2022), when Russia captures Kherson (2nd March, 2022), when Russia captures the Zaporizhzhia nuclear power plant (4th March 2022) and when Ukrainian authorities first attempt to evacuate Mariupol (8th March 2022). These events are linked to noticeable changes in the volumes of related tweets, and in our analysis we delve deeper to understand how information is flowing. As a result, we learn how bots are influencing the online conversation by measuring what communities are talking about online, and how this discussion evolves. We use lexicon and rule based techniques to create an approach that is robust, transferable and able to be quickly applied to large volumes of data.
We employ time-series analysis techniques to understand how bot-like activity impacts the wider group of participants, by measuring linguistic content, sentiment and their lagged effect on future discussions. We use the Linguistic Inquiry and Word Count (LIWC; pronounced “Luke”) [29] and Valence Aware Dictionary for Sentiment Reasoning (VADER) [13], dictionary based models to measure the linguistic features and sentiment of our dataset. To measure bot activity, we classify a random sample of 26.5% of accounts which posted at least one English language Tweet in the dataset using Botometer [33].
This work extends existing techniques to understand how bot-like accounts spread disinformation on Twitter and measure the effect of these malicious campaigns. The main contributions are:
-
•
An extension of existing information flow techniques to examine aggregated group activity. We establish statistical significance of information flows between accounts grouped by national lean and account type. The highest information flows are out of pro-Russian non-bot accounts. Information flows into non-bot account groups are only significant for balanced and pro-Ukraine accounts, with pro-Russian non-bot accounts only exhibiting a net outward information flow of information.
-
•
We establish a significant relationship between bot activity and overall non-bot sentiment (with ), but find this relationship is significant for both positive and negative lags, indicating there may be confounding factors.
-
•
An analysis of the effect which bot activity has on emotions in online discussions around the Russia/Ukraine conflict. We find that bots significantly increase discussions of the LIWC categories: Angst, Friend, Motion, Time, Work and Filler. The strongest relationship is between Self Declared bot activity and words in the ‘Work’ category (with ), which includes words relating to governance structures like ‘president’ and ‘government’.
-
•
A dataset111Dataset available at https://figshare.com/articles/dataset/Tweet_IDs_Botometer_results/20486910. of Twitter users who participated in discussions around the Russian Invasion of Ukraine [39].
2 Related work
Many works have analysed bot-like accounts on social media [25, 15, 9]. Authors have shown bots are present in social networks, especially with regard to political campaigns/movements [25]. Keller and Klinger [15] showed social bot activity increased from 7.1% to 9.9% during German election campaigns, using bot probabilities before and during the election campaign. Furthermore, Stella et al. [37] showed bots increase exposure to negative and inflammatory content in online social systems. These authors used various information networks to find that 19% of overall interactions are directed from bots to humans, mainly through retweets (74%) and mentions (25%) [37]. A more socially-focused approach by Cresci et al. [9] measured Twitter’s current capabilities of detecting social spambots. They assess human performance in discriminating between genuine accounts, social spambots, and traditional spambots through a crowd-sourcing campaign. Notably, these works focus on analysing structural aspects of communication networks between bot and non-bot accounts, whereas we will examine information flows directly, using the full content of tweets.
Information flows in online social networks have been used to reveal underlying network dynamics, and employed to understand how individual users exert influence over one another online. Typically these flows are measured using statistical and information-theoretic measures of information flows [1, 31, 36], to understand if significant information flows exist between groups, particularly between bot and non-bot accounts. In social media, existing approaches only consider account-level information flows, while our work considered aggregated information flows.
The use of bots by Russian authorities has been widely observed: e.g., Collins [7] found 5,000 bots were pushing protests against Russiagate haux, a political event concerning relations between politicians from US and Russia; and Shane [35] suggested Russia created ‘Fake Americans’ to influence the 2016 US election. Moreover, Purtill [32] found that Russia had a massive bot army in spreading disinformation about the Russia/Ukraine conflict. Muscat and Siebert [22] have suggested that both Ukraine and Russia are utilising bot armies in their cyber warfare. However, the extent to which these bots drive particular discussions and influence the behaviour of humans on social media during the Russia/Ukraine conflict is relatively unexplored. We aim to address this question through our analysis of information flows, sentiment, and linguistic features.
3 Data collection and preprocessing
We used the Twitter API (V2) to collect all tweets, retweets, quotes and replies containing case-insensitive versions of the hashtags
#(I)StandWithPutin,
#(I)StandWithRussia,
#(I)SupportRussia,
#(I)StandWithUkraine,
#(I)StandWithZelenskyy and #(I)SupportUkraine [39].
These Tweets were posted from February 23rd 2022 00:00:00 UTC until March 8th 2022 23:59:59 UTC, the fortnight after Russia invaded Ukraine. We queried the hashtags with and without the ‘I’ for a total of 12 query hashtags, collecting 5,203,746 tweets. The data collected predates the beginning of the 2022 Russian invasion by one day.
These hashtags were chosen as they were found to be the most trending hashtags related to the Russia/Ukraine war which could be easily identified with a particular side in the conflict.
We first extracted all of the Twitter-labelled English tweets from the dataset. Of these, we calculated the proportion of words which appear in each LIWC category for a given tweet. These proportions are what we refer to as the ‘LIWC Data’. The unique accounts in this filtered data set were randomly sampled to calculate account-level Botometer labels, since Botometer uses language dependent features.
Twitter’s takedown of Russian accounts on the March 3rd may lead to bias issues within our data, as the activity of these accounts will not be present in our dataset. However, analysis showed that the content spread by these accounts persisted depsite the takedown222https://twitter.com/timothyjgraham/status/1500101414072520704.
3.1 Categorising accounts via national lean
The query hashtags from each tweet were extracted and the total number of pro-Ukrainian (ending in Ukraine or Zelenskyy) and pro-Russian (ending in Russia or Putin) hashtags were counted and used to establish the national lean of a tweet. If the number of pro-Ukranian query hashtags exceeded that of the pro-Russian hashtags, the tweet was labelled as ‘ProUkraine’, and labeled as ‘ProRussia’ conversely. If the counts were balanced, the tweet was labelled ‘Balanced’. Where applicable, the lean of an account was taken to be the most commonly occurring national lean across all tweets from that account.
We found that 90.16% of accounts fell into the ‘ProUkraine’ category, while only 6.80% fell into the ‘ProRussia’ category. The balanced category contained 3.04% of accounts, showing that accounts exhibiting mixed behaviour are present in the dataset.
We explored other methods for categorising accounts, e.g., labelling accounts as ‘ProUkraine’ or ‘ProRussia’ if they use only those types of hashtag. However, as we were primarily concerned with aggregated activity, we elected to prioritise labelling each account by their ‘usual’ behaviour.
3.2 Bot Classifications
We use Botometer [41] to quantify the extent of bot activity in the dataset by assigning scores to a random sample of accounts. Note that we used Botometer’s ‘English’ scores throughout this paper – these scores utilise both language dependent and language independent features during classification [41]. Botometer provides an ‘overall’ bot score, referred to as the complete automation probability (CAP) and scores corresponding to six distinct sub-types: AstroTurf, Fake Follower, Financial, Self Declared, Spammer and Other.
The rate limits allowed us to randomly sample 26.5% of unique accounts in our dataset which posted at least one English Tweet. This random sample leads to an approximately uniform frequency of Tweets from accounts with Botometer labels across the time frame we considered.
Due to rate limit constraints, the Botometer scores were calculated post-collection, so a small number of accounts may have been removed or scores may be calculated using activity after our collection period.
While it is more appropriate to use Botometer’s CAP score as a measure of how bot-like an account is, rather than as a classification tool, it was necessary to label accounts to establish and understand information flows between account groups. Using the recommended cutoff of 0.43, we categorised each labelled account into one of the six Botometer categories or as ‘NotBot’ [33]. Where an account was not queried, it was labelled as ‘FailedToClassify’.
The process for each account is as follows:
-
1.
If the maximum Botometer score is greater than 0.43 then the corresponding category label is assigned to that account.
-
2.
Else if the maximum score is smaller than 0.43, the account is categorised as‘NotBot’.
-
3.
Otherwise the account is labelled as ‘FailedToClassify’.
The results of classification were 1,347,082 ‘FailedToClassify’, 218,382 ‘NotBot’, 192,633 ‘Other’, 29,627 ‘Fake Follower’, 29,622 ‘AstroTurf’, 1,976 ‘Spammer’, 1,723 ‘Self Declared’ and 662 ‘Financial’ accounts.
4 The role of bots in the overall discussion
Figure 1 shows the average hourly bot probability for different bot types (top), and the hourly frequency of query hashtags (bottom). There is an initial spike in the #(I)StandWithUkraine tweets, which is also most dominant overall. Interestingly, the #(I)StandWithPutin and #(I)SupportPutin hashtags spike on 2nd-3rd March, just after Russia captured its first Ukranian city (Kherson). We believe these spikes in support of Putin are predominately due to the presence of bots, as indicated by the increase in overall bot activity around this time. This observation was independently made by researcher Timothy Graham around this time [32]. On March 4th, Twitter removed over 100 users who pushed the #(I)StandWithPutin campaign for violating its platform manipulation and spam policy [8]. This may lead us to underestimate the impact of pro-Russian media after this date, as information may be spreading from alternative sources or shifting to different hashtags.
In Figure 1 we can see the daily cycles in activity. Figure 3 enhances that view by showing the daily cycle based on the hour of day (centred around the mean). Note that the ‘AstroTurf’ cycle is opposite to that of all other types. Astroturfing accounts are active at opposite times to the other bot types. There are two potential explanations: either the Astroturfing accounts are from a different timezone to a majority of the accounts, or, Botometer uses timezone to determine whether an account is Astroturfing.


Figure 1 (top), also shows a spike in bots on March 2nd and 4th. The first spike aligns with Russia capturing Kherson, but also when the #(I)StandWithPutin and #(I)StandWithRussia hashtags were trending. We observed the mean overall Botometer score of active pro-Russia accounts increased from 0.535 (1st March) to 0.593 (2nd March), whereas the mean overall Botometer score of active pro-Ukrainian accounts decreased from 0.585 (1st March) to 0.562 (2nd March). Hence, this further suggests that bots were responsible for making the pro-Russia hashtags trend on these dates. The second spike in bot activity on March 4th is more difficult to explain. On this date Russia captured the Zaporizhzhia nuclear power plant, but also a handful of pro-Russian accounts were removed by Twitter. The mean overall Botometer score of active pro-Russia accounts significantly increased from 0.535 (3rd March) to 0.613 (4th March) and the mean overall Botometer score of active pro-Ukrainian accounts slightly increased from 0.573 (3rd March) to 0.603 (4th March). As a result, this spike in bot activity is due to the presence of pro-Russian bots (before they were removed) and the presence of pro-Ukrainian bots advocating against the pro-Russian accounts. Nonetheless, there is an obvious presence of bots over the duration of the first fortnight after Russia’s invasion of Ukraine.
The time of day effects are most pronounced for the AstroTurf and Other bots, whereas the activity of Fake Follower, Financial, Self Declared and Spammer bots are less impacted by the time of day. This may be because AstroTurf and Other bots are pushing campaigns specific to certain countries, and hence sharing content aligned with those timezones. The spike in Other bots occurs at 10:00 UTC which corresponds to 1:00pm Ukrainian time. Matthews [21] suggested that noon to 1:00pm is the most popular time to tweet in any timezone. Hence, the Other bots are likely to be increasing their engagement in Ukraine by being most active around this time.
Figure 3 shows pairwise box plots of the Botometer type probabilities based on whether the accounts are pro-Ukraine or pro-Russia. The most commonly-used bot type for both campaigns is the Self-Declared bots, suggesting that authorities have identified these bots to be most useful in a information warfare campaign. Furthermore, we observe a fairly consistent spread of bot types for both campaigns. Pro-Russian accounts have a mean CAP score of 0.42, while pro-Ukrainian accounts have a mean score of 0.43, with medians 0.36 and 0.34 respectively. However, the median probability of an account being an AstroTurf bot is slightly higher for pro-Ukrainian accounts than pro-Russian accounts. Additionally, the median probability of a Self-Declared bot is slightly higher for pro-Russian accounts compared to pro-Ukrainian accounts. This highlights that pro-Ukrainian accounts may be utilising more Astroturfing in their information warfare, whereas pro-Russian accounts may be utilising more Self-Declared bots.
5 Information flows between bots and human accounts
5.1 Information-flow estimation methods
We measure the influence of accounts on overall online discussion using the following symmetric net information flow measure from the time-stamped writings of a source to target [36]:
| (1) |
Here is the non-parametric cross entropy rate estimator [1, 17]:
| (2) |
where and are the number of symbols written by the source and target, respectively, and denotes the length of the shortest substring, starting at index which does not appear in the first symbols. See [2] for an example of estimation. We aggregate content by account type rather than on an account level to measure the information flows between account types and establish their significance.
We use the language analysis tools Valence Aware Dictionary and Sentiment Reasoner (VADER) [13] for sentiment analysis, as well as the Linguistic Inquiry and Word Count (LIWC) [29] to establish relationships between conversation features and bot-activity. We then use the Granger causality test to determine whether one time series is useful in forecasting another time series with some time lag .
We do this by fitting two linear models. The first model we include only the lagged values of :
| (3) |
where we define as the error term of model at time and as the parameter of model at lag . Next, we augment the model to also include the lagged values of :
| (4) |
The null hypothesis, that does not Granger-cause , is accepted via an F-test if and only if no lagged values of are retained in the regression model observed in Eq. 4.
5.2 Aggregated information flows
We apply information-flow measures to content aggregated by account type, to understand inter-community information flows. Rather than using an aggregate statistic on individual information flows, the proposed aggregated flow approach allows the symmetric and normalisation properties of the net information flow measure [36] to be preserved. This process improves the quality of the entropy estimate for the group behaviour, by increasing the available sequence length and mitigating the effect of slow convergence of the estimator. In this section we also develop a significance test for net information flow.
Each account is labeled by both bot classification and national lean, and the content within these account groups is aggregated. The cross entropy between each of these groups is calculated pairwise, and these values are normalised according to Eq. 1.
These pairwise cross entropy estimations produce a fully connected network. We then perform a statistical test for whether aggregated net information flows are significant between groups, allowing a network of significant information flows to be constructed (Figure 4).
To approximate the null distribution for the difference between median outgoing flow rates between each group, we randomly shuffle group labels for each tweet, reconstruct aggregated sequences, then calculate net information flows. These aggregated net flows are used to calculate the differences in group median out-flows and construct the empirical null distribution, which is used to calculate an empirical p-value for the observed values.

These aggregated net information flows reveal that generally information flows out of the pro-Russian accounts, with the exception of the pro-Russia FailedToClassify and pro-Russian Fake Follower account groups (Figure 4). This indicates that these account groups may be predominately interacting with other accounts within the same group, rather than accounts with other leans or types. The ‘ProRussia NotBot’ account group has the largest outward information flows and significant flows to a range of other groups, having a positive information flow into both ‘ProUkraine’ and ‘Balanced’ account groups.
This indicates that these Russian non-bot accounts influence a variety of user groups with the greatest between group information flows. This may indicate that human-controlled accounts, or accounts which appear less bot-like, have more influence in our social network, potentially due to their behaviour or perception. While the ‘NotBot’ label is derived from the Botometer score, this label does not mean these accounts are not malicious or automated.
Most of the significant information flows between ‘ProUkraine’ account groups is between groups with the same lean. This may indicating that more information flows between the accounts within each of these groups rather than to accounts in other groups. ‘ProUkraine’ groups have the highest self entropy rates, meaning that these groups do not just aggregate information from other account groups, but influence other accounts within the same group (Figure 4 (d)).
The Balanced account groups show information flows to all other national-lean types, and connect otherwise disjoint parts of the information flow network. These accounts may act as a bridge for information to move between ‘ProRussia’ and ‘ProUkraine’ accounts. Most of these groups have small but significant information flows to other groups, with information tending to flow out of these groups.
Notably, the few significant information flows into non-bot account groups indicate some influence from ‘bot-like’ accounts on non-bot accounts. However, these account groups have stronger outward net information flows then inward flows, suggesting that while they tend to have influence on the content of other ‘bot-like’ accounts, they do not influence non-‘bot-like’ users generally.
When account-level flows are considered rather than the aggregated flows presented here, several similar significant flows exist between ‘bot-like’ and non-‘bot-like’ accounts.
6 How bot accounts influence linguistic features of the conversation
Having characterised bot activity and identified significant information flows, we now aim to explore the content of these relationships. We first consider relationships between bot activity and sentiment, with a focus on understanding if bot-like accounts have a significant impact on the compound sentiment of non-bot accounts, measured using the CAP Botometer score and weighted average compound sentiment. The linguistic impact is then quantified by using LIWC to develop a statistical framework for understanding the relationship between bots activity and emotional/linguistic content.
6.1 Bot activity and overall sentiment
To understand how bots drive non-bot sentiment, we begin by cleaning and preparing two time series. The first is the mean CAP Botometer score, which acts as a proxy for the total proportion of bot-like activity on the network. The second is the CAP-weighted mean compound sentiment. Weighting the VADER compound sentiment by the complement of the Botometer CAP score provides a measure of non-bot sentiment without making account labelling assumptions. It is robust to threshold choices, and provides a meaningful measure of the overall sentiment of the dataset.

Each time series is aggregated hourly. The first 50 hours are removed from both time series since there is a comparatively small tweet volume over that period.The mean CAP Botometer score has a linear trend, which is removed via a linear regression. Both time series are standardised to have mean zero to ensure they comply with the assumptions to perform Granger causality analysis. We also removed the daily periodic cycle (Figure 3) from each time series.
The cross correlations are then calculated for various lags to understand the effect of mean CAP Botometer score on the CAP-weighted mean compound sentiment. A maximum lag of 12 hours is considered. A positive relationship exists between the cleaned time series, indicating there is a correlation between the activity of ‘bot-like’ accounts and the compound sentiment of the non-‘bot-like’ accounts. There is a significant relationship between the two series, with .
Since effects cannot occur simultaneously, we consider the lagged effect of bot activity on non-bot compound sentiment, finding a positive cross correlation for both positive and negative lags (Figure 5). This shows that bot activity increases when sentiment increases, but also that sentiment increases with increases in bot activity. Figure 5 indicates that the relationship between sentiment and bot activity is complicated, with marked events driving spikes in the compound sentiment of not-‘bot-like’ accounts. There are also spikes in the mean compound sentiment of other account lean types, which may be due to events which we did not consider in our analysis. This indicates that there may not be an overall effect on the non-bot compound sentiment due to bot activity, although this relationship may exist on an individual account level.
6.2 Bot activity and linguistic discussion features
Using LIWC, we explore how different types of bots drive emotions and discussions around the Russia/Ukraine conflict. We produce hourly averages for overall LIWC proportions and the Botometer probabilities. This results in a set of time series, all over 336 hours. We utilise the Granger Causality Test (Section 5.1) on these time series to determine whether the activity of certain bots Granger-cause more or less discussion around particular LIWC categories.
We apply pairwise Granger Causality Tests between each Botometer timeseries, , and each LIWC timeseries, , for lags/hours (see Eq. 3 and 4 in Section 5.1). This time window is chosen as it is reasonable to assume a majority of the effects from bots will occur over this time frame. The validity of this assumption is explored below.
We use the F-score from the Granger Causality Test as a measure of how ‘influential’ a type of bot is on each LIWC category. To get a sense of direction for these relationships, we use the sign of the largest coefficient from Eq. 4 in Section 5.1. We multiply the sign of this coefficient by the F-score from the Granger Causality Test to obtain a measure of strength and direction, referring to this as the Bot Effect Strength and Direction. Moreover, we use the lag of the largest coefficient from Eq. 4 in Section 5.1 to represent the most prolific lag in the relationship. We use the p-value from the Granger Causality Test to determine whether the effects are significant, and perform a Bonferroni Adjustment to adjust for multiple hypothesis tests. The results are displayed in Figure 6, where we have only included the significant relationships. The number in the centre of each square represents the most prolific lag – we interpret this as the number of hours until the effects of the bot activity are most pronounced.

Figure 6 shows that bots do have a significant impact on discussions of certain LIWC categories. To better understand what each of these LIWC categories represent, we generated word clouds of the words from each LIWC category that appeared in the dataset. The size of the words represent their relative frequency in the data – the larger the word the more frequently it occurs. The word clouds for Angst, Motion and Work are shown in Figures 7(a), 7(b) and 7(c), respectively. For a full discussion of the words associated with various LIWC categories, see Pennebaker and Francis [28].


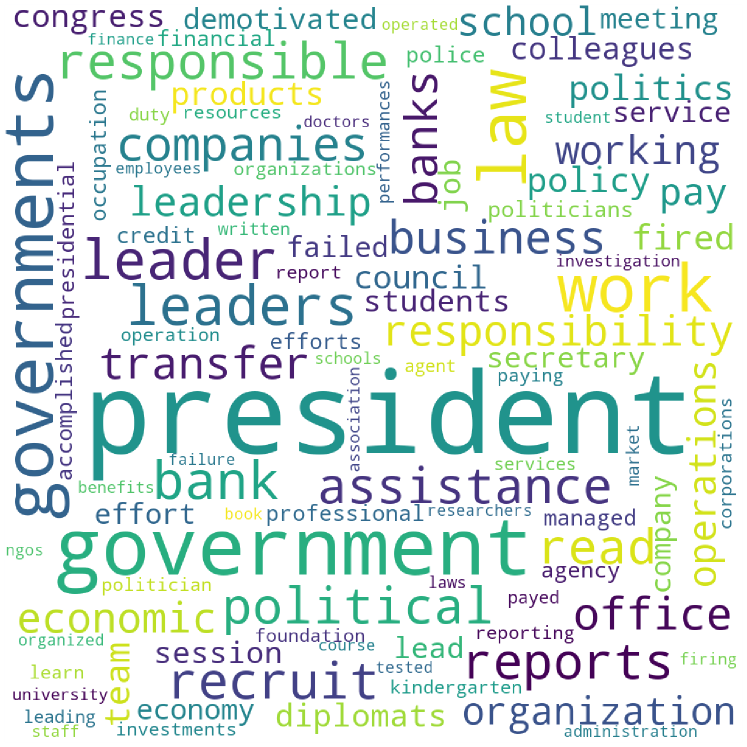
In Figure 6, the self-declared bots have greatest amount of influence on a number of discussions. In particular, the self-declared bots increase discussions around angst, friends, motion, time, work and the usage of filler words, but decrease the usage of function words. Moreover, it is apparent that these bots most strongly influence discussion of the work category (with a most prolific lag of five hours). Figure 7(c) shows that most of the discussion around work is involved with governing bodies, with ‘president’ and ‘governments’ being the most commonly used words. While it is difficult to assert exactly why these bots are driving more discussions of work, we gain further understanding by also observing that self declared bots Granger-cause more angst (with a most prolific lag after 7 hours). Combining these two observations suggests that self-declared bots drive more angst about governing bodies. From a pro-Russian perspective, this may be to cause more disruption in the West, and from a pro-Ukrainian perspective, this may be to cause more disruption in Russia. Figure 3 shows a fairly even probability of pro-Russia and pro-Ukraine accounts being self-declared bots. Although the exact origin of self-declared accounts is unknown, it is worth noting that we considered predominately English accounts. It is therefore more likely that the intention of these accounts was to drive more disruption in English-speaking countries.

Observe that Fake Follower, Spammer and Other bots also increase angst (all with the most prolific lag after 7 hours). Figure 7(a) shows that a majority of angst-related words are surrounding fear and worry. Hence, we argue that self-declared, fake follower, spammer and other forms of automated account types combine to increase fear in the overall discussion of the Russia/Ukraine war. This observation has been hypothesised by many authors [24, 26], but a detailed analysis has been lacking and may be of concern for many governments and defence organisations.
Figure 6 further shows that fake follower, self-declared, spammer and other bot types also increase online discussion around motion. In Figure 7(b), we see a number of motion related words that are potentially associated with staying or fleeing the country. Combining this with increases in Angst suggests that bots could be influencing people’s decisions surrounding whether to flee their homes or not. Druziuk [11] noted that bots have allowed “Ukrainians to report to the government when they spot Russian troops”, but the usage of bots to influence people on staying/leaving the country is something not observed before. However, it is difficult to denote whether this is being done in support of Ukraine, Russia or both.
In Figure 6 the most prolific lag is mostly consistent for a given LIWC category, but varies greatly for bot type. Hence, the time which bots effect a given discussion on the war depends mainly on the topic of discussion and not on the type of bot. For instance, we observe that Fake Follower, Self-Declared, Spammer and Other bots all most prolifically effect discussions of work after five hours. To further examine the effects of the lag on discussion of different LIWC categories, we plot cross correlations in Figure 8. These plots represent the cross correlation between Self-Declared bot proportions and a number of significant LIWC categories (in Figure 6) over 48 hours.
The direction of the effect for each LIWC variable in Figure 8 is consistent with Figure 6, further validating our results. This direction is consistent for all significant lags, justifying our decision to choose the largest parameter in the regression model as an indication of direction in Figure 6. For some LIWC categories the effects of Self-Declared bots linger over many lags but for others the effects diminish relatively quickly. For instance, the effects on the work category and the function category are significant for lags almost up to 48 hours, whereas the effects on the angst and filler categories diminish within 24 hours.
7 Conclusion
This work investigates if and how bot-like accounts influence the online conversation around the Russian invasion of Ukraine during February 2022. We showed which account groups have measurable influence by aggregating accounts using their national lean and account bot-type label. The patterns of information flows between bot and non-bot account vary based on national lean: Pro-Russian non-bot accounts are most influential overall, with information flows to a variety of other account groups. No significant outward flows exist from pro-Ukrainian non-bot accounts, with significant flows from pro-Ukrainian bot accounts into pro-Ukrainian non-bot accounts. Pro-Russian account groups are seemingly isolated, with smaller self-entropy rates and less significant between group net information flows. However, there exists significant information flows out of pro-Russia non-bot and AstroTurf account groups, with the largest net flows originating in the pro-Russian non-bot account groups. Contrastingly, pro-Ukrainian account groups tend to have more information flows between pro-Ukrainian and balanced account groups. Pro-Ukrainian aggregated groups also tend to have higher self-entropy rates.
To understand how bot-like accounts influence non-bot like accounts across all national lean types, we consider non-bot sentiment, measured using a weighted compound sentiment score. By weighting this by the overall bot probability, this compound sentiment reflects the overall sentiment of non-bot-like accounts across the network. The relationship between this sentiment and the bot activity is significant but occurs in both directions, with sentiment and bot activity both impacting each other.
Finally, we identify the effect of bot-like accounts on LIWC linguistic discussion features. Self-declared bots have the largest impact, showing significant relationships with word in the Function, Angst, Friend, Motion, Time, Work and Filler categories. To find the direction and significance of these relationships we use pairwise Granger causality tests. We find bots generally increase word usage in these categories with a 3-10 hour lag. Self-declared bots show the strongest relationship with Work discussions, i.e., words pertaining to governing bodies (“president”, “government” and “leadership”). We also see bot accounts increase the use of words in the angst category which contains words related to fear and worry (“shame”, “terrorist”, “threat”, “panic”).
In future work, we will explore information contained on the network of interactions between users recorded in the tweets using a network science approach [3, 23, 4]. We will also further explore diverse ways to classify the national lean of authors based on their published Twitter content. Preliminary results indicate heavy-tailed distributions in timing lags that differ between account types, suggesting differences in coordinated activity signatures [20]. We will examine coordination campaigns and coordination networks [34, 12, 27, 14, 19] to quantify the impact of coordinated activity in the social network structure and to further investigate its influence on social media users.
Using a number of approaches we describe a framework to understand the impact of bots on the network, explore how malicious campaigns operate and measure their effect on online discussion. Our approach is applicable to any social media content presenting polarisation between distinct groups and can be applied to other data to understand how malicious campaigns operate.
8 Acknowledgements
B.S. would like to acknowledge the support of a Westpac Future Leaders Scholarship. L.M. and M.R. are supported by the Australian Government through the Australian Research Council’s Discovery Projects funding scheme (project DP210103700). L.M. also acknowledges support from the Australian Defence Science and Technology Group ORNet scheme.
References
- [1] Bagrow, J.P., Liu, X., Mitchell, L.: Information flow reveals prediction limits in online social activity. Nature Human Behaviour 3(2), 122–128 (Feb 2019). https://doi.org/10.1038/s41562-018-0510-5
- [2] Bagrow, J.P., Mitchell, L.: The quoter model: A paradigmatic model of the social flow of written information. Chaos: An Interdisciplinary Journal of Nonlinear Science 28(7), 075304 (2018)
- [3] Barabási, A.L.: Network science. Cambridge university press (2016)
- [4] Caldarelli, G.: Scale-free networks: complex webs in nature and technology. Oxford University Press (2007)
- [5] Champion, M., Krasnolutska, D.: Ukraine’s TV comedian President Volodymyr Zelenskyy finds his role as wartime leader (Feb 2022), https://www.japantimes.co.jp/news/2022/02/26/world/volodymyr-zelenskyy-wartime-president/
- [6] Chen, E., Ferrara, E.: Tweets in time of conflict: A public dataset tracking the twitter discourse on the war between Ukraine and Russia. arXiv preprint arXiv:2203.07488 (2022)
- [7] Collins, B.: After Mueller report, Twitter bots pushed ‘Russiagate hoax’ narrative (2019), https://www.nbcnews.com/tech/tech-news/after-mueller-report-twitter-bots-pushed-russiagate-hoax-narrative-n997441, Accessed 19/6/2022
- [8] Collins, B., Korecki, N.: Twitter bans over 100 accounts that pushed #IStandWithPutin. https://www.nbcnews.com/tech/internet/twitter-bans-100-accounts-pushed-istandwithputin-rcna18655 (Mar 2022)
- [9] Cresci, S., Di Pietro, R., Petrocchi, M., Spognardi, A., Tesconi, M.: The Paradigm-Shift of Social Spambots: Evidence, Theories, and Tools for the Arms Race. In: Proceedings of the 26th International Conference on World Wide Web Companion. pp. 963–972. WWW ’17 Companion, International World Wide Web Conferences Steering Committee, Republic and Canton of Geneva, CHE (Apr 2017). https://doi.org/10.1145/3041021.3055135
- [10] Doroshenko, L., Lukito, J.: Trollfare: Russia’s disinformation campaign during military conflict in Ukraine. International Journal of Communication 15, 4662–4689 (2021)
- [11] Druziuk, Y.: A citizen-like chatbot allows Ukrainians to report to the government when they spot Russian troops - here’s how it works. Business Insider (Apr 2022), https://www.businessinsider.com/ukraine-military-e-enemy-telegram-app-2022-4, Accessed on 19/6/2022
- [12] Giglietto, F., Righetti, N., Rossi, L., Marino, G.: It takes a village to manipulate the media: coordinated link sharing behavior during 2018 and 2019 italian elections. Information, Communication & Society 23(6), 867–891 (2020). https://doi.org/10.1080/1369118X.2020.1739732
- [13] Hutto, C., Gilbert, E.: Vader: A parsimonious rule-based model for sentiment analysis of social media text. In: Proceedings of the international AAAI conference on web and social media. vol. 8, pp. 216–225 (2014)
- [14] Keller, F.B., Schoch, D., Stier, S., Yang, J.: Political astroturfing on twitter: How to coordinate a disinformation campaign. Political Communication 37(2), 256–280 (2020)
- [15] Keller, T.R., Klinger, U.: Social Bots in Election Campaigns: Theoretical, Empirical, and Methodological Implications. Political Communication 36(1), 171–189 (Jan 2019). https://doi.org/10.1080/10584609.2018.1526238
- [16] Klepper, D.: Russian propaganda ‘outgunned’ by social media rebuttals. AP NEWS (Mar 2022), https://tinyurl.com/3x9anuta, section: Russia-Ukraine war
- [17] Kontoyiannis, I., Algoet, P.H., Suhov, Y.M., Wyner, A.J.: Nonparametric entropy estimation for stationary processes and random fields, with applications to english text. IEEE Transactions on Information Theory 44(3), 1319–1327 (1998)
- [18] Laurence, P.: How Ukraine’s ‘Ghost of Kyiv’ legendary pilot was born. BBC News (May 2022), https://www.bbc.com/news/world-europe-61285833, Accessed 19/6/2022
- [19] Lukito, J.: Coordinating a multi-platform disinformation campaign: Internet research agency activity on three us social media platforms, 2015 to 2017. Political Communication 37(2), 238–255 (2020). https://doi.org/10.1080/10584609.2019.1661889
- [20] Mathews, P., Mitchell, L., Nguyen, G., Bean, N.: The nature and origin of heavy tails in retweet activity. In: Proceedings of the 26th International Conference on World Wide Web Companion. pp. 1493–1498 (2017)
- [21] Matthews, B.: Best time to tweet for clicks, retweets and engagement. Empower Agency (Jun 2015), https://empower.agency/best-time-to-tweet-clicks-retweets-engagement/, Accessed 19/6/2022
- [22] Muscat, S., Siebert, Z.: Laptop generals and bot armies: The digital front of Russia’s Ukraine war (Mar 2022), https://eu.boell.org/en/2022/03/01/laptop-generals-and-bot-armies-digital-front-russias-ukraine-war, Accessed 19/6/2022
- [23] Newman, M.: Networks. Oxford university press (2018)
- [24] Nguyen, K.: How Putin’s propaganda is sowing seeds of doubt to deny sympathy for Ukraine. ABC News (Apr 2022)
- [25] Orabi, M., Mouheb, D., Al Aghbari, Z., Kamel, I.: Detection of Bots in Social Media: A Systematic Review. Information Processing & Management 57(4), 102250 (Jul 2020). https://doi.org/10.1016/j.ipm.2020.102250
- [26] Osborne, C.: Ukraine destroys five bot farms that were spreading ‘panic’ among citizens. https://www.zdnet.com/article/ukraine-takes-out-five-bot-farms-spreading-panic-among-citizens/ (Mar 2022)
- [27] Pacheco, D., Hui, P.M., Torres-Lugo, C., Truong, B.T., Flammini, A., Menczer, F.: Uncovering coordinated networks on social media: methods and case studies. In: Proceedings of the AAAI international conference on web and social media (ICWSM). pp. 455–466 (2021)
- [28] Pennebaker, J.W., Francis, M.E.: Cognitive, Emotional, and Language Processes in Disclosure. Cognition and Emotion 10(6), 601–626 (Nov 1996). https://doi.org/10.1080/026999396380079
- [29] Pennebaker, J.W., Francis, M.E., Booth, R.J.: Linguistic inquiry and word count: Liwc 2001. Mahway: Lawrence Erlbaum Associates 71(2001), 2001 (2001)
- [30] Polyzos, E.S.: Escalating tension and the war in Ukraine: Evidence using impulse response functions on economic indicators and twitter sentiment. Available at SSRN 4058364 (2022)
- [31] Pond, T., Magsarjav, S., South, T., Mitchell, L., Bagrow, J.P.: Complex contagion features without social reinforcement in a model of social information flow. Entropy 22(3), 265 (Mar 2020). https://doi.org/10.3390/e22030265
- [32] Purtill, J.: When it comes to spreading disinformation online, Russia has a massive bot army on its side. ABC News (Mar 2022)
- [33] Sayyadiharikandeh, M., Varol, O., Yang, K.C., Flammini, A., Menczer, F.: Detection of Novel Social Bots by Ensembles of Specialized Classifiers. In: Proceedings of the 29th ACM International Conference on Information & Knowledge Management. pp. 2725–2732 (Oct 2020). https://doi.org/10.1145/3340531.3412698
- [34] Schoch, D., Keller, F.B., Stier, S., Yang, J.: Coordination patterns reveal online political astroturfing across the world. Scientific reports 12(1), 4572 (2022). https://doi.org/10.1038/s41598-022-08404-9
- [35] Shane, S.: The fake americans Russia created to influence the election. The New York Times (Sep 2017), https://www.nytimes.com/2017/09/07/us/politics/russia-facebook-twitter-election.html, Accessed 19/6/2022
- [36] South, T., Smart, B., Roughan, M., Mitchell, L.: Information flow estimation: a study of news on Twitter. Tech. Rep. arXiv:2205.06029, arXiv (May 2022). https://doi.org/10.48550/arXiv.2205.06029, http://arxiv.org/abs/2205.06029, arXiv:2205.06029 [physics] type: article
- [37] Stella, M., Ferrara, E., Domenico, M.D.: Bots increase exposure to negative and inflammatory content in online social systems. Proceedings of the National Academy of Sciences 115(49), 12435–12440 (2018). https://doi.org/10.1073/pnas.1803470115, https://www.pnas.org/doi/abs/10.1073/pnas.1803470115
- [38] Thomas, T.: Russia’s reflexive control theory and the military. Journal of Slavic Military Studies 17(2), 237–256 (2004). https://doi.org/10.1080/13518040490450529
- [39] Watt, J., Smart, B.: Tweets discussing the Russia/Ukraine War (August 2022). https://doi.org/10.6084/m9.figshare.20486910.v4, https://figshare.com/articles/dataset/Tweet_IDs_Botometer_results/20486910
- [40] Wong, E.: U.S. fights bioweapons disinformation pushed by Russia and China. The New York Times (Mar 2022), https://www.nytimes.com/2022/03/10/us/politics/russia-ukraine-china-bioweapons.html, Accessed on 19/6/2022
- [41] Yang, K.C., Ferrara, E., Menczer, F.: Botometer 101: Social bot practicum for computational social scientists (Jan 2022). https://doi.org/10.48550/arXiv.2201.01608