IoTAthena: Unveiling IoT Device Activities from Network Traffic
Abstract
The recent spate of cyber attacks towards Internet of Things (IoT) devices in smart homes calls for effective techniques to understand, characterize, and unveil IoT device activities. In this paper, we present a new system, named IoTAthena, to unveil IoT device activities from raw network traffic consisting of timestamped IP packets. IoTAthena characterizes each IoT device activity using an activity signature consisting of an ordered sequence of IP packets with inter-packet time intervals. IoTAthena has two novel polynomial time algorithms, sigMatch and actExtract. For any given signature, sigMatch can capture all matches of the signature in the raw network traffic. Using sigMatch as a subfunction, actExtract can accurately unveil the sequence of various IoT device activities from the raw network traffic. Using the network traffic of heterogeneous IoT devices collected at the router of a real-world smart home testbed and a public IoT dataset, we demonstrate that IoTAthena is able to characterize and generate activity signatures of IoT device activities and accurately unveil the sequence of IoT device activities from raw network traffic.
Keywords: Wireless networking, IP packets, network traffic collection and analysis, time-sensitive subsequence matching, polynomial time algorithms, unveiling IoT device activities.
1 Introduction
In today’s smart homes, various IoT devices can connect to the Internet via home routers with wired cable connections or wireless communications such as WiFi, Bluetooth, and ZigBee. The proliferating IoT devices in smart homes bring many innovative applications and services such as improved home automation and safety, efficient energy, and connected healthcare. However, the recent spate of cyber attacks and threats [4, 20, 15, 31, 32, 26, 37, 33, 47, 8] towards a wide range of IoT devices with flawed system designs and weak security management calls for effective techniques to understand, characterize, and unveil the detailed activities of heterogeneous IoT devices, e.g., when and how a smart lock is opened.
In the research literature, there have been some prior studies on characterizing behavioral patterns of IoT devices and identifying IoT device types and activities using supervised machine learning models or the simple request/reply pattern matching [24, 6, 36, 42, 40, 41, 28, 2, 38, 45, 19]. However, little effort has been devoted to the understanding and characterization of full and detailed signatures of IoT device activities which shed light on when and how IoT devices communicate with cloud servers and smartphones for carrying out what device activities.
This paper presents IoTAthena, a system to generate detailed signatures of IoT device activities from IoT network traffic and to unveil IoT device activities via time-sensitive subsequence matching. IoTAthena first collects the background traffic of IoT devices and the normal network traffic triggered by IoT device activities with packet capturing tools on programmable home routers. It then characterizes each IoT device activity using an activity signature consisting of an ordered sequence of IP packets with inter-packet time intervals111An inter-packet time interval is calculated from the timestamp difference of two consecutive IP packets in the packet sequence..
Our IoT device activity signature generation is inspired by PingPong [38], which generates packet-level signatures of IoT device activities in the form of abstracted packet-pairs with ping/pong, i.e., request/reply, patterns. It has been demonstrated [38] that many IoT device activities can be efficiently captured with the use of ping/pong like signatures. However, such short signatures have their limitations. For example, our experiments of running the PingPong open source package were unable to generate signatures of the WiFi and Bluetooth locking or unlocking activities of August Lock, as well as the autolocking activity. In contrast, IoTAthena’s detailed activity signature carries crucial information for characterizing more IoT device activities than [38] and differentiating IoT device activities with overlapping packet pairs or packet sequences.
To unveil IoT device activities from network traffic logs, IoTAthena relies on two novel algorithms, sigMatch and actExtract. The sigMatch algorithm can effectively capture all matches of a given activity signature from the network traffic log in polynomial time. Using sigMatch as a subfunction, the actExtract algorithm can accurately unveil the sequence of IoT device activities from raw network traffic logs, also in polynomial time. Our experimental evaluations of IoTAthena were based on IoT devices in a real-world smart home environment, and a public IoT dataset of IoT devices [30]. Our experimental results showed that IoTAthena can effectively generate the detailed signatures of IoT device activities and accurately unveil future activities of these IoT devices.
The main contributions of this paper are the following:
-
•
We develop a systematic approach to programmatically generate detailed signatures of IoT device activities consisting of an ordered sequence of IP packets with inter-packet time intervals.
-
•
We design two novel polynomial time algorithms, sigMatch and actExtract, for capturing all matches of a given IoT device activity signature and unveiling activity sequences of all IoT devices from the network traffic logs.
-
•
We conduct extensive experiments using a smart home testbed and a public IoT dataset [30] to demonstrate that IoTAthena can accurately capture the activities of a wide range of heterogeneous IoT devices.
The remainder of this paper is organized as follows. We first discuss the related work in Section 2. In Section 3, we present an overview of the IoTAthena system. In Section 4, we describe how IoTAthena collects IoT network traffic, and analyzes and characterizes the background traffic of IoT devices. In Section 5, we formally define the IoT device activity signatures, and describe the process of generating the signature for each device activity. In Section 6, we present the sigMatch and actExtract algorithms with theoretical analysis. In Section 7, we present our experimental evaluation results. Section 8 concludes the paper and outlines our future work.
2 Related Work
The recent growth and deployment of IoT devices in smart homes have attracted the networking research community to study the traffic characterization and behavioral fingerprinting of IoT devices, and explore network traffic to discover IoT devices’ types and activities. Most of the existing studies [24, 42, 40, 30, 12, 35, 14, 18, 22, 13, 17, 44, 48] in IoT traffic characterization and fingerprinting are interested in a wide range of traffic features from TCP/IP protocols as well as from IoT wireless communication channels. For example, [17] utilizes the wireless radio propagation patterns of IoT devices for secure authentication. [48, 44] explore the captured WiFi signals in home network for applications of localization and positioning. [42, 40], on the other hand, examine the home network traffic at flow level to model and profile IoT devices. These prior research provide critical insights for understanding traffic patterns of heterogeneous IoT devices and identifying IoT device models or types for IoT device discovery and management, IoT application performance monitoring, and vulnerability and security analysis.
In light of the recent IoT Botnets exploiting and control thousands of vulnerable IoT devices [4, 3, 21, 10, 11, 27, 25, 43, 15], some research efforts have proposed innovative methods of classifying IoT devices based on machine learning, statistical inference, or passive traffic measurement [24, 6, 36]. For example, the IoTSentinel system [24] first extracts traffic features of IoT network traffic, and subsequently builds Random Forest classifiers to identify IoT device types. Similarly, IoTSense [6] fingerprints the behaviors of IoT device types with feature vectors from packet headers and payload, and builds several machine learning classifiers for effectively detecting IoT device types based on the trained behavioral fingerprinting. The research in [36] first monitors a smart IoT environment with various IoT devices for six months for extensive IoT network traffic analysis, and then builds a machine learning framework for classifying IoT device types.
As homeowners continue to deploy smart home IoT devices such as smart locks and security cameras for mission-critical applications, accurately identifying IoT device activities via supervised machine learning models [28, 2] and deterministic inference [38, 45] becomes an urgent research problem. For example, HomeSnitch [28] constructs bidirectional application data unit exchanges for representing IoT application behaviors and applies supervised machine learning classifiers to classify IoT application behaviors and identifying unknown behaviors. Similarly, Peek-a-Boo [2] demonstrates the feasibility of identifying the types, states, and IoT devices’ activities via machine learning techniques from an attacker’s perspective. The closest work to ours is PingPong [38], which explores the sequential and directional “ping/pong” behavioral patterns between cloud servers and IoT devices or between cloud servers and smartphones. The experiments in [38] have shown that the simple ping/pong packet-pairs with payload size and traffic directions can effectively detect many IoT devices’ activities. HoMonit [45], another work of deterministically detecting IoT device activity, monitors encrypted wireless traffic of some home apps and infers smart app activities based on the deterministic finite automaton (DFA) model of smart app behavior and wireless side-channel analysis. IoTGaze [13] also builds up a system to identify IoT device activities using the sniffed wireless traffic.
Inspired and motivated by these studies on identifying IoT device types and/or activities, our proposed IoTAthena system is focused on understanding traffic signatures of IoT device activities and accurately extracting device activities from IoT network traffic. The insights from the unveiled IoT device activities have a broad range of applications such as anomaly detection, e.g., an unauthorized user is watching the video stream of the surveillance camera, IoT device malfunction detection, e.g., a smart plug shows two consecutive on activities, and smart home safety, e.g., the smart lock was unlocked remotely by an unauthorized user.
Note that our work is significantly different from [24, 6, 36] in the way that our objective is generating signatures for concrete IoT device activities such as on or off activities of a smart plug and unveiling these activities from network traffic, instead of identifying IoT device models or types. Different from machine learning based solutions [28, 2], IoTAthena adopts a white-box approach to programmatically generate activity signatures of IoT device activities consisting of ordered sequences of IP data packets with relative timestamps. IoTAthena’s signature generation module is inspired by PingPong [38], but it generates a full signature for each IoT device activity and introduces a novel time-sensitive subsequence matching approach for unveiling IoT device activities from new IoT network traffic logs.
3 IoTAthena System Overview
Developing effective techniques to understand and report IoT device activities, e.g., the smart lock of the home’s main entrance is unlocked remotely with a smartphone app, is crucial for ensuring the physical and property safety of these devices’ homeowners. Our real-world experiments with August Lock and other IoT devices demonstrated the feasibility of developing an automated system to learn and generate signatures of IoT device activities and use them for unveiling IoT device activities from network traffic logs. Such a system is urgently needed for understanding what is happening to IoT devices in millions of smart homes and for detecting suspicious and unauthorized behaviors towards critical home devices.
In this paper, we propose a new system, named IoTAthena, to automatically and accurately unveil IoT device activities from smart home network traffic logs. Fig. 1 illustrates the overall architecture of IoTAthena, which includes four key system modules: i) IoT network traffic analysis, ii) IoT device activity signature generation, iii) time-sensitive subsequence matching, and iv) IoT device activity extraction.

The IoT network traffic analysis module takes IoT network traffic during the intentionally “silent” period, and characterizes background network traffic for each IoT device. The IoT device activity signature generation module collects the corresponding network traffic of each IoT device activity by intentionally triggering the activity and collecting the traffic. The collected IoT network traffic along with the labelled activity logs serve as the ground truth for generating the signature of each IoT device activity consisting of an ordered sequence of IP packets with inter-packet time intervals. The time-sensitive subsequence matching module relies on the sigMatch algorithm to capture all matches of each IoT device activity signature in the network traffic log, while the IoT device activity extraction module relies on actExtract to unveil the sequence of IoT device activities from the network traffic log.
In summary, IoTAthena adopts a white-box approach to first generate signatures of IoT device activities consisting of ordered sequences of IP packets with inter-packet time interval information. Subsequently, IoTAthena applies efficient matching algorithms for deterministically unveiling the sequence of IoT device activities from the network traffic log, unlike black-box machine learning classification models [24, 6, 36, 2].
4 Network Traffic Collection and Analysis
Network traffic of IoT devices embeds rich information on device types and their behavioral patterns [30, 36]. In this section, we describe how to collect and analyze IoT network traffic in order to characterize and generate signatures of IoT device activities.
4-A IoT Network Traffic Collection
Fig. 2 illustrates the data flows initiated from an IoT device or destined to an IoT device in a smart home environment. For clarity, we use two IoT devices as examples: a smart lock and a security camera. A user usually interacts with an IoT device using the device’s companion app on the smartphone in the home or outside the home, e.g., in the office or on the road. The app first communicates with the cloud server which in turn generates traffic between the cloud server and the device, as illustrated by the solid red line between the smart lock and the cloud server. Sometimes, the smartphone directly communicates with the device without involving the cloud server, such as streaming request on the security camera, illustrated by the solid green line between the smart phone and the security camera.

The user can also manually operate the device in the traditional way, such as locking the smart lock manually. This action causes the device to update its status to the cloud server immediately following the action. In addition, the user can communicate directly with the device locally through a non-WiFi communication channel, such as Bluetooth or ultrawideband (UWB) when the user is in the vicinity of the device. This action also causes device initiated status updates. Furthermore, automatic device operations such as the smart lock’s autolocking function also introduce status update traffic. These types of device initiated communications are illustrated by the dashed red line. There also exists traffic introduced by device background operations such as device firmware update checks. We use the dotted red line between the smart lock and the cloud server to illustrate these data flows.
IoTAthena collects the network traffic at the programmable home router, which enables the capture of incoming and outgoing packets of all above mentioned device-related operations. The smart home router is a desirable centralized location for data collection, considering its switching and routing function, sufficient computational and processing capacities, and the design transparency to IoT devices and apps. In our experiments, we used Linksys WRT1900AC WiFi home routers which run the open-source Linux-based OpenWrt operating system for network traffic collection. The data processing and analysis were performed offline in this study. One of our future work is designing and implementing a prototype system on commodity home routers to evaluate the real-time feasibility of IoTAthena for unveiling IoT device activities on the fly.
4-B IoT Network Traffic Analysis
The network traffic collected at the home router can be classified into two parts: the first part consists of traffic between the IoT devices and the cloud servers, while the second part consists of internal LAN traffic such as address resolution protocol (ARP) requests and simple service discovery protocol (SSDP) broadcast packets. In order to separate the logs of an individual IoT device from the mixed home network traffic, IoTAthena first identifies each device’s unique IP address via the mapping of its media access control (MAC) address and host name in the dynamic host configuration protocol (DHCP) packets. It subsequently uses the device IP address as the unique cluster key to separate IoT network traffic into individual traffic clusters to simplify further analysis.
We carefully studied the network traffic within each individual traffic cluster of an IoT device. We can clearly observe the network traffic one would anticipate for normal IoT device activities, e.g., users issuing locking or unlocking commands for August Lock via the smartphone app. Surprisingly, we also discovered a significant amount of network traffic when there is no human-triggered or environment-triggered activity. We use the term background traffic to denote such network traffic, i.e., network traffic not triggered by human or environment. In order to gain a thorough understanding of IoT background traffic, we left the devices in our controlled smart home environment without any human interactions for one week and consider the network traffic cluster of each IoT device during this “silent” period as background traffic. By separating IP data packets based on the destination (and source) ports of the outgoing (and incoming) traffic, we observed that these IoT devices typically exchange messages with the remote cloud servers on the well-known application ports such as 22/TCP (SSH), 53/UDP (DNS), 80/TCP (HTTP), 123/UDP (NTP), 5353/UDP (mDNS). This observation leads us to classify IoT background traffic into three categories: management and service, signal and update, and random noise.
The management and service traffic is mainly used to manage and maintain the devices, e.g., periodical time synchronizations with NTP servers. The signal and update traffic corresponds to keep-alive signals and regular firewall update checks between IoT devices and cloud servers. The random noise traffic is mostly generated by other IoT or non-IoT devices in the local home network for a variety of reasons, e.g., ARP requests, SSDP broadcasts, and multicast DNS (mDNS) traffic from Apple Bonjour protocol for automatic device and service discovery.
The background traffic analysis not only removes unnecessary noise for characterizing and generating signatures of IoT device activities, but also sheds light on the potential vulnerabilities of the protocol stacks of mission-critical IoT devices in millions of smart homes. For example, our analysis discovered the usage of non-encrypted and insecure Telnet and HTTP sessions between some camera devices and cloud servers, for logins and firmware update checks. Discovering and mitigating security weaknesses of IoT devices is beyond the scope of this paper.
5 IoT Device Activity Signatures
Consistent with the findings of PingPong [38], we observed repetitive network packet sequences that correspond to repeated device activities in the network traffic collected at the router of the smart home network. We also observed certain August Lock activities resulting packet sequences that are challenging for PingPong to recognize. Fig. 3 illustrates such an example. The Bluetooth (un)locking222The locking activity and the unlocking activity exhibit the same packet sequences and inter-packet time intervals because of the simple lock/unlock state transitions. The encrypted application data prevents us for further differentiating these two activities with network traffic only. We generate a unique signature for each indistinguishable activity group. For example, we use (un)locking for short to denote either the locking activity or the unlocking activity. Similarly, we use on or off to denote either the on activity or the off activity. activity’s packet sequence ( pairs as illustrated in Fig. 3(b)) is a subset of the WiFi (un)locking activity’s packet sequence ( pairs as illustrated in Fig. 3(a)). The clustering of re-occurring packet pairs approach in PingPong cannot distinguish WiFi (un)locking from Bluetooth (un)locking. In fact, it is difficult to distinguish these two activities in the network traffic solely based on request/reply patterns, which leads us to consider more information (the full detailed packet sequence) and inter-packet time intervals to characterize IoT device activities. The time intervals between consecutive packets provide critical information to effectively and accurately differentiate IoT device activities such as those in Fig. 3 that share overlapping packet sequences and happen very closely in time.


5-A Inter-Packet Time Interval Measurement
Because IoTAthena collects network traffic at the home router, the inter-packet time interval is essentially the round-trip time (RTT) between the home router and IoT devices in the smart home plus the processing time at the device (LAN). The time interval could also be the RTT between the home router and cloud servers across the Internet plus the processing time at the cloud server (WAN).

Fig. 4 illustrates the time interval between the first and second packets (left plot), and the time interval between the second and third packets (right plot), of repeated on activities of TP-Link Plug over a -hour span. We observe that the inter-packet time intervals exhibit stable and consistent patterns, with small variances. However, the time interval between one pair of consecutive packets may significantly differ from that between another pair of consecutive packets. Specifically, the interval between the first and second packets has a mean () of and a standard deviation () of , while the interval between the second and third packets has a mean () of and a standard deviation () of for TP-Link Plug’s on activity. The unstable wireless channel between the IoT devices and the home router could result in packet loss and retransmission which contribute to the fluctuation in the LAN inter-packet time intervals. The uncertain number of retransmissions in the MAC layer affects the inter-packet time intervals in our collected traffic log. However, compared with the short wireless transmission delay, the local processing time at the IoT device still dominates the LAN inter-packet time intervals, as we observe from the right plot in Fig. 4. These key observations inspire us to include inter-packet time intervals as an important component in characterizing the signatures of IoT device activities.
5-B IoT Device Activity Signature Definition
A network data packet collected at the home router is an -tuple, where the first through eighth fields are timestamp, IoT device internal IP address, canonical remote cloud server name, remote application port, protocol, traffic direction, packet length, and application-layer data, respectively. It is important to note that each TCP/IP data packet carries a variety of traffic features including those in the 8-tuple. However, this study only selects the features that provide additional information on identifying and differentiating IoT device activities, while skipping the features, e.g., Time to Live (TTL), sequence and acknowledgement numbers with redundant or little contributions towards device activity identification.
We use to denote the timestamp of packet , and use to denote the -tuple obtained by deleting the first field (timestamp) in . We call the base packet of packet .
Definition 1
The signature of an IoT device activity is given by an ordered sequence of base packets , together with an ordered sequence of inter-packet time intervals , where is the time interval between the th packet and the th packet, . The number of base packets, , in each device activity signature is determined by the observed TCP/IP data packets triggered by the activity minus the protocol-specific packets, e.g., TCP three-way handshake, and the regular heart-beat signals between the device and the remote cloud server.
Instead of using and to represent a signature, we can equivalently represent the same signature using a sequence of packets , where for and for . In this representation, the time interval between the th packet and the th packet can be uniquely computed by .
The signature of an IoT device activity is a constant, as defined in Definition 1. The above alternative representation of the signature, however, does not look like a constant in format. For example, for any given real number , and denote exactly the same signature, provided that , , for . Since and define exactly the same sequence of base packets and exactly the same sequence of inter-packet time intervals , we can use this alternative representation without losing any accuracy.
Given the above discussions, we will denote a signature of an IoT device activity using an ordered sequence of packets , where the timestamp fields are only used to compute the inter-packet time intervals . For this reason, we also call the timestamp fields in a signature relative timestamps. We set to for simplicity.
5-C Automated Signature Generation
Towards automatically generating activity signatures of IoT device activities, we first follow the same practice as [46] to compile a complete list of any given IoT device’s activities from the AndroidManifest.xml file of the device’s companion app. We then write scripts using command-line tool and scripting feature in Android Debug Bridge (ADB) to automate the user interactions with IoT devices such as turning on/off Philips Hue and (un)locking of August Lock. For all IoT devices in our lab, we trigger each of their activities times333This could be replaced by any reasonably large number. in order to remove randomness and gain statistically meaningful understanding of the activity packet sequence. The time interval between two consecutive triggers of the same activity was a random number in the range . Here we set the minimum -seconds time interval between two triggers to prevent the smartphone apps from freezing, i.e., becoming unresponsive, due to rapid back-to-back activity triggerings. The network traffic captured by IoTAthena during these “active” period provides the ground truth of activity signatures of IoT device activity.
Filtering the background traffic described in Section 4-B, which happens in parallel with the device activity, leads to an ordered sequence of timestamped IP packets exchanged between IoT devices and the cloud servers. Each packet in the sequence carries a variety of traffic features such as the timestamp of each packet, local IP address and port number of the IoT device, remote IP address and port number of the cloud server, protocol, packet length, and the actual application payload of IoT applications which are mostly encrypted for security and privacy reasons. For each packet, we continue to remove features with random and dynamic values due to the protocol designs, e.g., the random local port number at IoT devices in TCP connections with cloud servers and TCP sequence and acknowledge numbers. In addition, we transform certain traffic features to retain the stable values, e.g., converting dynamic IP addresses of load-balanced cloud servers to the canonical remote cloud server names.
The inter-packet time interval between the th packet and the th packet in the signature is set to the mean (over the tries) of the inter-packet time intervals. To simplify notations, we set to , and set , .
| Activity | Signature | Activity | Signature |
|---|---|---|---|
| Opening Mobile App (12 packets) | 0.000s lock:49157 rbs.august.com:443 637B 0.132s lock:49157 rbs.august.com:443 221B 0.204s rbs.august.com:443 lock:49157 237B 0.209s lock:49157 rbs.august.com:443 637B 0.327s lock:49157 rbs.august.com:443 237B 0.526s rbs.august.com:443 lock:49157 237B 0.602s lock:49157 rbs.august.com:443 637B 0.723s lock:49157 rbs.august.com:443 237B 0.823s rbs.august.com:443 lock:49157 237B 1.116s lock:49157 rbs.august.com:443 637B 1.205s lock:49157 rbs.august.com:443 221B 1.251s rbs.august.com:443 lock:49157 237B | Manual (Un)Locking (21 packets) | 0.000s lock:49157 rbs.august.com:443 637B 0.088s lock:49157 rbs.august.com:443 205B 0.134s rbs.august.com:443 lock:49157 237B 0.441s lock:49157 rbs.august.com:443 637B 0.526s lock:49157 rbs.august.com:443 221B 0.571s rbs.august.com:443 lock:49157 237B 0.581s lock:49157 rbs.august.com:443 637B 0.666s lock:49157 rbs.august.com:443 237B 0.712s rbs.august.com:443 lock:49157 237B 0.870s lock:49157 rbs.august.com:443 637B 0.954s lock:49157 rbs.august.com:443 237B 1.001s rbs.august.com:443 lock:49157 237B 1.078s lock:49157 rbs.august.com:443 637B 1.169s lock:49157 rbs.august.com:443 221B 1.214s rbs.august.com:443 lock:49157 237B 1.321s lock:49157 rbs.august.com:443 637B 1.410s lock:49157 rbs.august.com:443 221B 1.473s rbs.august.com:443 lock:49157 237B 1.559s lock:49157 rbs.august.com:443 637B 1.659s lock:49157 rbs.august.com:443 221B 1.707s rbs.august.com:443 lock:49157 237B |
| Autolocking (15 packets) | 0.000s lock:49157 rbs.august.com:443 637B 0.086s lock:49157 rbs.august.com:443 221B 0.129s rbs.august.com:443 lock:49157 237B 0.240s lock:49157 rbs.august.com:443 637B 0.329s lock:49157 rbs.august.com:443 221B 0.373s rbs.august.com:443 lock:49157 237B 0.990s lock:49157 rbs.august.com:443 637B 1.084s lock:49157 rbs.august.com:443 221B 1.127s rbs.august.com:443 lock:49157 237B 1.277s lock:49157 rbs.august.com:443 637B 1.366s lock:49157 rbs.august.com:443 221B 1.410s rbs.august.com:443 lock:49157 237B 1.549s lock:49157 rbs.august.com:443 637B 1.640s lock:49157 rbs.august.com:443 221B 1.679s rbs.august.com:443 lock:49157 237B | ||
| WiFi (Un)Locking (8 packets) | 0.000s rbs.august.com:443 lock:49156 413B 0.008s lock:49156 rbs.august.com:443 605B 0.254s rbs.august.com:443 lock:49156 413B 0.262s lock:49156 rbs.august.com:443 605B 1.426s rbs.august.com:443 lock:49156 413B 1.433s lock:49156 rbs.august.com:443 605B 1.670s rbs.august.com:443 lock:49156 413B 1.678s lock:49156 rbs.august.com:443 605B | ||
| Bluetooth (Un)Locking | 0.000s rbs.august.com:443 lock:49156 413B 0.016s lock:49156 rbs.august.com:443 605B 1.083s rbs.august.com:443 lock:49156 413B 1.098s lock:49156 rbs.august.com:443 605B 1.379s rbs.august.com:443 lock:49156 413B 1.395s lock:49156 rbs.august.com:443 605B |
TABLE 1 illustrates the signatures for various activities of the August Lock444In our experiments we noticed firmware updates of IoT devices might cause slight changes on the activity signatures.. Note that we have used the alternative representation of signatures. The signature shown in Fig. 3(a) corresponds to the lower-right box in TABLE 1. The signature shown in Fig. 3(b) corresponds to the lower-left box in TABLE 1. While the sequence of base packets in the signature for Bluetooth (un)locking (illustrated in Fig. 3(b)) is a subset of the sequence of base packets in the signature for WiFi (un)locking (illustrated in Fig. 3(a)), the additional information embedded in the inter-packet time intervals makes it possible to distinguish these two activities. With the aid of additional information on inter-packet time intervals, we can distinguish these two activities from network traffic logs, which are difficult to distinguish using the base packets only.
6 Algorithms for Unveiling IoT Device Activities from Network Traffic
Having discussed network traffic in Section 4 and device activity signatures in Section 5, we are now ready to present our algorithms for unveiling IoT device activities from network traffic logs. In Section 6-A, we formally define the IoT activity signature matching problem and the IoT activity extraction problem. In Section 6-B, we present the sigMatch algorithm for identifying all matches of a given signature in the network traffic log. In Section 6-C, we present the actExtract algorithm for unveiling the sequence of activities of an IoT device from the network traffic log. In Section 6-D, we discuss the limitations and extensions of our algorithms.
6-A Problem Formulation
As discussed in Section 4, an IoT network traffic log (denoted by ) is an ordered sequence of packets with increasing timestamps (i.e., for ). As discussed in Section 5, a signature of an IoT device activity (denoted by ) is an ordered sequence of packets with increasing relative timestamps (i.e., for ). Recall that and denote the -tuple obtained by deleting the timestamp in and the relative timestamp in , respectively. A signature set of an IoT device (denoted by ) is a set of distinct signatures , one signature per activity of the device. For ease of presentation, we will use activity and signature interchangeably in the rest of the paper.
In light of the end-to-end network latency variations on the Internet [9, 16, 29], we allow an inter-packet time interval tolerance as the “safety margin” for the measurement of when trying to find a match of a signature in the network log.
Let satisfy and be a given tolerance. Let and satisfy . We say that is a -valid match of , if
-
1.
, ;
-
2.
.
Let be a signature. Let be the matching tolerance vector, where is the tolerance for the matching of . Let be an increasing sequence of integers indicating the index of the location of a packet in the network log. We say that is an -valid match of signature in log , if is an -valid match of , for .
We study the following two related problems:
IoT activity signature matching: Given network traffic log , signature , and tolerance vector for , identify all -valid matches of signature in log .
IoT device activity extraction: Given network traffic log and signature set , find a sequence of IoT activities , whose execution leads to the network traffic log .
6-B Signature Matching via Time Sensitive Subsequence Matching
The IoT activity signature matching problem is different from the traditional subsequence matching problem [23] and the longest common subsequence problem [5, 7] due to the inter-packet time interval constraint. The matching problem with such constraints cannot be solved via the simple adjustment of existing algorithms. We solve the signature matching problem using a time-sensitive subsequence matching approach, called sigMatch, as presented in Algorithm 1.
For a given network traffic log and signature , together with a inter-packet time interval tolerance vector , we compute a DAG that captures all -valid matches of signature in log . The vertex set contains vertices in the form of , where is a potential match of . The edge set contains directed edges in the form of , where is an -valid match of for , and there is a directed path from vertex to a vertex (for some ).
If , vertex does not exist. If , vertex may exist. Each edge has the form for some . Hence we have and .
In Line 1 of Algorithm 1, both and are initialized to . The algorithm then populates the vertex set and the edge set while looping over the packets . For each , the algorithm loops over the packets . When , is a vertex in the DAG. For , is a vertex if and only if and is an -valid match of for some . In this case, is an edge in the DAG.

We use Fig. 5 to illustrate a running example of sigMatch. The goal is to identify all -valid matches of signature in log with tolerance vector . In this example, we have , denoted by the hexagon shape; we also have , denoted by the square shape. The timestamps (for traffic log) and relative timestamps (for signature) are inside the corresponding shape.
We start from . Since , vertex is added to ; Then we move to . Since , , and , vertex is added to and directed edge is added to . Similarly, vertices and are added to . Next, we pay attention to the row corresponding to . We found . For , we found , but the time interval does not match. For , we found , and the time interval matches. Hence vertex is added to , and edge is added to . For , we found , and the time interval matches. At this moment, vertex is already in , and edge is added to . We obtain the DAG as shown in Fig. 5 by continuing the above process.
Theorem 1
Algorithm sigMatch has a worst-case time complexity of , where is the number of packets in the signature , and is the number of packets in the network traffic log . Furthermore,
-
(a)
If is an -valid match of in , then is a directed path in , and .
-
(b)
If is a directed path in , then is an -valid match of in , and .
Proof. The loop over runs times. The loop over runs times. The loop over runs times, for each . This leads to the worst-case time complexity of .
From the condition in Line 7 of the algorithm, we notice that there is an edge in the form if and only if there is an -valid match of in that matches to , where . This leads to claims (a) and (b).
We point out that the total number of -valid matches of signature in may be exponential. However, all of them are captured by a polynomial sized DAG , which can be computed in polynomial time.
6-C Unveiling IoT Activities from Network Traffic Log
We investigate how to unveil the activities of an IoT device using sigMatch in Algorithm 1 as a building block. Note that we can separate the traffic of a specific IoT device from all network traffic using the IoT device’s distinct IP address. For a given IoT device, we first extract its signature set . For each signature , using its corresponding tolerance vector , we can apply sigMatch to construct the corresponding DAG in worst-case time, where is the number of packets in . We can compute all DAGs in worst-case time, where .
For each , there may be zero or more -valid matches of signature . Making use of , we can either confirm that there is no -valid match (when there is no vertex in ) or compute the earliest -valid match , in the sense that is lexicographically smallest, in worst-case time.
Given the network traffic , and the valid matches of signatures in , how do we decide which IoT activity happened first? Through extensive experiments, we found that in normal situations, each network packet corresponding to an earlier IoT activity proceeds every network packet corresponding to a later IoT activity. Therefore the signature that has the earliest match happens first. Once this decision is made, we can delete each packet with a timestamp no later than that of the last packet in the match of the found signature from the network traffic. Repeating the above process, we can unveil the sequence of IoT activities from the given network traffic. We formally describe this process called actExtract in Algorithm 2.
Theorem 2
The worst-case time complexity of Algorithm 2 is , where is the number of signatures, is the maximum number of packets in any of the signatures, and is the number of packets in network traffic log . In normal situations (i.e., each packet for an earlier activity precedes every network packet of a later activity), actExtract correctly outputs a sequence of IoT activities whose sequential execution will generate a network traffic log that may be different from only in the timestamp fields.
Proof. Initially, the DAGs can be computed in time. The earliest match of can be computed in time, . Selecting the signature with the earliest match requires time. This process is repeated for no more than times, hence the time complexity.
Next, we prove the correctness of the algorithm. Assuming that the sequence of IoT device activities that generated the network traffic is . By our normal assumption, each network packet of must happen earlier than every network packet of , for any . Since actExtract uses the earliest match, it will output as the first activity, and all of the packets in the computed match for have timestamps earlier than the timestamp of any packet in other IoT activity , with . Hence, when we delete the packets matched for , we delete all of the packets generated for , but none of the packets generated by with . Therefore actExtract will next output , then , and so on. This proves the correctness of the algorithm.
When we execute the computed sequence of IoT device activities, the network traffic observed may be different from , but only in the timestamp field. The sequence of packets will have increasing timestamps. Ignoring the timestamp field, two sequences of packets will be identical with . Note that we can divide the network traffic log into multiple sublogs where each sublog corresponds to a unique IoT device. We can apply actExtract to each sublog in parallel to unveil the IoT activities for all IoT devices.
6-D Discussions
Our proposed actExtract algorithm can unveil the activity sequence of an IoT device with no ambiguity and guarantee correctness, assuming there is no ongoing attack and the device can only carry out one activity at a time, which is true for most devices. For devices that allow two or more concurrent activities, such as IP cameras, we can modify sigMatch algorithm to record only non-overlapping matches in network traffic for a signature in a DAG. We can then build the DAG for the same device’s signatures independently and output all the identified activities. In case when there is attacking traffic, it is possible that one packet is matched to two different signatures. We can add a variable in sigMatch to record all the signatures that a packet is matched to. If such a conflict happens, our algorithm can report it as an anomaly and raise an alarm.
7 Experimental Evaluations
We evaluate the performance of IoTAthena using two different settings: 1) our own smart home testbed, and 2) a large public IoT network traffic dataset [30]. We first describe these settings in Section 7-A. In Section 7-B, we present experimental results on the sensitivity of IoTAthena’s accuracy on the matching tolerance. In Section 7-C, we present experimental results for homogeneous device activities. In Section 7-D, we present experimental results for mixed device activities, together with a case study.
7-A Experiment Setting
Our smart home testbed has widely-used IoT devices, including multiple models of IP cameras, smart bulbs, smart doorbells, smart locks, and smart plugs. These IoT devices are all ranked as popular by Smart Home DB [34]. Our experiments have identified a total of 44 different device activities by using these 16 devices. The numbers of devices and activities in this study are comparable to existing studies on understanding IoT device activities in smart home network environments [2, 38]. This controlled smart home environment was used to create the “silent” week for collecting, analyzing, and characterizing background network traffic, as discussed in Section 4. For each IoT device activity, we repeatedly generate the activity while collecting the associated network traffic as well as recording the activity logs which are used for establishing the ground truth at the same time. Using the signature extraction technique introduced in Section 5, we were able to extract signatures for most of the device activities of all representative IoT devices except the stream off activity of Amcrest ProHD camera, which does not have the deterministic traffic pattern to form a signature.
In addition to network traffic and activity logs collected from our own smart home testbed, we also evaluated IoTAthena’s performance using a large public IoT network traffic dataset [30], known as the MON(IOT)R dataset. The MON(IOT)R dataset includes raw IP data traffic and the labeled activity logs of IoT devices555We evaluated IoTAthena on the IoT device activities with at least samples in the MON(IOT)R dataset in order to have statistically meaningful results.. Among these devices, of them are also included in our smart home testbed, while the other devices are unique to the dataset. The IoT network traffic and labeled activities in the dataset allow us to evaluate the performance of IoTAthena.
7-B Sensitivity Analysis on the Tolerance Parameter
Our time-sensitive subsequence matching algorithm sigMatch uses the tolerance vector for accommodating inter-packet time intervals’ variations. In our experiment, is set to for , where is the standard deviation of the inter-packet time interval between two consecutive packets and and is a tunable parameter.
The accuracy of IoTAthena depends on the matching tolerance parameter. Intuitively, when the matching tolerance is very small, IoTAthena tends to unveil fewer activities due to the strict checking of inter-packet time intervals, leading to low accuracy. On the other hand, when the matching tolerance is very large, IoTAthena tends to have more false negatives due to the loose checking of inter-packet time intervals, also leading to low accuracy. In order to have a deeper understanding of this dependency, we carried out sensitivity analysis. For each device activity, we repeatedly triggered it times with random delays between two consecutive experiments. We then ran -fold cross validation using the data collected. In each of the rounds, we observe the accuracy of IoTAthena on of the experiments, while using the remaining to generate the signature. Fig. 6 illustrates some representative results.


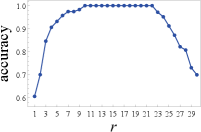

Figs. 6(a)-(d) show the accuracy changes for unveiling the on and off activities of TP-Link Bulb and TP-Link Plug as increases from to , while Figs. 6(e)-(h) show the accuracy dynamics of unveiling August Lock’s app opening, Wifi (un)locking, autolocking, and Bluetooth (un)locking activities. In Figs. 6(a)-(d), we observe that the accuracy of IoTAthena exhibits a non-decreasing trend for the on and off activities of both TP-Link Bulb and TP-Link Plug, when increases from to . These observations are not surprising since the increasing value of leads to a higher tolerance value to allow larger inter-packet time intervals.
However, Figs. 6(e)-(g) contradict such conjectures as increasing to a particular value leads to decreasing accuracy in matching August Lock’s app opening, WiFi (un)locking, and autolocking activities. Our in-depth investigation discovered that the accuracy decrease for the larger values is due to the interference of August Lock’s background traffic noise. The background traffic happens to shares overlapping packets with the signatures of app opening, WiFi (un)locking, and autolocking activities when we allow bigger tolerance of inter-packet intervals. Unlike Figs. 6(e)-(g), the accuracy of unveiling August Lock’s Bluetooth (un)locking activities changes in a non-decreasing fashion in Fig. 6(h) as increases from to . The underlying reason of this distinct observation is the unique traffic patterns of the network traffic collected when triggering August Lock’s Bluetooth (un)locking activities, where no background noise that cannot be filtered out has been observed.
In summary, our sensitivity analysis on the tolerance parameter confirmed the importance and impact of choosing appropriate tolerance values during the IoT device activity extraction process. More importantly, the observations in Fig. 6 highlight the rationale and necessity of our full packet sequences with inter-packet time intervals as the IoT device activity signature and our time-sensitive subsequence matching algorithm for unveiling IoT device activities.
7-C Performance of IoTAthena on Homogeneous Device Activities
Having done the sensitivity analysis, we focused on evaluating IoTAthena’s performance of unveiling homogeneous device activities. We first present experimental results on our smart home testbed. We then present results on the MON(IOT)R dataset [30].
For each IoT device activity, we repeated it times and collected the network traffic on the router in our smart home testbed. We again ran the -fold cross validation. TABLE 2 shows the accuracy (), precision (), and recall () measures of IoTAthena for various activities of the devices in our smart home testbed, with set to , , and , respectively.
| Type | Device Name | Activity | |||||||||
|---|---|---|---|---|---|---|---|---|---|---|---|
| bulb | Philips Hue | on or off | |||||||||
| brightness | |||||||||||
| Sengled SmartLED | on | ||||||||||
| off | |||||||||||
| brightness | |||||||||||
| TP-Link Bulb | on | ||||||||||
| off | 0 | ||||||||||
| color | |||||||||||
| brightness | |||||||||||
| camera | Amcrest ProHD | stream on | |||||||||
| Arlo - Q Indoor | stream on | ||||||||||
| stream off | |||||||||||
| motion detection | |||||||||||
| Arlo Ultra | stream on | ||||||||||
| stream off | |||||||||||
| motion detection | |||||||||||
| Blink XT2 | stream on | ||||||||||
| stream off | |||||||||||
| motion detection | |||||||||||
| Reolink Camera | stream on | ||||||||||
| stream off | |||||||||||
| motion detection | |||||||||||
| doorbell | August Doorbell Cam Pro | stream on | |||||||||
| stream off | |||||||||||
| ringing | |||||||||||
| motion detection | |||||||||||
| Ring VideoDoorbell | stream on | ||||||||||
| stream off | |||||||||||
| ringing | |||||||||||
| motion detection | |||||||||||
| lock | August Lock Pro | app opening | |||||||||
| WiFi (un)locking | |||||||||||
| Bluetooth (un)locking | |||||||||||
| autolocking | |||||||||||
| manual (un)locking | |||||||||||
| Schlage WiFi Deadbolt | WiFi (un)locking | ||||||||||
| autolocking | |||||||||||
| manual (un)locking | |||||||||||
| plug | Amazon Smart Plug | on | |||||||||
| off | |||||||||||
| Gosund WiFi Smart Socket | on or off | ||||||||||
| TP-Link Plug | on | ||||||||||
| off | |||||||||||
| WeMo Plug | on or off | ||||||||||
From TABLE 2, we observe that the performance of IoTAthena depends on . For , IoTAthena achieves a minimum accuracy of , a minimum precision of , and a minimum recall of . When is increased to , the performance of IoTAthena improves, with precision of , accuracy of or better, and recall of or better, across all activities in our experiments. When is further increased to , the performance of IoTAthena drops, with a minimum accuracy of , a minimum precision of , and a minimum recall of . Based on this empirical evidence, we choose as the “optimal” value for the tolerance parameter.
| Device Name | Activity | |||
|---|---|---|---|---|
| Amcrest Camera Wired | watch | |||
| Blink Camera | watch | |||
| Blink Security Hub | watch or photo | |||
| Bulb1 | on or off | |||
| Fire TV | menu | |||
| Google Home Mini | volume or voice | |||
| Insteon Hub | on or off | |||
| Invoke | volume or voice | |||
| Lefun Camera Wired | watch or photo | |||
| LG TV Wired | menu | |||
| Lightify Hub | on or off | |||
| color | ||||
| Luohe Spycam | watch | |||
| Magichome Strip | on | |||
| off | ||||
| Microseven Camera | watch | |||
| Philips Bulb | on or off | |||
| Samsungtv Wired | menu | |||
| Sengled Hub | on or off | |||
| Smartthings Hub | on or off | |||
| T-philips Hub | on or off | |||
| TP Link Bulb | on | |||
| off | ||||
| color | ||||
| dim | ||||
| TP Link Plug | on | |||
| off | ||||
| Wink Hub2 | on | |||
| off | ||||
| Xiaomi Hub | on or off | |||
| Xiaomi Strip | on or off | |||
| Zmodo Doorbell | watch |
We also evaluated the performance of IoTAthena using the MON(IOT)R dataset [30]. Due to the relatively small sample size (between and ), we ran -fold cross validation instead of -fold cross validation. TABLE 3 illustrates the accuracy, precision, and recall measures of running IoTAthena against IoT devices in the MON(IOT)R dataset with set to . We observe that IoTAthena achieve a minimum accuracy of , a minimum precision of , and a minimum recall of .
The prior study [38] also evaluates the algorithm with the same the MON(IOT)R dataset [30]. TABLE VI in [38] reports an average accuracy of 99.12% on 3 IoT device activities for WAN Sniffer, and an average accuracy of 99.06% on 4 IoT device activities for WiFi sniffer. As shown in TABLE 3, our approach achieves an average accuracy of 99.57% on 33 IoT device activities on the same dataset. Therefore, our proposed IoTAthena system is able to generate signatures for more IoT device activities than [38] while achieving slightly better accuracy in identifying the signatures with the same public dataset.
In summary, experimental evaluations with our smart home testbed and the MON(IOT)R dataset demonstrate that IoTAthena can successfully unveil homogeneous IoT device activities from network traffic logs.
7-D Performance of IoTAthena on Mixed Device Activities
A significant benefit of our IoTAthena system lies in the realtime security monitoring of IoT devices in smart homes, which has become an increasingly important research topic. Given the IoT network traffic logs, IoTAthena can accurately unveil the sequence of IoT device activities over time and potentially detect anomalous traffic patterns and behaviors towards IoT devices.
As a case study, we applied IoTAthena to unveil the activities of IoT devices in our smart home during a -hour span. The devices in this case study consist of Arlo Ultra Camera, August Lock, Ring Doorbell, TP-Link Bulb, and TP-Link Plug. Fig. 7 visualizes the time-series activities of these IoT devices discovered by IoTAthena during a -hour time span in our smart home environment.

The two activities highlighted by the light blue box near the left end of Fig. 7 capture two consecutive user-triggered events at around 12:45pm: i) (the homeowner) unlocked the August Lock with app (from outside), indicated by the dark blue disk inside the light blue box, and ii) manually locked the August Lock (after entering home), indicated by the green square inside the light blue box. Similarly, the four activities in highlighted by the red box at around 7:20pm in Fig. 7 reflect four consecutive events: i) (a visitor) pressed the button on the ring doorbell, which generated a push notification to the homeowner’s smartphone; ii) (the homeowner) watched the video streaming feed on the ring doorbell to check the visitor’s identity; iii) (the homeowner) manually unlocked the August Lock to let the visitor in; iv) the August Lock was manually locked (from inside).
To evaluate IoTAthena’s ability in unveiling sequences of mixed IoT device activities, we used IoTAthena to unveil the mixed IoT device activities of all devices in our smart home from the network traffic, in a -hour span, from 12:00pm to 11:59am. Fig. 8 illustrates IoTAthena’s performance by comparing the ground truth activity sequences with the unveiled activity sequences of IoT devices in the smart home testbed, where a blue dot represents a successful match, while a red cross represents a failed match. The actual dates for running different IoT device activity experiments might vary, so the x-axis only denotes the time of the day from 12:00pm to 11:59am. As can be seen from the figure, IoTAthena correctly unveiled all but one of the activities. The only missed activity occurs with the Blink XT2 Camera. Our root cause analysis revealed that IoTAthena missed one streaming activity due to the unseen variation in packet length.

In summary, our experimental evaluations based on a variety of heterogeneous IoT devices demonstrated that IoTAthena can effectively and accurately unveil individual IoT device activities as well as unveil IoT device activity sequences over time. We note that our single smart home environment in the experiments has its own limitation in performing large scale experimental evaluations. One of our future work is to deploy the IoTAthena system in a large number of smart homes to evaluate its performance and overhead.
8 Conclusions and Future Work
This paper introduces IoTAthena to effectively and accurately unveil IoT device activities from network traffic in smart homes. We first recognize and generate activity signatures of IoT device activities consisting of ordered sequences of IP data packets by repeated and controlled experiments. Subsequently, we design two polynomial time algorithms, sigMatch and actExtract. The sigMatch algorithm captures all matches of any given IoT device activity signature from real network traffic logs. The actExtract algorithm unveils the full activity sequences of all IoT devices from the network traffic log. Through experimental evaluations based on a wide range of heterogeneous IoT devices from a real smart home environment and a public IoT dataset, we demonstrated that IoTAthena is able to accurately unveil IoT device activities from raw network traffic logs. We are in the process of designing and implementing a prototype system on commodity home routers to evaluate the real-time feasibility of IoTAthena for unveiling IoT device activities on the fly. Another possible future work is to explore the benefits of IoTAthena in detecting and mitigating security threats towards vulnerable IoT devices.
References
- [1]
- [2] A. Acar, H. Fereidooni, T. Abera, A.-K. Sikder, M. Miettinen, H. Aksu, M. Conti, A.-Z. Sadeghi, and A.-S. Uluagac, “Peek-a-boo: I see your smart home activities, even encrypted!” in Proc. of ACM WiSec, 2020.
- [3] O. Alrawi, C. Lever, M. Antonakakis, and F. Monrose, “SoK: Security evaluation of home-based IoT deployments,” in Proc. of IEEE S&P, 2019.
- [4] M. Antonakakis, T. April, M. Bailey, M. Bernhard, E. Bursztein, J. Cochran, Z. Durumeric, J.-A. Halderman, L. Invernizzi, M. Kallitsis, D. Kumar, C. Lever, Z. Ma, J. Mason, D. Menscher, C. Seaman, N. Sullivan, K. Thomas, and Y. Zhou, “Understanding the Mirai botnet,” in Proc. of USENIX Security, 2017.
- [5] A. Bergroth, H. Hakonen, and T. Raita, “A survey of longest common subsequence algorithms,” in Proc. of IEEE SPIRE, 2000.
- [6] B. Bezawada, M. Bachani, J. Peterson, H. Shirazi, I. Ray, and I. Ray, “Behavioral fingerprinting of IoT devices,” in Proc. of ACM ASHES, 2018.
- [7] T.-H. Cormen, C.-E. Leiserson, R.-L. Rivest, and C. Stein, “Introduction to algorithms,” MIT Press, 2009.
- [8] S. Demetriou, N. Zhang, Y. Lee, X. Wang, C. Gunter, X. Zhou, and M. Grace, “HanGuard: SDN-driven protection of smart home WiFi devices from malicious mobile apps,” in Proc. of ACM WiSec, 2017.
- [9] A. Dhamdhere, D. Clark, A. Gamero-Garrido, M. Luckie, R. Mok, G. Akiwate, K. Gogia, V. Bajpai, A. Snoeren, and K. Claffy, “Inferring persistent interdomain congestion,” in Proc. of ACM SIGCOMM, 2018.
- [10] E. Fernandes, J. Jung, and A. Prakash, “Security analysis of emerging smart home applications,” in Proc. of IEEE S&P, 2016.
- [11] E. Fernandes, A. Rahmati, K. Eykholt, and A. Prakash, “Internet of things security research: A rehash of old ideas or new intellectual challenges?” IEEE Security & Privacy, vol. 15, pp. 79–84, 2017.
- [12] K. Gao, C. Corbett, and R. Beyah, “A passive approach to wireless device fingerprinting,” in Proc. of IEEE/IFIP DSN, 2010.
- [13] T. Gu, Z. Fang, A. Abhishek, H. Fu, P. Hu, and P. Mohapatra, “IoTGaze: IoT security enforcement via wireless context analysis,” in Proc. of IEEE INFOCOM, 2020.
- [14] T. Gu and P. Mohapatra, “BF-IoT: Securing the IoT networks via fingerprinting-based device authentication,” in Proc. of IEEE MASS, 2018.
- [15] S. Herwig, H. Harvey, G. Hughey, R. Roberts, and D. Levin, “Measurement and analysis of Hajime, a peer-to-peer IoT botnet,” in Proc. of NDSS, 2019.
- [16] T. Høiland-Jørgensen, B. Ahlgren, P. Hurtig, and A. Brunstrom, “Measuring latency variation in the Internet,” in Proc. of ACM CoNEX, 2016.
- [17] Y. Huang, W. Wang, H. Wang, T. Jiang, and Q. Zhang, “Authenticating on-body IoT devices: An adversarial learning approach,” IEEE Transactions on Wireless Communications (TWC), vol. 19, pp. 5234 – 5245, 2020.
- [18] H. Jafari, O. Omotere, D. Adesina, H.-H. Wu, and L. Qian, “IoT devices fingerprinting using deep learning,” in Proc. of IEEE MILCOM, 2018.
- [19] Y. Jia, Y. Xiao, J. Yu, X. Cheng, Z. Liang, and Z. Wan., “A novel graph-based mechanism for identifying traffic vulnerabilities in smart home IoT,” in Proc. of IEEE INFOCOM, 2018.
- [20] G. Kambourakis, C. Kolias, and A. Stavrou, “The Mirai botnet and the IoT zombie armies,” in Proc. of IEEE MILCOM, 2017.
- [21] D. Kumar, K. Shen, B. Case, D. Garg, G. Alperovich, D. Kuznetsov, R. Gupta, and Z. Durumeric, “All things considered: An analysis of IoT devices on home networks,” in Proc. of USENIX Security, 2019.
- [22] X. Ma, J. Qu, J. Li, J. Lui, Z. Li, and X. Guan, “Pinpointing hidden IoT devices via spatial-temporal traffic fingerprinting,” in Proc. of IEEE INFOCOM, 2020.
- [23] D. Maier, “The complexity of some problems on subsequences and supersequences,” Journal of the ACM (JACM), vol. 25, pp. 322–336, 1978.
- [24] M. Miettinen, S. Marchal, I. Hafeez, N. Asokan, A.-R. Sadeghi, and S. Tarkoma, “IoT sentinel: Automated device-type identification for security enforcement in IoT,” in Proc. of IEEE ICDCS, 2017.
- [25] P. Morgner, C. Mai, N. Koschate-Fischer, F. Freiling, and Z. Benenson, “Security update labels: Establishing economic incentives for security patching of IoT consumer products,” in Proc. of IEEE S&P, 2020.
- [26] P. Morgner, S. Mattejat, Z. Benenson, C. Muller, and F. Armknecht, “Insecure to the touch: Attacking ZigBee 3.0 via touchlink commissioning,” in Proc. of ACM WiSec, 2017.
- [27] A. Mosenia and M. Jha, “A comprehensive study of security of internet-of-things,” IEEE Transactions on Emerging Topics in Computing (TETC), vol. 5, pp. 586 – 602, 2016.
- [28] T. J. OConnor, R. Mohamed, M. Miettinen, W. Enck, B. Reaves, and A.-R. Sadeghi, “HomeSnitch: behavior transparency and control for smart home IoT devices,” in Proc. of ACM WiSec, 2019.
- [29] V. Paxson and M. Allman, “RFC2988: Computing TCP’s retransmission timer,” Internet Engineering Task Force (IETF) Request for Comments, November, 2000.
- [30] J. Ren, D.-J. Dubois, D. Choffnes, A.-M. Mandalari, R. Kolcun, and H. Haddadi, “Information exposure from consumer IoT devices: A multidimensional, network-informed measurement approach,” in ACM IMC’2019.
- [31] E. Ronen, C. O’Flynn, A. Shamir, and A.-O. Weingarten, “IoT goes nuclear: creating a ZigBee chain reaction,” in Proc. of IEEE S&P, 2017.
- [32] E. Ronen and A. Shamir, “Extended functionality attacks on IoT devices: The case of smart lights,” in Proc. of IEEE EuroS&P, 2016.
- [33] M. Ryan, “Bluetooth smart: The good, the bad, the ugly, and the fix,” https://lacklustre.net/bluetooth/bluetooth_smart_good_bad_ugly_fix-mikeryan-blackhat_2013.pdf, 2013.
- [34] SmartHomeDB, “Smart home DB - the smart home database,” https://www.smarthomedb.com/.
- [35] S. Siby, R. Maiti, and N. Tippenhauer, “IoTScanner: Detecting privacy threats in IoT neighborhoods,” in Proc. of ACM IoTPTS, 2017.
- [36] A. Sivanathan, H.-H. Gharakheili, F. Loi, A. Radford, C. Wijenayake, A. Vishwanath, and V. Sivaraman, “Classifying IoT devices in smart environments using network traffic characteristics,” IEEE Transactions on Mobile Computing (TMC), vol. 18, pp. 1745–1759, 2018.
- [37] V. Sivaraman, D. Chan, D. Earl, and R. Boreli, “Smart-phones attacking smart-homes,” in Proc. of ACM WiSec, 2016.
- [38] R. Trimananda, J. Varmarken, A. Markopoulou, and B. Demsky, “PingPong: Packet-level signatures for smart home device events,” in Proc. of NDSS, 2019.
- [39] M. Vlachos, G. Kollios, and D. Gunopulos, “Discovering similar multidimensional trajectories,” in Proc. of IEEE ICDE, 2002.
- [40] Y. Wan, K. Xu, F. Wang, and G. Xue “Characterizing and mining traffic patterns of IoT devices in edge networks,” IEEE Transactions on Network Science and Engineering (TNSE), vol. 8, pp. 89 – 101, 2020.
- [41] Y. Wan, K. Xu, G. Xue, and F. Wang, “IoTArgos: A multi-layer security monitoring system for internet-of-things in smart homes,” in Proc. of IEEE INFOCOM, 2020.
- [42] K. Xu, Y. Wan, G. Xue, and F. Wang, “Multidimensional behavioral profiling of internet-of-things in edge networks,” in Proc. of IEEE/ACM IWQoS, 2019.
- [43] L. Yu, B. Luo, J. Ma, Z. Zhou, and Q. Liu, “You are what you broadcast: Identification of mobile and IoT devices from (public) WiFi,” in Proc. of USENIX Security, 2020.
- [44] S. Zhang, W. Wang, S. Tang, S. Jin, and T. Jiang, “Robot-assisted backscatter localization for IoT applications,” IEEE Transactions on Wireless Communications (TWC), vol. 19, pp. 5807 – 5818, 2020.
- [45] W. Zhang, Y. Meng, Y. Liu, X. Zhang, Y. Zhang, and H. Zhu, “HoMonit: Monitoring smart home apps from encrypted traffic,” in Proc. of ACM CCS, 2018.
- [46] H. Zhu, Y. Li, R. Li, J. Li, Z.-H. You, and H. Song, “Sedmdroid: An enhanced stacking ensemble of deep learning framework for Android malware detection,” IEEE Transactions on Network Science and Engineering (TNSE), May 2020. URL https://ieeexplore.ieee.org/document/9099045/.
- [47] T. Zillner and S. Strobl, “ZigBee exploited: The good, the bad and the ugly,” in Proc. of the DeepSec Conferences In Depth Security, 2015.
- [48] H. Zou, M. Jin, H. Jiang, L. Xie, and C.-J. Spanos, “WinIPS: WiFi-based non-intrusive indoor positioning system with online radio map construction and adaptation,” IEEE Transactions on Wireless Communications (TWC), vol. 16, pp. 8118 – 8130, 2017.