Ionized and atomic interstellar medium in the quasar SDSS J2310+1855
Abstract
Observing the interstellar medium (ISM) in quasar host galaxies is essential for understanding the coevolution between the supermassive black holes and their hosts. To probe the gas physical conditions and search for imprints of active galactic nuclei (AGN) on the ISM, we report ALMA observations of the [N II]122μm and [O I]146μm lines and the underlying continuum from the quasar SDSS J231038.88+185519.7. Together with previous [C II]158μm and [O III]88μm observations, we use the ratios of these fine-structure lines to probe the ISM properties. Similar to other high- systems, this object exhibits a [C II]158μm/[O I]146μm ratio comparable to the lowest values found in local (Ultra)luminous infrared galaxies, suggesting a “warmer” and “denser” gas component compared to typical local systems. The [O III]88μm/[O I]146μm ratio is lower than that of other local and high- systems, indicating a smaller ionized gas fraction in this quasar. The [O III]88μm/[N II]122μm ratio is comparable to that of local systems, and suggests a metallicity of =1.52.1. Based on the [N II]122μm detection, we estimate that of the [C II]158μm emission is associated with ionized gas. The [N II]122μm line shows a “flux deficit” comparable to local systems. The [O I]146μm line, with a [O I]146μm/FIR ratio than expected from the local relation, indicates no [O I]146μm deficit. The low [C II]158μm/[O I]146μm ratio, together with the high [O I]146μm/FIR ratio in J2310+1855, reveals that the warm and dense gas is likely a result of AGN heating of the ISM.
1 Introduction
Observations of the interstellar medium (ISM) in the host galaxies of high- quasars reveal key aspects in the processes of galaxy formation and evolution as well as the growth of supermassive black holes (SMBHs). A sample of optically luminous quasars was discovered at , which are hosting SMBHs with masses up to and accreting close to the Eddington limit (e.g., Jiang et al. 2007; Wu et al. 2015; Shen et al. 2019). Some of these objects are also detected in bright dust continuum and line emission at submillimeter/millimeter wavelengths, suggesting they are embedded in gas-rich host galaxies with extremely high star formation rates, e.g., (e.g., wang11; Wang et al. 2013, 2016, 2019a; Carilli & Walter 2013; Shao et al. 2017, 2019; Venemans et al. 2017a, b; Decarli et al. 2018; Li et al. 2020). These millimeter bright quasars are among the most extreme systems in the early universe and serve as excellent candidates to study the coevolution of the SMBHs and their host galaxies at the earliest evolutionary stages. During the past few decades, the most sensitive submillimeter to millimeter wavelength interferometers, e.g., ALMA and NOEMA, have demonstrated their extreme power in detecting the main coolants in photo-dissociation regions (PDRs) from quasar host galaxies at , e.g., the [O I]146μm and [C II]158μm lines from the neutral ISM (e.g., Wang et al. 2013, 2016, 2019a; Shao et al. 2017; Venemans et al. 2017a, b; Decarli et al. 2018; Novak et al. 2019; Yang et al. 2019), the CO and water () lines from the molecular ISM (e.g., Riechers et al. 2009; Gallerani et al. 2014; Shao et al. 2019; Wang et al. 2019b; Yang et al. 2019; Li et al. 2020), and the [O III]88μm and [N II]122μm lines from the ionized ISM (e.g., Walter et al. 2018; Hashimoto et al. 2019; Novak et al. 2019). These far-infrared (FIR) fine-structure (FS) lines, together with the molecular lines, serve as diagnostics of the physical and chemical conditions (e.g., the temperature, density, radiation field strength, and metallicity) of the ISM in different phases, and allow us to discriminate between different gas-heating mechanisms (e.g., ultraviolet photons and X-rays in PDRs and X-ray dominated regions (XDRs), respectively, cosmic rays, and shocks).
The [C II]158μm FS line, which is typically the brightest FIR emission line and the main coolant of the ISM, has long been the workhorse to probe the neutral gas content in quasars (e.g., Wang et al. 2013, 2016, 2019a; Shao et al. 2017; Venemans et al. 2017a, b; Decarli et al. 2018). With an ionization potential (11.26 eV) lower than that of hydrogen, the [C II]158μm emission can coexist in both the ionized and neutral gas. Recent studies of local (U)LIRGs, active galactic nuclei (AGNs), and high-redshift quasars reveal that most of the [C II]158μm emission originates in the neutral gas phase (; e.g., Herrera-Camus et al. 2016, 2018a; Díaz-Santos et al. 2017; Novak et al. 2019). The molecular CO and water () lines, being usually over an order of magnitude fainter than the [C II]158μm line, represent the brightest molecular ISM emissions in quasars. Recently, a handful of other FS lines from the ionized and atomic ISM, e.g., [O I]146μm, [O III]88μm, and [N II]122μm tracing the atomic and ionized ISM were detected in the quasar host galaxies and star-forming galaxies (e.g., Walter et al. 2018; Hashimoto et al. 2019; Novak et al. 2019; Yang et al. 2019). In particular, the recent tentative detection of the [O I]63μm line with a luminosity four times that of the [C II]158μm line in a lensed dusty star forming galaxy G09.83808, and the [O I]146μm detected in the quasar J0439+1634 with a [O I]146μm/[C II]158μm ratio of 0.3, make the [O I]63μm and [O I]146μm lines excellent tracers of the neutral gas at in addition to [C II]158μm (Yang et al. 2019; Rybak et al. 2020). Combinations of different FS lines provide rich information about the multiphase ISM, e.g., the [N II]122μm/[N II]205μm ratio as a probe of ionized gas density (e.g., Oberst et al. 2006, 2011; Novak et al. 2019), the [C II]158μm/[N II]205μm ratio as an indicator of the [C II]158μm origin (e.g., Pavesi et al. 2016, 2019; Herrera-Camus et al. 2018b; De Breuck et al. 2019), the [C II]158μm/[O I]63μm (or [O I]146μm) ratio as a tracer of neutral gas density and temperature (e.g., Oberst et al. 2006, 2011; Díaz-Santos et al. 2017; Herrera-Camus et al. 2018a), and the [N II]122μm/[O III]88μm ratio as a diagnostic of the ionization parameter and metallicity (e.g., Nagao et al. 2011; Pereira-Santaella et al. 2017; Rigopoulou et al. 2018). In addition, the FS lines also serve as tracers of the star formation rate (SFR) and infrared luminosity in (ultra)luminous infrared galaxies ((U)LIRGs), and studying the ratio of FS line and FIR luminosity addresses the origin of the FIR line deficit, i.e., a decrease in the line to FIR luminosity ratio for many of the most luminous objects, e.g., local (U)LIRGs and AGNs (e.g., Farrah et al. 2013; De Looze et al. 2014; Herrera-Camus et al. 2018a).
In this work, we present an ISM study of the quasar SDSS J231038.88+185519.7 (hereafter J2310+1855). Being one of the FIR brightest quasars at , J2310+1855 has been widely studied in lines probing different phases of the ISM, e.g., [C II]158μm emission from the neutral gas; the CO, , and lines from the molecular material; and the [O III]88μm line from the ionized gas (Wang et al. 2013; Hashimoto et al. 2019; Shao et al. 2019; Li et al. 2020). In a previous paper (Li et al., 2020), we report a study of the CO spectral line energy distribution (SLED) of this object. We detected highly excited molecular gas with complex excitation mechanisms in which heating from the powerful quasar could be involved. In this work, we report new ALMA observations of [N II]122μm and [O I]146μm FS lines in J2310+1855, to further probe the impact of the AGN and as well as the star formation from its host galaxy, on the multiphase ISM of this quasar. We adopt a standard CDM cosmology with and . With the adopted cosmological parameters, 1′′ corresponds to 5.7 kpc at the redshift of J2310+1855 and the luminosity distance to the quasar is 57.8 Gpc.
2 Observations
We observed the [O I] (= 2060.0690 GHz) and [N II] (= 2459.3801 GHz) FS lines from the quasar J2310+1855 at with ALMA. The observations were performed as part of Cycle 3 program ID 2015.1.01265.S. The [O I]146μm line was observed on 2016 April 14 and November 22 with a total observing time of 73.4 minutes on source. The array configuration was C36-3, where the number of antennas used was 36–38 and the baseline lengths were between 15 and 539 meters. We set one of the four 1.875 GHz spectral windows centered on the redshifted [O I]146μm line at 294.1653 GHz, and the remaining three spectral windows observed the continuum emission. The bandpass and flux calibrator was J2253+1608. J2300+1655 was used for phase calibration. On 2016 April 9 and June 16, we observed the [N II]122μm line in the C36-2 configuration with a total observing time of 67.8 minutes on source. The number of antennas was 38–44 and the baseline lengths were between 15 and 377 m. We tuned one 1.875 GHz width spectral window centered at the redshifted [N II]122μm frequency, 351.1845 GHz, to observe the line, and the other three 1.875 GHz width spectral windows to observe the continuum emission. The bandpass and phase calibrator was J2253+1608, and the flux calibrator was Pallas.
We reduced the ALMA data with the Common Astronomy Software Applications (CASA) software package version 4.7.0 (McMullin et al., 2007), following the standard ALMA pipeline. We imaged the data using the CLEAN task in CASA with natural weighting. The synthesized beam sizes were and at the observing frequency of the [N II]122μm and [O I]146μm lines, respectively. We generated the datacube for spectral line imaging by executing the UVCONTSUB task in CASA, through subtracting a first-order polynomial continuum from the original datacube. We finally binned the [O I]146μm datacube to 16 MHz (16 km ) wide channels, resulting in a rms of 0.20 per binned channel. As for the [N II]122μm datacube, we binned them to 94 MHz (80 km ) wide channels, yielding a rms of 0.23 per binned channel. By averaging the data over 281.2 (336.2) and 295.2 (352.2) GHz in the regions free of line emission, we find a continuum sensitivity of 25 (49) at 289.2 (344.2) GHz from our observations.
3 Results
Both the [O I]146μm and [N II]122μm lines and the underlying continuum are detected in our ALMA observations. The spectra of the [O I]146μm and [N II]122μm lines, which are presented in Figure 1 together with the [C II]158μm spectrum from Wang et al. (2013) and that of the [O III]88μm emission line from Hashimoto et al. (2019), have been extracted within a circular aperture with a radius of centered at the peak spaxel. For the [O I]146μm and [N II]122μm lines, we measure the flux and width by fitting a single Gaussian profile to the spectrum while the line center is fixed to that of the [C II]158μm redshift (Wang et al., 2013). The measured fluxes are 0.72 0.20 and 1.25 0.08 Jy for the [N II]122μm and the [O I]146μm lines 111We note that the line flux measured from clipping all the line emitting channels is consistent with that from a single Gaussian profile fitting. Because of the absorption-like feature in the spectrum, fitting a Gaussian profile to the spectrum could overestimate the uncertainties., respectively. The resulting line widths of 328 58 and 376 16 km s-1 in FWHM for [N II]122μm and [O I]146μm are consistent with those measured for [C II]158μm (393 21 km s-1, Wang et al. 2013), [O III]88μm (333 72 km s-1, Hashimoto et al. 2019), and the CO lines ( 400 km s-1, Li et al. 2020). The measured line luminosity, flux, source size, and line width are listed in Table 1. The spectrum of [O I]146μm shows a clear absorption-like feature signal-to-noise ratio (S/N ) in the blue part close to the line center frequency. Interestingly, this feature is also seen in the previous [C II]158μm data (Wang et al., 2013). The [N II]122μm spectrum suggests a tentative dip at a similar velocity to that of the [C II]158μm and [O I]146μm emission lines, while the low-S/N spectrum of the [O III]88μm line reveals no clear sign of an absorption-like feature. Future observations, possibly at higher sensitivity are required to confirm whether this feature exists in the ionized gas tracers, e.g., [N II]122μm and [O III]88μm. However, this feature is not observed in the molecular CO lines, possibly resulting from the different gas components that the CO and FIR FS lines trace (Shao et al. 2019; Li et al. 2020).
Figure 2 shows the continuum, and the spectral line intensity, velocity, and velocity dispersion maps of the [O I]146μm and [N II]122μm lines. The maps of the [C II]158μm and [O III]88μm lines are shown at the bottom for comparison. The peaks of all the continuum and spectral lines are consistent with the quasar’s HST position (Shao et al. 2020 in preparation). We measured the source size by fitting a 2D Gaussian component to the intensity map. The [O I]146μm line is spatially resolved with a source size of ( ) ( ) deconvolved from the beam. The [N II]122μm line is marginally resolved with a source size of ( ) ( ). The measured source sizes from the [O I]146μm and [N II]122μm lines are comparable to those of the [C II]158μm line of ( ) ( ) and the [O III]88μm line of ( ) ( ), and slightly larger than those observed in high CO lines of ( ) ( ) (Li et al., 2020). The velocity field of the [O I]146μm line shows a velocity gradient from the northeast to the southwest that is similar to that of the [C II]158μm line. Considering the beam-smearing effect, the velocity gradient of [O I]146μm averaged in the outermost region of 32 is consistent with that of the [C II]158μm line of 61 . The underlying continuum emissions are all detected at very high S/Ns () (Shao et al., 2019). The deconvolved source sizes for the continuum are all slightly smaller than those values determined for the emission lines (Tables 1 and 2).
4 Discussion
4.1 Properties of J2310+1855
Our ALMA detection of the [O I]146μm and [N II]122μm emission lines together with previous observations of the [O III]88μm and [C II]158μm lines in J2310+1855 allows us to constrain the atomic and ionized gas masses as well as the SFR. We follow the method in Ferkinhoff et al. (2011) to estimate the ionized gas mass from the [N II]122μm and [O III]88μm emission lines. Given the first and second nitrogen ionization energies of 14.5 and 29.6 eV, it is likely that in H II regions, nitrogen is mostly singly ionized and traces much of the fully ionized hydrogen, and its abundance relative to H () can be estimated from the nitrogen relative abundance (N/H) through N/H. For a local thermal equilibrium (LTE) level distribution, the line emission thus provides a lower limit on the ionized gas mass associated with the emission. The minimum ionized gas mass traced by singly ionized nitrogen is:
| (1) |
where is the atomic hydrogen mass, and are the statistical weight and Einstein coefficient of the upper energy level, (at the high-temperature limit) is the partition function, is the Plank constant, and is the line frequency. Adopting a solar nitrogen abundance from Asplund et al. (2009), we derive a minimum ionized gas mass of . The ionized gas mass can also be derived from the [O III]88μm line by replacing the [N II]122μm related terms with those of the [O III]88μm line in Eq.1. The parameters for [O III]88μm are , , (at the high-temperature limit), and (solar abundance; Asplund et al. 2009). Adopting an [O III]88μm luminosity of (Hashimoto et al., 2019), we estimate a minimum ionized gas mass of .
In addition, we estimate the neutral gas mass from the [C II]158μm and [O I]146μm lines. In the optically thin regime, the singly ionized carbon mass (Weiß et al. 2005; Venemans et al. 2017b) is
| (2) |
where is the C II partition function, and is the excitation temperature. Assuming LTE where , and adopting a gas temperature of derived from the CO spectral line energy distribution (SLED) (Li et al., 2020), we estimate the singly ionized carbon mass of . With a (solar abundance; Asplund et al. 2009), we constrain the minimum atomic gas mass of 222If we adopted a temperature of , the estimated gas mass would be times of the value presented here.. Following a similar formula to [C II]158μm, the atomic oxygen mass can be calculated by substituting the parameters with those of the [O I]146μm line in Eq. 1 of Weiß et al. (2005):
| (3) | |||
| (4) |
where is the partition function of oxygen, is the Einstein coefficient, is the energy above the ground state, and is the conversion factor between and . We derive an ionized oxygen mass of (for ), which leads to adopting 333If we adopted a temperature of , the estimated gas mass would be times of the value presented here. (solar abundance; Asplund et al. 2009). The estimated neutral gas masses from the [C II]158μm and [O I]146μm lines are comparable to the molecular gas mass derived from the CO line of (Shao et al., 2019), and about an order of magnitude larger than the ionized gas mass derived from the [N II]122μm and [O III]88μm lines.
The FIR FS lines are tracers of the SFR (e.g., Farrah et al. 2013; De Looze et al. 2014). We estimate the SFR based on the FS emission lines using Eq. 6 of Farrah et al. (2013):
The SFRs estimated from the [C II]158μm, [O I]146μm, [N II]122μm, and [O III]88μm lines are 1524, 11917, 2208, and 1058 , respectively. We note that the [O I]146μm line suggests an extremely high SFR. The error bars of the parameters in the above relations are large, which result in large uncertainties in the SFR estimation. 444The statistical uncertainties are 2.6, 2.0, 1.3, and 1.8 dex for the [C II]158μm, [O I]146μm, [N II]122μm, and [O III]88μm lines estimated from the relation (Farrah et al., 2013). Moreover, the [O I]146μm line flux may not give a reliable estimate of the SFR, as (1) the high ratio (see discussions in Section 4.2) suggests extra gas heating by the AGN in addition to the UV photons from young massive stars, and (2) the relation in Farrah et al. (2013) is based on samples with [O I]146μm luminosity less than , which may not be valid when extrapolated to higher [O I]146μm luminosity for SFR calculation. The SFR derived from the infrared dust () ranges from 1300 to 3600 , depending on the different model parameters used in the dust continuum SED fitting (Shao et al., 2019). The SFRs traced by both the dust continuum and the [C II]158μm, [N II]122μm and [O III]88μm FIR FS lines are consistent, while the [O I]146μm line suggests a higher SFR, although all the derived values are consistent within statistical uncertainties. The derived gas masses and SFRs are listed in Table 1.
4.2 Line-to-FIR luminosity ratios
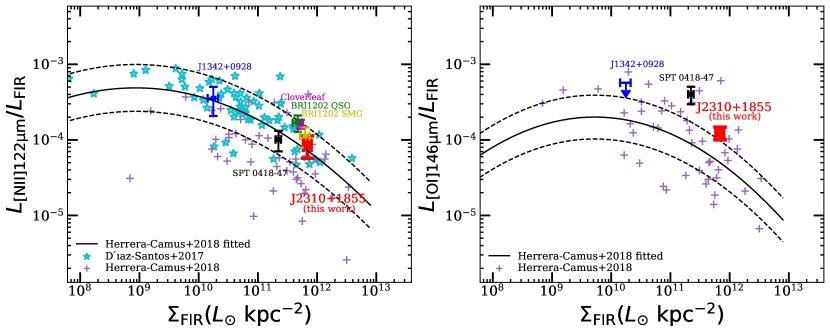
We compare the [N II]122μm and [O I]146μm emission in J2310+1855 with values found for local and high- systems by studying the line-to-FIR ratio as a function of FIR luminosity (), and as a function of FIR surface brightness (). The comparison samples include samples of local dwarf galaxies, (U)LIRGs, and AGNs (Farrah et al. 2013; Cormier et al. 2015; Spinoglio et al. 2015; Rosenberg et al. 2015; Díaz-Santos et al. 2017; Herrera-Camus et al. 2018a). We also include high- objects with available [O III]88μm and [N II]122μm detections for comparison: the quasar J1342+0928 (Novak et al., 2019), the quasar J0439+1634 at (Yang et al., 2019), the Cloverleaf, a lensed quasar (Ferkinhoff et al., 2015), the lensed dusty star-forming galaxy SPT 0418-47 (De Breuck et al., 2019), and the quasar BRI1202 QSO and its companion submillimeter galaxy (SMG) BRI1202 SMG (Lee et al., 2019). Detailed descriptions about the comparison samples are provided in the caption of Figure 3.
We show the results in Figure 3. For the [N II]122μm line, all the local (U)LIRGs and AGNs show decreasing ratios with increasing for . We adopt the J2310+1855 FIR luminosity of from Shao et al. (2019). The quasar J2310+1855, together with other high-z objects (e.g., the Cloverleaf, BRI1202 SMG and BRI1202 QSO) show a slightly higher ratio than the local (U)LIRG and AGN samples for , while the high-z objects with (e.g., J1342+0928 and SPT 0418-47), follow the trend of the local (U)LIRG and AGN samples. Recent studies find that the “line deficit” is more closely correlated with than in samples of local (U)LIRGs and AGNs (e.g., Lutz et al. 2016; Díaz-Santos et al. 2017; Herrera-Camus et al. 2018a; Herrera-Camus et al. 2018b). For all the local comparison samples, FIR source sizes are only available in Díaz-Santos et al. (2017) and Herrera-Camus et al. (2018a). We compare the line-to-FIR ratio of the quasar with the above two samples of local (U)LIRGs and AGNs as a function of , and the results are shown in Figure 3. For the high- objects, we calculate following the definition of Herrera-Camus et al. (2018a) and Díaz-Santos et al. (2017). All of the high-z objects including J2310+1855, lie within the range of (U)LIRGs and AGNs. This suggest that the ratio measured from the nuclear region ( kpc) of J2310+1855 is comparable to that of local (U)LIRGs, AGNs and other high- systems with a similar FIR surface brightness.
As for the [O I]146μm line, all of the local (U)LIRGs and AGNs reveal decreasing ratios with increasing for (Figure 3). J2310+1855, together with J1342+0928 and SPT 0418-47, indicate higher ratios compared to local samples at similar . As for J0439+1634, the uncertainty in the magnification factor makes it hard to conclude if values are consistent with the local relation (for ) or if it has a comparable ratio to J2310+1855 at similar (for , Yang et al. 2019). As for the case of , similar to other high- quasars and galaxies, the [O I]146μm line flux measured in the central kpc region of J2310+1855 exceeds the range of local systems and exhibits over two times the values in local (U)LIRGs and AGNs measured from the galaxy scale, suggesting no sign of [O I]146μm deficit. The [O I]146μm emission traces the warm and dense neutral gas (with temperature and critical density ). The luminous [O I]146μm detection of J2310+1855 suggests warm and dense gas in the nuclear region, which is possibly heated by the photons contributed by the AGN in addition to the UV photons from young massive stars. This is in agreement with spatially resolved observations of local AGNs, with higher [O I]146μm fluxes detected in the central regions (which suggest warm and dense gas) compared to the mean values found in the outer star-forming disk (Herrera-Camus et al., 2018b). In addition, we compare the [C II]158μm and [O III]88μm lines of J2310+1855 with the versus relation observed in local galaxies, (U)LIRGs and AGNs (Herrera-Camus et al., 2018a). The results suggest that the [C II]158μm, [N II]122μm, and [O III]88μm lines exhibit a similar deficit as in local systems (Wang et al. (2013); Hashimoto et al. (2019)). The [O I]146μm line is over two times brighter than in local (U)LIRGs and AGNs at its , suggesting that the absence of an [O I]146μm deficit could be caused by a warm and dense neutral gas content, which is possibly heated by the photons from the AGN in addition to the UV photons from young massive stars.
4.3 [C II]158μm from the ionized gas
The [C II]158μm line traces both the neutral and the ionized ISM. The contribution to the [C II]158μm emission from the HII regions can be constrained if tracers purely from ionized gas phase are observed. The [N II]122μm and [N II]205μm lines, as examples, are widely used to probe the [C II]158μm emission from the ionized gas phase in the local universe to the highest redshift (; e.g., Oberst et al. 2006, 2011; Herrera-Camus et al. 2016, 2018a; Díaz-Santos et al. 2017; Novak et al. 2019). The [N II]122μm and [N II]205μm lines are from the same ionization state of nitrogen, thus the ratio between these two lines has a negligible dependence on the radiation field and metallicity. The difference in the critical densities between the [N II]122μm (310 ) and [N II]205μm (48 ) lines enables the [N II]122μm/[N II]205μm ratio to trace ionized gas density. Once the gas density is determined, the [C II]158μm/ [N II]205μm ratio and the fraction of [C II]158μm emission from the ionized gas phase will be constrained by comparing the observational data with radiative transfer models.
With only the [N II]122μm line observed in J2310+1855, we estimate its [N II]205μm luminosity from (1) the relation between the ratio and the FIR color () in local (U)LIRGs (Eq. 1 from Zhao et al. 2016), and (2) the relation between the ratio and the FIR color () in local (U)LIRGs (Eq. 5 from Lu et al. 2015). Adopting a dust temperature of 40 K and an emissivity index from Shao et al. (2019), we estimate an ratio of 2.23 and an ratio of 0.92. The two methods give comparable estimated [N II]205μm luminosities, with derived from the infrared luminosity (method 1), and based on the [C II]158μm luminosity 555The estimated [N II]122μm/[C II]158μm ratio in J2310+1855 of 1/18 is consistent with values found for other high-z quasars, e.g., BRI 1335–0417 at z = 4.41 and BRI 1202–0725 at z = 4.70 (Lu et al., 2017, 2018), as well as other high-z galaxies, e.g., ID 141 at z=4.24 (Cheng et al., 2020). (method 2). Figure 4 (a) shows the [C II]158μm/ [N II]205μm and [N II]122μm/ [N II]205μm ratios in the H II region predicted by the radiative transfer code Cloudy (Ferland et al., 2017). Comparing the estimated [N II]122μm/ [N II]205μm ratio 666The [N II]205μm luminosity is estimated from the relation of local (U)LIRGs (PDRs). In AGNs, the XDRs may contribute significantly to the [N II]122μm emission, which should be subtracted when using the [N II]122μm/ [N II]205μm ratio as a density probe. In the case of J2310+1855, the observed [N II]122μm/IR ratio is comparable to that found for local (U)LIRGs and AGNs, which disfavors a significant contribution of the [N II]122μm emission from XDRs. Accordingly the estimated [N II]122μm/[N II]205μm ratio here traces the ionized gas density. with the model, we estimate that the ionized gas density is 45 in J2310+1855. We emphasis that if we adopt a hotter dust temperature than those suggested by Wang et al. (2019b), the resulting estimated [N II]205μm luminosity will be lower. Accordingly, we consider the derived ionized gas density as a lower limit. The ionized gas density 45 of J2310+1855 is consistent with that found in local (U)LIRGs and AGNs (10 200 from Herrera-Camus et al. 2018a; a median of 46 from Díaz-Santos et al. 2017), but lower than that in the quasar J1342+0928 of 180 . With the estimated ionized gas density of 45 , we derive an ionized gas contribution of 17 to the [C II]158μm line in J2310+1855. This is in agreement with the values derived from local (U)LIRGs and AGNs (Díaz-Santos et al. 2017; Herrera-Camus et al. 2018a), and the z= 7.54 quasar J1342+0928.
4.4 Gas-phase Metallicity
The [O III]88μm and [N II]122μm lines have similar critical densities but different ionization potentials (, E = 35.1 eV for [O III]88μm, and , E = 14.5 eV for [N II]122μm). Thus, the flux ratio between these two lines could be used to trace the ionization parameters and metallicity. Utilizing the radiative transfer model Cloudy, Pereira-Santaella et al. (2017) and Rigopoulou et al. (2018) find that once the ionization parameter is determined, the ratio between the [O III]88μm and [N II]122μm line can be used as a gas-phase metallicity indicator in star-forming galaxies. The detection of both lines in J2310+1855 allows us therefore to constrain the ISM metallicity. However, several issues are noted before applying this method to quasars: (1) these models consider the galaxy stellar emission as the only radiation field. Pereira-Santaella et al. (2017) predict that in the presence of an AGN, the [O III]88μm emission is barely affected but the [N II]122μm line may have a significant contribution from XDRs (up to ) depending on the AGN power-law index; (2) the [O III]88μm/[N II]122μm ratio also has strong dependence on the ionization parameter () of the radiation field. Rigopoulou et al. (2018) proposed using the ratio of underlying continuum luminosity measured at the wavelengths of the [O III]88μm and [N II]122μm lines () for the ionization parameter estimation. However, it should be noted that the observed continuum ratio does not reliably probe the ionization parameter of the galaxy stellar radiation field for systems with powerful AGNs, and (3) the strengths of the [O III]88μm and [N II]122μm lines can be affected by the dust opacity effect. The local ULIRG Arp 220, as an example, was detected in absorption for the [O I]63μm and [N II]122μm FS lines (Rangwala et al. 2011; González-Alfonso et al. 2012). Optically thick dust for has also been observed in high-z SMGs (Riechers et al., 2013). It is also possible that the dust in J2310+1855 is optically thick for . However, current dust continuum observations are insufficient to constrain the dust opacity, as well as to correct for the extinction effect for the FS lines in J2310+1855.
Following the method in Rigopoulou et al. (2018), we first estimate the ionization parameter of the galaxy stellar radiation field from the continuum ratio. To exclude continuum emission contributed by the quasar, we use the decomposed galaxy dust emission with a dust temperature and emissivity index (Shao et al., 2019) to estimate the continuum ratio. This leads to a continuum ratio of 1.4 and ionization parameter for typical H II region density of (Figure 4, Rigopoulou et al. 2018). From the grid presented in Table A1 of Pereira-Santaella et al. (2017), the observed [O III]88μm/[N II]122μm ratio of 2.8 in J2310+1855 corresponds to a metallicity of =1.52.1 777We note that if the AGN contributes significantly to the observed [N II]122μm flux, the estimated metallicity will be lower. For J2310+1855, the comparable ratio with (U)LIRGs suggests no clear sign of significant XDR contribution to the [N II]122μm line. relative to solar metallicity for the estimated . The metallicity is consistent with that of other high-redshift quasars and galaxies (=0.72.0 for J1342+0928, Novak et al. 2019; =0.31.3 for SPT 0418-47, De Breuck et al. 2019).
4.5 Diagnostics of the neutral and ionized ISM
Combinations of different FIR FS emission lines provide a wealth of information about the ISM physical and chemical conditions, e.g., temperature, density, ionization parameter, metallicity, and volume filling factor ratio between different gas phases. J2310+1855 has been detected in the [C II]158μm, [O I]146μm, [N II]122μm, and [O III]88μm FS lines, making it possible to compare its physical conditions of the neutral and ionized gas with that of local and high-redshift systems. The comparison samples are local dwarf galaxies, (U)LIRGs, and AGNs (Farrah et al. 2013; Cormier et al. 2015; Spinoglio et al. 2015; Fernández-Ontiveros et al. 2016; Herrera-Camus et al. 2018a), and the high- systems with available detections, including the quasars J1342+0928 and J0439+1634, as well as the lensed galaxy SPT 0418-47.
The majority of the [C II]158μm emission is originating in the neutral gas phase. The [O I]146μm line comes purely from the neutral gas phase and requires higher temperature and higher density to be excited compared to the [C II]158μm line (, for [O I]146μm and , for [C II]158μm). Thus the [C II]158μm/[O I]146μm ratio depends on both temperature and atomic gas density. The [N II]122μm and [O III]88μm lines trace the ionized gas phase, and the [O III]88μm/[N II]122μm ratio is dependent on metallicity and ionization parameter (Section 4.4). Figure 4(b) shows the vs diagnostic diagram. The ratio is found to be lower in the high-temperature and high-density regime (Díaz-Santos et al. 2017; Herrera-Camus et al. 2018a). The AGN samples display a wide spread in the ratio, while the (U)LIRGs and dwarf galaxies show less scatter with a median value of for the (U)LIRGs and for the dwarf galaxies. The lowest values are only found in AGNs, which indicate warm and dense gas components possibly heated by the AGNs (e.g., Herrera-Camus et al. 2018a). J2310+1855 exhibits a ratio of 6.5, which is among the lowest values found in local AGNs and smaller than local (U)LIRGs and dwarf galaxies. Similar ratios are found in other high- systems (J1342+0928 and SPT 0418-47 on Figure 4(b), and J0439+1634 of 3.3, Yang et al. 2019) as well. The low ratio measured from the nuclear region (within kpc) in J2310+1855 suggests a warm and dense neutral gas component, which is likely to be heated by the luminous AGN (see also Section 4.2). The ratio increases with increasing ionization parameter or decreasing metallicity (Nagao et al. 2011; Pereira-Santaella et al. 2017; Rigopoulou et al. 2018). The dust opacity could also influence the strengths of the and lines (see Section 4.4). Local (U)LIRGs and AGNs reveal a wide range in the ratio, which may result from different ionization parameters in different galaxies (considering negligible differences in metallicity). The dwarf galaxy sample, however, shows systematically higher ratios compared to all local (U)LIRGs and AGNs, which can be attributed to the low metallicity in these dwarf galaxies. The ratio of 2.8 in J2310+1855 is within the range of local (U)LIRGs and AGNs, consistent with the value found in J1342+0928, and smaller than the ratio of 20.9 in SPT 0418-47. A considerable fraction of the [N II]122μm emission can arise from the XDRs (see details in Sections 4.3 and 4.4). The comparable ratio in J2310+1855 to the ratios found in local (U)LIRGs and AGNs, however disfavors a significant XDR contribution to the [N II]122μm line. Accordingly, it is likely a result of (1) lower ionization parameter, (2) higher metallicity, or (3) higher dust opacity compared to SPT 0418-47 that causes the lower ratio in J2310+1855. This is also in agreement with the derived smaller metallicity in SPT 0418-47 than J2310+1855 (see Section 4.4).
In Figure 4(c), we show the versus diagnostic diagram. Because the [O III]88μm/[O I]146μm ratio has negligible dependence on metallicity, it is a direct probe of the volume filling factor ratio between the ionized and atomic gas. Local (U)LIRGs and AGNs have similar distributions of the ratio, while the high ratios in dwarf galaxies are due to the low gas density that enables UV photons to reach the outer regions of galaxies. The high-redshift systems J2310+1855, J1342+0928 and SPT 0418-47 reside within the range of local (U)LIRGs and AGNs. J2310+1855 exhibits a ratio of 1.9, which is over two times lower than J1342+0928 and SPT 0418-47, and approximately three times lower than the mean of the (U)LIRGs and AGNs, suggesting a slightly smaller ionized fraction in J2310+1855 compared to local (U)LIRGs, AGNs and other high- systems. This is also in agreement with the derived small contribution(17) of [C II]158μm from ionized gas in Section 4.3. Figure 4(d) shows the versus diagnostic diagram. Assuming that the majority of [C II]158μm emission arises from the neutral gas, the ratio could probe the atomic and ionized gas volume filling factor ratio as well. J2310+1855 reveals a comparable with the mean of local (U)LIRGs and AGNs, and over five times of the values found in J1342+0928 and SPT 0418-47. That the and ratios deliver different results for J2310+1855 compared to other samples is likely due to the additional dependence of the ratio on metallicity and the variation of the [C II]158μm emission from ionized gas in different galaxies. Therefore, the ratio is a better tracer than the ratio when probing the atomic and ionized gas volume filling factor ratio.
5 Summary
In this paper, we report the detection of the [N II]122μm and [O I]146μm lines from the quasar J2310+1855. Together with other FIR FS lines observed in this source, namely [C II]158μm and [O III]88μm, J2310+1855 is among the quasars with the most complete set of FS lines available to date. To probe the physical conditions of the atomic and ionized gas and evaluate the impact of AGN on the ISM, we compared the line emission to other measurements of local (U)LIRGs, AGNs and other high-redshift systems. The main results are summarized below.
Of all the FS lines detected in J2310+1855, the [C II]158μm, [N II]122μm, and [O III]88μm lines show a “line deficit” relative to the FIR emission, which is comparable to local (U)LIRGs and AGNs. In contrast, the [O I]146μm line has a line-to-FIR flux ratio more than two times higher than that found in local galaxies, which suggests a warm and dense neutral gas component, that is possibly heated by the AGN.
From the observed [N II]122μm luminosity and the estimated [N II]205μm luminosity of J2310+1855, we derive a density for the ionized gas of 45 and estimate that only of the [C II]158μm emission originates in the ionized gas. This is in agreement with the results found in local (U)LIRGs, AGNs, and other high-redshift quasars.
We estimate a gas phase metallicity =1.52.1 from the [O III]88μm/[N II]122μm ratio.
Utilizing line ratios as ISM physical condition diagnostics, J2310+1855 exhibits a ratio more than two times lower than local (U)LIRGs, AGNs and high-redshift systems ( quasar J1342+0928 and lensed dusty star-forming galaxy SPT 0418-47), suggesting a lower ionized gas fraction, consistent with the derived small contribution () of [C II]158μm line from ionized gas. J2310+1855 also reveals a ratio comparable to J1342+0928, local (U)LIRGs and AGNs, but more than seven times higher than SPT 0418-47, which is likely a result of a lower ionization parameter, a higher metallicity or a higher dust opacity for . Similar to other high- systems with available detections, J2310+1855 resides in the lowest ratio region of local (U)LIRGs, indicative of warm and dense atomic gas most likely heated by the AGN.
Our work highlights future prospects for [O I]146μm line detection by ALMA in other quasars and starburst galaxies at . Assuming a similar [C II]158μm/[O I]146μm ratio as that of J2310+1855, the quasars with a [C II]158μm flux could be detected with S/N¿3 in the [O I]146μm line with less than 35 minutes of ALMA time. As shown in this paper, the observations of a combination of various fine-structure lines in quasars and galaxies at , including e.g., [O III]88μm, [N II]122μm, [N II]205μm, [O I]146μm, [C II]158μm and [O I]63μm lines are critical in providing a detailed and unique diagnostic of the mutiphase ISM in these objects.
6 acknowledgement
This work was supported by the National Science Foundation of China (NSFC, 11721303, 11991052) and the National Key R&D Program of China (2016YFA0400703). R.W. acknowledges supports from the NSFC grants No. 11533001 and the Thousand Youth Talents Program of China. We thank T. Hashimoto, M. Pereira-Santaella, R. Herrera-Camus, and T. Díaz-Santos for kindly providing the data. We thank Feng Long for suggestions and help on the figures. D.R. acknowledges support from the National Science Foundation under grant numbers AST-1614213 and AST-1910107 and from the Alexander von Humboldt Foundation through a Humboldt Research Fellowship for Experienced Researchers. FW acknowledges funding through ERC program CosmicGas. YG’s research is supported by National Key Basic Research and Development Program of China (grant No. 2017YFA0402704), National Natural Science Foundation of China (grant Nos. 11861131007, 11420101002), and Chinese Academy of Sciences Key Research Program of Frontier Sciences (grant No. QYZDJSSW-SLH008). FB acknowledges support through the DFG Collaborative Research Centre 956. This paper is based on ALMA observations: ADS/JAO.ALMA 2015.1.01265.S. ALMA is a partnership of ESO (representing its member states), NSF (USA) and NINS (Japan), together with NRC (Canada), MOST and ASIAA (Taiwan), and KASI (Republic of Korea), in cooperation with the Republic of Chile. The Joint ALMA Observatory is operated by ESO, AUI/NRAO and NAOJ.
| Line | FWHM | S | Beam Size | Source Size | Luminosity | SFR | Ref. | |
|---|---|---|---|---|---|---|---|---|
| (km s-1) | (Jy ) | (arcsec) | (arcsec) | () | ||||
| (1) | (2) | (3) | (4) | (5) | (6) | (7) | (8) | (9) |
| 328 58 | 0.72 0.20 | 0.56 0.46, PA=-22° | (0.54 0.19) (0.31 0.16), PA=105°32° | 0.88 0.24 | 62 | 2208 | L20 | |
| 376 16 | 1.25 0.08 | 0.58 0.47, PA=-1° | (0.50 0.07) (0.32 0.09), PA=120°20° | 1.28 0.08 | 1700 | 11917 | L20 | |
| 333 72 | 1.38 0.34 | 0.71 0.61, PA=-60° | (0.44 0.27) (0.38 0.13), PA=70°97° | 2.44 0.61 | 7.7 | 1058 | H19 | |
| 393 21 | 8.83 0.44 | 0.72 0.51, PA=10° | (0.55 0.05) (0.40 0.07), PA=123°44° | 8.310 0.414 | 7800 | 1524 | W13 |
Note. — Column 1: line ID; Column 2 - 3: line width in FWHM and line flux. Note that the line flux is calculated through a single Gaussian fit to the line profile, and the flux uncertainty is the statistical error from the Gaussian fit; Column 4: beam size in FWHM, PA represents position angle; Column 5: source size deconvolved from the beam in FWHM; Column 6: line luminosity. Uncertanties are derived from the flux uncertainties; Column 7: ionized (neutral) gas mass estimated from the and ( and ) emission lines. Column 8: SFR derived from the line luminosities. Column 9: references: This work (L20); Wang et al. (2013) (W13); Hashimoto et al. (2019) (H19).
| Frequency | S | Rms | Beam Size | Source Size |
|---|---|---|---|---|
| (GHz) | (mJy) | () | (arcsec) | (arcsec) |
| (1) | (2) | (3) | (4) | (5) |
| 344.2 | 14.94 0.08 | 49 | 0.55 0.44, PA=-27° | (0.29 0.03) (0.23 0.02), PA=134°16° |
| 289.2 | 11.76 0.04 | 25 | 0.59 0.48, PA=-1° | (0.33 0.02) (0.25 0.02), PA=154°7° |
Note. — Column 1: continuum frequency in observed frame; Column 2-3: continuum flux density and rms; Column 4-5: beam size and source size deconvolved from beam in FWHM, PA represents position angle. The deconvolved source sizes of the emission lines (see Table 1) are times larger than those derived from the continuum emissions. This is in agreement with the results found in ALMA observations of other high-z quasar host galaxies and submillimeter galaxies (SMGs; e.g., Wang et al. 2013, 2019a; Díaz-Santos et al. 2016; Venemans et al. 2016, 2017c; Gullberg et al. 2018; Cooke et al. 2018; Rybak et al. 2019).


References
- Asplund et al. (2009) Asplund, M., Grevesse, N., Sauval, A. J., et al. 2009, ARA&A, 47, 481
- Bañados et al. (2019) Bañados, E., Novak, M., Neeleman, M., et al. 2019, ApJ, 881, L23
- Carilli & Walter (2013) Carilli, C. L., & Walter, F. 2013, ARA&A, 51, 105
- Cheng et al. (2020) Cheng, C., Cao, X., Lu, N., et al. 2020, ApJ, 898, 33
- Cooke et al. (2018) Cooke, E. A., Smail, I., Swinbank, A. M., et al. 2018, ApJ, 861, 100
- Cormier et al. (2015) Cormier, D., Madden, S. C., Lebouteiller, V., et al. 2015, A&A, 578, A53
- De Breuck et al. (2019) De Breuck, C., Weiß, A., Béthermin, M., et al. 2019, A&A, 631, A167
- Decarli et al. (2018) Decarli, R., Walter, F., Venemans, B. P., et al. 2018, ApJ, 854, 97
- De Looze et al. (2014) De Looze, I., Cormier, D., Lebouteiller, V., et al. 2014, A&A, 568, A62
- Díaz-Santos et al. (2016) Díaz-Santos, T., Assef, R. J., Blain, A. W., et al. 2016, ApJ, 816, L6
- Díaz-Santos et al. (2017) Díaz-Santos, T., Armus, L., Charmandaris, V., et al. 2017, ApJ, 846, 32
- Farrah et al. (2013) Farrah, D., Lebouteiller, V., Spoon, H. W. W., et al. 2013, ApJ, 776, 38
- Ferkinhoff et al. (2011) Ferkinhoff, C., Brisbin, D., Nikola, T., et al. 2011, ApJ, 740, L29
- Ferkinhoff et al. (2015) Ferkinhoff, C., Brisbin, D., Nikola, T., et al. 2015, ApJ, 806, 260
- Ferland et al. (2017) Ferland, G. J., Chatzikos, M., Guzmán, F., et al. 2017, rmxaa, 53, 385
- Fernández-Ontiveros et al. (2016) Fernández-Ontiveros, J. A., Spinoglio, L., Pereira-Santaella, M., et al. 2016, ApJS, 226, 19
- Gallerani et al. (2014) Gallerani, S., Ferrara, A., Neri, R., & Maiolino, R. 2014, MNRAS, 445, 2848
- González-Alfonso et al. (2012) González-Alfonso, E., Fischer, J., Graciá-Carpio, J., et al. 2012, A&A, 541, A4
- Gullberg et al. (2015) Gullberg, B., De Breuck, C., Vieira, J. D., et al. 2015, MNRAS, 449, 2883
- Gullberg et al. (2018) Gullberg, B., Swinbank, A. M., Smail, I., et al. 2018, ApJ, 859, 12
- Hashimoto et al. (2019) Hashimoto, T., Inoue, A. K., Tamura, Y., et al. 2019, PASJ, 71, 109
- Herrera-Camus et al. (2016) Herrera-Camus, R., Bolatto, A., Smith, J. D., et al. 2016, ApJ, 826, 175
- Herrera-Camus et al. (2018a) Herrera-Camus, R., Sturm, E., Graciá-Carpio, J., et al. 2018, ApJ, 861, 94
- Herrera-Camus et al. (2018b) Herrera-Camus, R., Sturm, E., Graciá-Carpio, J., et al. 2018, ApJ, 861, 95
- Jiang et al. (2007) Jiang, L., Fan, X., Vestergaard, M., et al. 2007, AJ, 134, 1150
- Lee et al. (2019) Lee, M. M., Nagao, T., De Breuck, C., et al. 2019, ApJ, 883, L29
- Li et al. (2020) Li, J., Wang, R., Riechers, D., et al. 2020, ApJ, 889, 162
- Lu et al. (2015) Lu, N., Zhao, Y., Xu, C. K., et al. 2015, ApJ, 802, L11
- Lu et al. (2017) Lu, N., Zhao, Y., Díaz-Santos, T., et al. 2017, ApJ, 842, L16
- Lu et al. (2018) Lu, N., Cao, T., Díaz-Santos, T., et al. 2018, ApJ, 864, 38
- Lutz et al. (2016) Lutz, D., Berta, S., Contursi, A., et al. 2016, A&A, 591, A136
- McMullin et al. (2007) McMullin, J. P., Waters, B., Schiebel, D., et al. 2007, adass XVI, 376, 127
- Nagao et al. (2011) Nagao, T., Maiolino, R., Marconi, A., & Matsuhara, H. 2011, A&A, 526, A149
- Novak et al. (2019) Novak, M., Bañados, E., Decarli, R., et al. 2019, ApJ, 881, 63
- Oberst et al. (2006) Oberst, T. E., Parshley, S. C., Stacey, G. J., et al. 2006, ApJ, 652, L125
- Oberst et al. (2011) Oberst, T. E., Parshley, S. C., Nikola, T., et al. 2011, ApJ, 739, 100
- Pavesi et al. (2016) Pavesi, R., Riechers, D. A., Capak, P. L., et al. 2016, ApJ, 832, 151
- Pavesi et al. (2019) Pavesi, R., Riechers, D. A., Faisst, A. L., et al. 2019, ApJ, 882, 168
- Pereira-Santaella et al. (2017) Pereira-Santaella, M., Rigopoulou, D., Farrah, D., Lebouteiller, V., & Li, J. 2017, MNRAS, 470, 1218
- Rangwala et al. (2011) Rangwala, N., Maloney, P. R., Glenn, J., et al. 2011, ApJ, 743, 94
- Riechers et al. (2009) Riechers, D. A., Walter, F., Bertoldi, F., et al. 2009, ApJ, 703, 1338
- Riechers et al. (2013) Riechers, D. A., Bradford, C. M., Clements, D. L., et al. 2013, Nature, 496, 329
- Rigopoulou et al. (2018) Rigopoulou, D., Pereira-Santaella, M., Magdis, G. E., et al. 2018, MNRAS, 473, 20
- Rosenberg et al. (2015) Rosenberg, M. J. F., van der Werf, P. P., Aalto, S., et al. 2015, ApJ, 801, 72
- Rybak et al. (2019) Rybak, M., Calistro Rivera, G., Hodge, J. A., et al. 2019, ApJ, 876, 112
- Rybak et al. (2020) Rybak, M., Zavala, J. A., Hodge, J. A., et al. 2020, ApJ, 889, L11
- Shao et al. (2017) Shao, Y., Wang, R., Jones, G. C., et al. 2017, ApJ, 845, 138
- Shao et al. (2019) Shao, Y., Wang, R., Carilli, C. L., et al. 2019, ApJ, 876, 99
- Shao et al. (2020) Shao et al. 2020, in preparation
- Shen et al. (2019) Shen, Y., Wu, J., Jiang, L., et al. 2019, ApJ, 873, 35
- Spinoglio et al. (2015) Spinoglio, L., Pereira-Santaella, M., Dasyra, K. M., et al. 2015, ApJ, 799, 21
- Uzgil et al. (2016) Uzgil, B. D., Bradford, C. M., Hailey-Dunsheath, S., et al. 2016, ApJ, 832, 209
- Venemans et al. (2016) Venemans, B. P., Walter, F., Zschaechner, L., et al. 2016, ApJ, 816, 37
- Venemans et al. (2017a) Venemans, B. P., Walter, F., Decarli, R., et al. 2017, ApJ, 845, 154
- Venemans et al. (2017b) Venemans, B. P., Walter, F., Decarli, R., et al. 2017, ApJ, 851, L8
- Venemans et al. (2017c) Venemans, B. P., Walter, F., Decarli, R., et al. 2017, ApJ, 837, 146
- Walter et al. (2018) Walter, F., Riechers, D., Novak, M., et al. 2018, ApJ, 869, L22
- Wang et al. (2011) Wang, R., Wagg, J., Carilli, C. L., et al. 2011, ApJ, 739, L34
- Wang et al. (2013) Wang, R., Wagg, J., Carilli, C. L., et al. 2013, ApJ, 773, 44
- Wang et al. (2016) Wang, R., Wu, X.-B., Neri, R., et al. 2016, ApJ, 830, 53
- Wang et al. (2019a) Wang, R., Shao, Y., Carilli, C. L., et al. 2019, ApJ, 887, 40
- Wang et al. (2019b) Wang, F., Wang, R., Fan, X., et al. 2019, ApJ, 880, 2
- Weiß et al. (2005) Weiß, A., Downes, D., Henkel, C., et al. 2005, A&A, 429, L25
- Wu et al. (2015) Wu, X.-B., Wang, F., Fan, X., et al. 2015, Nature, 518, 512
- Yang et al. (2019) Yang, J., Venemans, B., Wang, F., et al. 2019, ApJ, 880, 153
- Zhao et al. (2016) Zhao, Y., Lu, N., Xu, C. K., et al. 2016, ApJ, 819, 69