Investigating dissociation pathways of nitrobenzene via mega-electron-volt ultrafast electron diffraction
Abstract
As the simplest nitroaromatic compound, nitrobenzene is an interesting model system to explore the rich photochemistry of nitroaromatic compounds. Previous measurements of nitrobenzene’s photochemical dynamics have probed structural and electronic properties, which, at times, paints a convoluted and sometimes contradictory description of the photochemical landscape. A sub-picosecond structural probe can complement previous electronic measurements and aid in determining the photochemical dynamics with less ambiguity. We investigate the ultrafast dynamics of nitrobenzene triggered by photoexcitation at 267 nm employing megaelectronvolt ultrafast electron diffraction with femtosecond time resolution. We measure the first 5 ps of dynamics and, by comparing our measured results to simulation, we unambiguously distinguish the lowest singlet and triplet electronic states. We observe ground state recovery within 160 60 fs through internal conversions and without signal corresponding to photofragmentation. Our lack of dissociation signal within the first 5 ps indicates that previously observed photofragmenation reactions take place in the vibrationally “hot” ground state on timescales considerably beyond 5 ps.
I Introduction
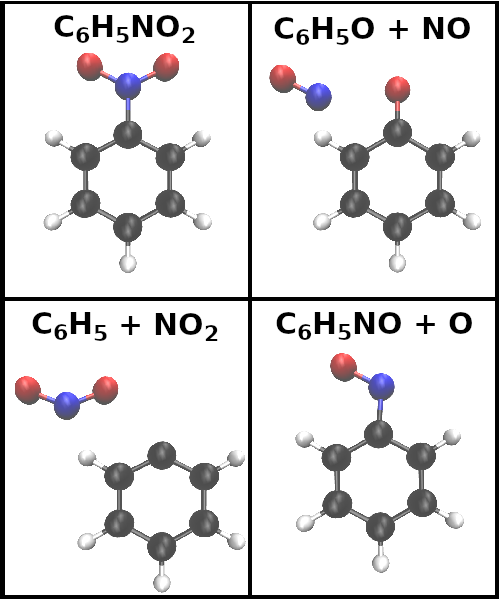
Nitroaromatics exhibit an intriguing and diverse photochemistry enabled by the availability of fast intersystem crossing (ISC) channels due to the presence of the nitro functional group (NO2). Therefore, they are ideal benchmark systems for both experimental and simulation methods and have been extensively studied [1, 2, 3, 4, 5, 6, 7, 8, 9, 10, 11, 12, 13, 14]. Nitrobenzene (NB) represents the simplest nitroaromatic and is depicted in Fig. 1. Its gas-phase photochemistry following excitation in the 200-280 nm range has been investigated by various methods on timescales ranging from femtoseconds to microseconds [15, 10, 9, 13, 7, 8, 6].
The three main photofragmentation pathways according to previous photolysis experiments are (1) NO2, (2) NO, and (3) O abstraction (see associated fragment structures in Fig. 1) [10, 15]
| (1) | ||||
| (2) | ||||
| (3) |
whereas contributions from channel 3 are minor. The branching ratio between channels 1 and 2 is excitation energy dependent with NO2 dominating the distribution at higher photon energies [15].
Channel 2 is of particular interest, since the NO reaction product cannot result from a simple photodissociation reaction but must involve a more complicated mechanism involving both bond formation and cleavage. Proposed mechanisms include isomerization through an oxizaridine ring [6, 11, 16, 12, 15, 17, 18] or a roaming-type reaction [18, 13].
The photochemical dynamics triggered by photoexcitation at 267 nm into the lowest absorption band of NB have been investigated in a number of time-resolved studies employing different observables. The photolysis study by Lin et al. finds a fragmentation timescale of 59 ns [15]. Saalbach et al. employ time-resolved photoelectron spectroscopy (TRPES) and observe dynamics in the femtosecond to picosecond range. They assign a relaxation mechanism involving efficient ISC to the triplet manifold based on the strong spin-orbit coupling observed in NB. However, the TRPES spectra do not provide an unambiguous signature of the ISC. In agreement with the previous photolysis study, no evidence of photofragmentation was observed in the TRPES spectra within the first 200 ps after photoexcitation.
In contrast, a study by He et al. using ultrafast electron diffraction (UED) with picosecond time resolution found photofragmentation to take place within 8.8 ps [6]. However, the limited temporal resolution of the study did not permit a detailed investigation of the structural dynamics leading to photofragmentation.
Additionally, the electronic structure and photochemistry of NB was subject to several theoretical investigations [11, 19, 14, 12, 17, 9, 13]. These studies predict reaction pathways on the potential energy surfaces of both the lowest singlet and triplet states.
With our present study, we address the disagreement in the literature with respect to the timescale of photofragmentation of NB. We employ ultrafast electron diffraction at megaelectronvolt kinetic energies (MeV-UED), which results in femtosecond temporal resolution. The sub-picosecond time resolution has enabled MeV-UED studies to make important contributions to the elucidation of elementary photochemical reaction mechanisms [20, 21, 22, 23, 24, 25, 26, 27, 28]. Using MeV-UED we address the question of the photofragmentation timescale of NB. Additionally, we revisit the question about the multiplicity of the electronic state the photofragmentation takes place in.
II Methods
We imaged the sub-picosecond structural dynamics of excited NB using megaelectronvolt gas-phase diffraction at the SLAC UED facility. Reference [29] describes the experimental setup in detail. Briefly, a pulsed nozzle (Parker) operating at 180 Hz delivered the gas phase NB sample to the chamber. To deliver gaseous NB, which is a liquid at room temperature, we heated the sample to ~410 K with a corresponding vapor pressure of 0.12 bar [30, 31]. The sample was excited at 267 nm with an intensity of W/cm2. The intensity dependence of the diffraction signal with respect to the pump intensity was investigated to confirm that photoexcitation was in the linear regime. We probed the ensuing structural dynamics with a 3.7 MeV electron probe pulse. We determined the overlap between the 267 nm pump laser pulse and the electron probe using a solid-state sample independent from the gaseous NB. The temporal resolution of the experiment was approximately 150 fs full width at half maximum (FWHM) [20]. Our measurement focused on the first 1.1 ps of the pump-probe delay and a single measurement at a 5 ps delay. Within the first 1.1 ps, we sampled pump-probe delays below 400 fs with 67 fs temporal intervals, and for delays beyond 400 fs we sampled with 100 fs intervals. The maximum momentum-transfer of diffracted electrons was limited by signal-to-noise to 8 Å-1. Due to a hole in the detector that transmits undiffracted electrons and contamination of the scattering angles close to the edge of the hole, the minimum momentum-transfer was 2 Å-1.
Diffraction patterns were simulated within the independent atom model using a publicly available code [32] based on form factors evaluated with the ELSEPA program package [33]. Structures of expected dissociative states were calculated by solving for the ground state structures of each fragment using the Firefly package [34]. The ground state NB structure was taken from Ref. [11]. For simulations of the vibrationally “hot” ground state and triplet state, all quantum chemical calculations were performed in the ORCA 5.0 program package [35, 36]. Stationary points and vibrational frequencies were performed using B3LYP/def2-SVP [37, 38, 39, 40]. For the structural signatures, we adapted a procedure, which was previously used for spectroscopy applications [41, 42], for electron diffraction signatures. In short, we approximate the distribution of the photoabsorbed energy over the vibrational degrees of freedom as statistical, which can be in turn approximated by a canonical ensemble of a specific vibrational temperature using evaluated vibrational frequencies. In the case of the electronic ground state, the vibrational energy is identical with the excitation photon energy of 4.65 eV, which corresponds to a vibrational temperature of 2940 K. For the triplet state, we evaluate the energy difference between the ground state minimum and the triplet state minimum using CCSD/aug-cc-pVDZ, [43, 44] correct it by the zero point vibrational energies of both states, and subtract it from the absorbed photon energy. The remaining excess vibrational energy is 2.25 eV, which corresponds to a vibrational temperature of 1335 K. We use these temperatures to simulate molecular dynamics trajectories for both states using PBE0/def2-SVP [45]. The starting geometries of the trajectories are the respective minimum geometries. The trajectories are propagated for 10 ps. To evaluate diffraction signatures, 5000 geometries are randomly sampled from the last quarter of the trajectory.
When working with the data, we use the modified molecular isotropic scattering pattern, which removes the strong dependence in the atomic scattering factors [46].
| (4) |
Here, is the measured diffraction pattern, is the azimuthal angle on the detector, and is the atomic scattering amplitude of the atom calculated with the ELSEPA program package [33]. We highlight the molecular dynamics through the difference in modified diffraction intensity (sM()), by subtracting the before the arrival of the 267 nm pump pulse. Taking this difference also removes the constant atomic scattering and most time-invariant detector artifacts from our measurement.
In the following analysis, we examine the rise of the observed signal and the subsequent molecular state NB occupies. Our method and detailed results for extracting the rise time are given in Section VII and briefly below. For each time point, we sum over the absolute value of the ratio between sM() and its standard deviation: . The rise time is determined by fitting these dynamics to an error function.
III Results
Nitrobenze’s absorption spectrum between 215–285 nm is dominated by a strong absorption band associated with excitation to S4 and centered at 248 nm [15, 47, 48]. It exhibits a weak shoulder associated with a transition to S3 and centered at 280 nm [15, 48]. Our 267 nm pump pulse is redshifted from the stronger S4 and blueshifted from the much weaker S3 band. Thus, we primarily photoexcite NB into the S4 state, but the simultaneous preparation of minor amounts of population in the S3 state cannot be ignored.
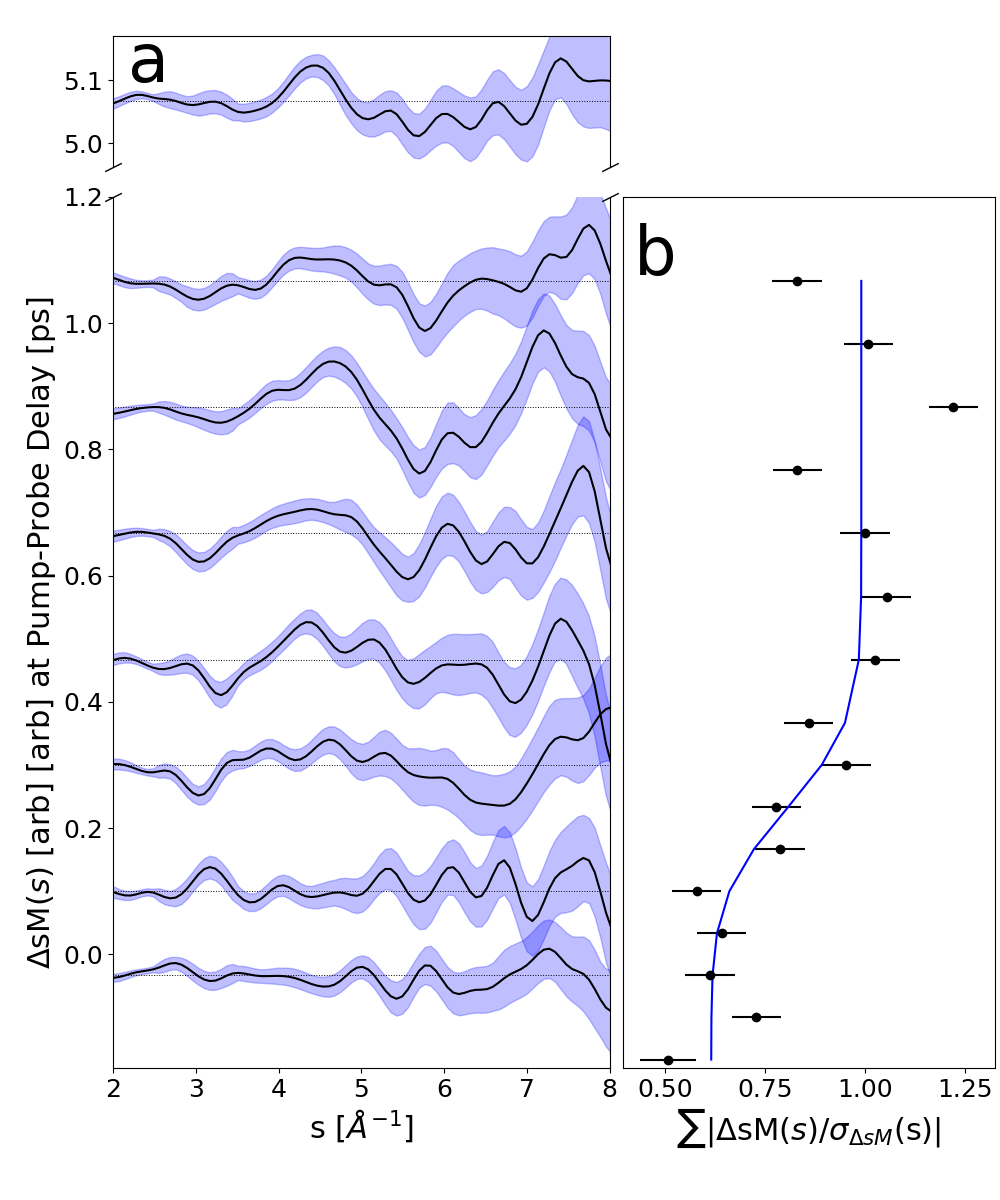
Following photoexcitation to the S3 and S4 states, we observe the onset of a transient diffraction signal, shown in Fig. 2, around time zero. This signal is characterized by intensity increases between Å-1 and Å-1, as well as a depletion between Å-1. We quantify the rise time of this transient signal to be fs (Fig 2b) by an error function fit. We do not believe this result is due to our instrument response as previous PES by Saalbach et al. are sensitive to sub-100 fs lifetimes and observe a similar fs lifetime [7].
Following the onset of the transient signal at time zero we do not observe significant structural dynamics in Fig. 2 (panels a and b). We consider NB has reached a steady state after undergoing either a photochemical reaction or a redistribution of energy into vibrational degrees of freedom. To determine the structural changes associated with the onset of the steady-state signal in Fig. 2a we compare the averaged sM() between 0.75–5.25 ps, where we no longer observe changes, to simulations of different processes in Fig. 3.
| Simulation | |
|---|---|
| S0 | 0.29 |
| 0.30 | |
| T1 | 0.37 |
| 0.58 | |
| 0.91 |
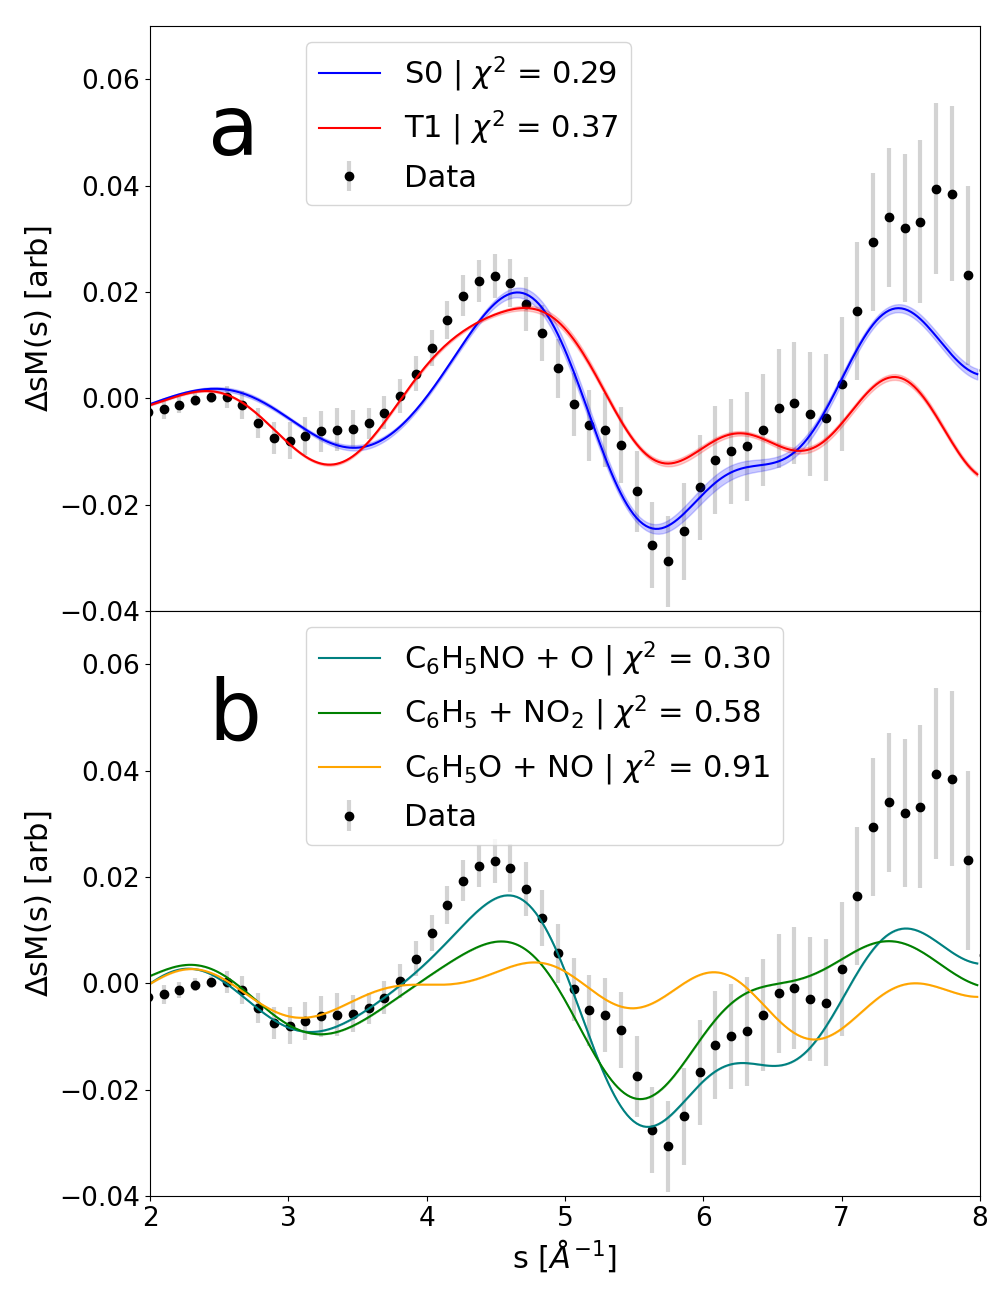
We employ two types of simulated sM() in this comparison, those based on the vibrationally “hot” molecules in the S0 and T1 states as well as optimized product structures from the three photofragmentation channels (Fig. 3) [10, 15]. In the former case (Fig. 3a), the sM() signal originates from the substantial amount of energy, absorbed from the pump photon, being redistributed into the vibrational degrees of freedom (see the methods section). In the latter case (Fig. 3b), we expect the signal to be dominated by the elimination of many pairwise distances and can therefore be approximated by a single fragment structure.
In the comparison in Fig. 3a, the simulation of the vibrationally ”hot” S0 signature clearly agrees better with the experiment, specifically in the regime above Å-1. In the comparison in Fig. 3b, the signature of the channel clearly shows the best agreement.
We quantify the agreement between experimental and simulated sM() signatures by the values from linear fits of the simulations to the experimental data. These values are listed in Table 1. The vibrationally “hot” S0 simulation yields both the best qualitative and quantitative () agreement with the measurement. The value of the channel is slightly larger and the values of the and channels values two and three times larger, respectively.
IV Discussion
According to our fit results, the “hot” ground state and the dissociation channel signatures describe the experimental sM() signal almost equally well. However, the dissociation was previously observed to be a minor channel [15]. Thus, the corresponding experimental signature must represent a weighted superposition of with different signatures of higher weight, e.g. other photofragmentation channels or vibrationally “hot” signatures. However, fits of such superpositions to the experimental signature either yield weights incompatible with being a small channel or trivial results (superposition with “hot” S0 signature). Thus, our time-resolved structural probe of NB indicates the molecule relaxes from the S3 and S4 states to the vibrationally “hot” S0 state, with a fs rise time. This is in agreement with Saalbach et al. who do not observe time-dependent fragmentation, from ion yields, within the first 200 ps [7].
The observed timescale is consistent with the previous TRPES work by Saalbach et al. which observed NB relaxation from S3 and S4 with a fs lifetime [7]. Saalbach et al. interpret the lifetime differently, as relaxation to the “hot” T1, but admit that their probe is not particularly sensitive to the multiplicity of the final state of the relaxation. Previous theoretical works [11, 16, 19, 14] propose relaxation channels leading to both S0 and T1.
Our results disagree with this scenario in two ways. Firstly, fits of the experimental signature with a superposition of the vibrationally “hot” S0 and T1 simulations yield either comparable or significantly larger values than with S0 alone. This can be seen in Fig. 3a where adding the T1 signature to S0 deviates the S0 signature away from the data except within the small regions between 2.5-3 Å-1 and 3.5-4.25 Å-1. That is, we would expect such a superposition to improve the fit within a ~1.25 Å-1 range while worsening the fit in the remaining ~4.75 Å-1 fit range. Secondly, despite a growing body of evidence for the existence of ultrafast, even sub-picosecond ISC in molecules exclusively comprised of light elements [49], the assignment of the observed 200 fs timescale to ISC would require strong additional evidence. However, our analysis of the measured time-dependent diffraction signal aided by simulated signals from thermalized molecular dynamic simulations clearly points to population of the vibrationally “hot” S0 via internal conversion.
The observation of the repopulation of S0 and the absence of additional structural dynamics within the first 5 ps after excitation indicates, in agreement with previous studies [15, 7, 10], that photofragmentation reactions must occur on larger timescales. These results are, however, in disagreement with the previous picosecond time-resolved UED study, which reported photofragmentation with a time constant of 8.8 ps [6]. The previously observed sM() signature is in reasonable agreement with our observations. Thus, we hypothesize that the previously observed time constant represents the experimental time resolution (6 ps [6]) rather than the reaction dynamics of the molecule.
The disagreement in the interpretation of the sM() signals might lie in the employed models. He et al. simulated the signature of the vibrationally “hot” S0 under the assumption that it can be described by a single geometry through the incorporation of effects from the vibrational excitation [6]. However, a statistical distribution of the absorbed photon energy in the vibrational modes corresponds to a vibrational temperature of 2940 K (see methods). It is likely that at this high vibrational temperature the experimental signature is not well described anymore by a single geometry and, therefore, the employed model is not valid anymore. An ab initio trajectory explicitly exploring the phase space, as performed in the present study and likely computationally infeasible at the time of the previous study, can easily overcome this limitation.
V Conclusion
We investigated the complex photochemistry of the simplest nitroaromatic, nitrobenzene, in the first sub-picosecond resolved study with specific sensitivity to the structural evolution of the compound, using MeV-UED. Our results reveal, aided by simulations, that after excitation to the S4 and S3 excited states at 267 nm, NB relaxes to the vibrationally “hot” S0 state within fs. Due to the global sensitivity of MeV-UED to structural changes, we preclude previously proposed channels (e.g. relaxation via ISC to the triplet manifold and photofragmentation) from receiving a significant amount of population within the observed 5 ps after photoexcitation. Our results point to the previously observed photochemistry happening on longer timescales through statistical mechanisms on the S0 potential energy surface. Thus, our results present an important contribution to the elucidation of photochemical reaction mechanisms in nitrobenzene and nitroaromatic compounds in general.
Acknowledgements.
We thank the 2018 SLAC MeV-UED gas-phase team and the ASTA team for their help in running our MeV-UED experiment. We also thank our funding agencies for supporting this work. This work is supported by the U.S. Department of Energy Office of Science, Basic Energy Sciences, Chemical Sciences, Geosciences, and Biosciences Division. The UED work was performed at SLAC MeV-UED, which is supported in part by the Department of Energy Basic Energy Sciences’ Scientific User Facility Division Accelerator and Detector research and development program, the LCLS Facility, and SLAC under contract Nos. DE-AC02-05-CH11231 and DE-AC02-76SF00515.english
References
- López-Arteaga et al. [2013] R. López-Arteaga, A. B. Stephansen, C. A. Guarin, T. I. Sølling, and J. Peon, The Journal of Physical Chemistry B 117, 9947 (2013), pMID: 23906388, https://doi.org/10.1021/jp403602v .
- Rodríguez-Córdoba et al. [2021] W. Rodríguez-Córdoba, L. Gutiérrez-Arzaluz, F. Cortés-Guzmán, and J. Peon, Chem. Commun. 57, 12218 (2021).
- Plaza-Medina et al. [2011] E. F. Plaza-Medina, W. Rodríguez-Córdoba, R. Morales-Cueto, and J. Peon, The Journal of Physical Chemistry A 115, 577 (2011), pMID: 21214230, https://doi.org/10.1021/jp109041y .
- Echeverri et al. [2019] M. Echeverri, S. Gámez-Valenzuela, R. C. González-Cano, J. Guadalupe, S. Cortijo-Campos, J. T. López Navarrete, M. Iglesias, M. C. Ruiz Delgado, and B. Gómez-Lor, Chemistry of Materials 31, 6971 (2019), https://doi.org/10.1021/acs.chemmater.9b01432 .
- Zobel and González [2019] J. P. Zobel and L. González, ChemPhotoChem 3, 833 (2019), https://chemistry-europe.onlinelibrary.wiley.com/doi/pdf/10.1002/cptc.201900108 .
- He et al. [2006] Y. He, A. Gahlmann, J. S. Feenstra, S. T. Park, and A. H. Zewail, Chemistry – An Asian Journal 1, 56 (2006), https://onlinelibrary.wiley.com/doi/pdf/10.1002/asia.200600107 .
- Saalbach et al. [2021] L. Saalbach, N. Kotsina, S. W. Crane, M. J. Paterson, and D. Townsend, The Journal of Physical Chemistry A 125, 7174 (2021).
- Schalk et al. [2018] O. Schalk, D. Townsend, T. J. Wolf, D. M. Holland, A. E. Boguslavskiy, M. Szöri, and A. Stolow, Chemical Physics Letters 691, 379 (2018).
- Galloway et al. [1994] D. B. Galloway, T. Glenewinkel‐Meyer, J. A. Bartz, L. G. Huey, and F. F. Crim, The Journal of Chemical Physics 100, 1946 (1994), https://doi.org/10.1063/1.466547 .
- Galloway et al. [1993] D. B. Galloway, J. A. Bartz, L. G. Huey, and F. F. Crim, The Journal of Chemical Physics 98, 2107 (1993), https://doi.org/10.1063/1.464188 .
- Giussani and Worth [2017] A. Giussani and G. A. Worth, Journal of Chemical Theory and Computation 13, 2777 (2017), pMID: 28437102, https://doi.org/10.1021/acs.jctc.6b01149 .
- Giussani and Worth [2020] A. Giussani and G. A. Worth, Phys. Chem. Chem. Phys. 22, 15945 (2020).
- Hause et al. [2011] M. Hause, N. Herath, R. Zhu, M. Lin, and A. Suits, Nature chemistry 3, 932 (2011).
- Quenneville et al. [2011] J. Quenneville, M. Greenfield, D. S. Moore, S. D. McGrane, and R. J. Scharff, The Journal of Physical Chemistry A 115, 12286 (2011).
- Lin et al. [2007] M.-F. Lin, Y. T. Lee, C.-K. Ni, S. Xu, and M. C. Lin, The Journal of Chemical Physics 126, 064310 (2007), https://doi.org/10.1063/1.2435351 .
- Giussani [2014] A. Giussani, Journal of Chemical Theory and Computation 10, 3987 (2014).
- Xu and Lin [2005] S. Xu and M. C. Lin, The Journal of Physical Chemistry B 109, 8367 (2005).
- Suits [2008] A. Suits, Accounts of chemical research 41 7, 873 (2008).
- Mewes et al. [2014] J.-M. Mewes, V. Jovanović, C. M. Marian, and A. Dreuw, Phys. Chem. Chem. Phys. 16, 12393 (2014).
- Wolf et al. [2019a] T. J. A. Wolf, D. M. Sanchez, J. Yang, R. M. Parrish, J. P. F. Nunes, M. Centurion, R. Coffee, J. P. Cryan, M. Gühr, K. Hegazy, A. Kirrander, R. K. Li, J. Ruddock, X. Shen, T. Vecchione, S. P. Weathersby, P. M. Weber, K. Wilkin, H. Yong, Q. Zheng, X. J. Wang, M. P. Minitti, and T. J. Martínez, Nature Chemistry 11, 504 (2019a).
- Champenois et al. [2021] E. G. Champenois, D. M. Sanchez, J. Yang, J. P. F. Nunes, A. Attar, M. Centurion, R. Forbes, M. Gühr, K. Hegazy, F. Ji, S. K. Saha, Y. Liu, M.-F. Lin, D. Luo, B. Moore, X. Shen, M. R. Ware, X. J. Wang, T. J. Martínez, and T. J. A. Wolf, Science 374, 178 (2021), https://www.science.org/doi/pdf/10.1126/science.abk3132 .
- Liu et al. [2023] Y. Liu, D. M. Sanchez, M. R. Ware, E. G. Champenois, J. Yang, J. P. F. Nunes, A. Attar, M. Centurion, J. P. Cryan, R. Forbes, K. Hegazy, M. C. Hoffmann, F. Ji, M.-F. Lin, D. Luo, S. K. Saha, X. Shen, X. J. Wang, T. J. Martínez, and T. J. A. Wolf, Nature Communications 14, 2795 (2023), number: 1 Publisher: Nature Publishing Group.
- Yang et al. [2020] J. Yang, X. Zhu, J. P. F. Nunes, J. K. Yu, R. M. Parrish, T. J. A. Wolf, M. Centurion, M. Gühr, R. Li, Y. Liu, B. Moore, M. Niebuhr, S. Park, X. Shen, S. Weathersby, T. Weinacht, T. J. Martinez, and X. Wang, Science 368, 885 (2020), https://www.science.org/doi/pdf/10.1126/science.abb2235 .
- Yang et al. [2018] J. Yang, X. Zhu, T. J. A. Wolf, Z. Li, J. P. F. Nunes, R. Coffee, J. P. Cryan, M. Gühr, K. Hegazy, T. F. Heinz, K. Jobe, R. Li, X. Shen, T. Veccione, S. Weathersby, K. J. Wilkin, C. Yoneda, Q. Zheng, T. J. Martinez, M. Centurion, and X. Wang, Science 361, 64 (2018), https://www.science.org/doi/pdf/10.1126/science.aat0049 .
- Wilkin et al. [2019] K. J. Wilkin, R. M. Parrish, J. Yang, T. J. A. Wolf, J. P. F. Nunes, M. Guehr, R. Li, X. Shen, Q. Zheng, X. Wang, T. J. Martinez, and M. Centurion, Phys. Rev. A 100, 023402 (2019).
- Liu et al. [2020] Y. Liu, S. L. Horton, J. Yang, J. P. F. Nunes, X. Shen, T. J. A. Wolf, R. Forbes, C. Cheng, B. Moore, M. Centurion, K. Hegazy, R. Li, M.-F. Lin, A. Stolow, P. Hockett, T. Rozgonyi, P. Marquetand, X. Wang, and T. Weinacht, Phys. Rev. X 10, 021016 (2020).
- Champenois et al. [2023] E. G. Champenois, N. H. List, M. Ware, M. Britton, P. H. Bucksbaum, X. Cheng, M. Centurion, J. P. Cryan, R. Forbes, I. Gabalski, K. Hegazy, M. C. Hoffmann, A. J. Howard, F. Ji, M.-F. Lin, J. P. Nunes, X. Shen, J. Yang, X. Wang, T. J. Martinez, and T. J. A. Wolf, “Femtosecond electronic and hydrogen structural dynamics in ammonia imaged with ultrafast electron diffraction,” (2023), arXiv:2303.03586 [physics].
- Centurion et al. [2022] M. Centurion, T. J. Wolf, and J. Yang, Annual Review of Physical Chemistry 73, 21 (2022), _eprint: https://doi.org/10.1146/annurev-physchem-082720-010539.
- Shen et al. [2019] X. Shen, J. P. F. Nunes, J. Yang, R. K. Jobe, R. K. Li, M.-F. Lin, B. Moore, M. Niebuhr, S. P. Weathersby, T. J. A. Wolf, C. Yoneda, M. Guehr, M. Centurion, and X. J. Wang, Structural Dynamics 6, 054305 (2019), https://doi.org/10.1063/1.5120864 .
- of Standards and Technology [2023] N. I. of Standards and Technology, “Nist nitrobenzene webbook,” (2023), accessed on March 18, 2023.
- Brown [1952] I. Brown, Australian Journal of Chemistry 5, 530 (1952).
- Wolf [2023] T. J. A. Wolf, “Diffraction_simulation,” (2023).
- Salvat et al. [2005] F. Salvat, A. Jablonski, and C. J. Powell, Computer Physics Communications 165, 157 (2005).
- Granovsky [2022] A. A. Granovsky, http://classic.chem.msu.su/gran/firefly/index.html (2022).
- Neese [2012] F. Neese, WIREs Computational Molecular Science 2, 73 (2012), _eprint: https://onlinelibrary.wiley.com/doi/pdf/10.1002/wcms.81.
- Neese [2018] F. Neese, WIREs Computational Molecular Science n/a, e1606 (2018), _eprint: https://wires.onlinelibrary.wiley.com/doi/pdf/10.1002/wcms.1606.
- Becke [1993] A. D. Becke, J. Chem. Phys. 98, 5648 (1993).
- Stephens et al. [1994] P. J. Stephens, F. J. Devlin, C. F. Chabalowski, and M. J. Frisch, J. Phys. Chem. 98, 11623 (1994).
- Weigend and Ahlrichs [2005] F. Weigend and R. Ahlrichs, Phys. Chem. Chem. Phys. 7, 3297 (2005).
- Weigend [2006] F. Weigend, Phys. Chem. Chem. Phys. 8, 1057 (2006).
- Wolf et al. [2019b] T. J. A. Wolf, R. M. Parrish, R. H. Myhre, T. J. Mart inez, H. Koch, and M. Gühr, JOURNAL OF PHYSICAL CHEMISTRY A 123, 6897 (2019b).
- Wolf et al. [2021] T. J. A. Wolf, A. C. Paul, S. D. Folkestad, R. H. Myhre, J. P. Cryan, N. Berrah, P. H. Bucksbaum, S. Coriani, G. Coslovich, R. Feifel, T. J. Martinez, S. P. Moeller, M. Mucke, R. Obaid, O. Plekan, R. J. Squibb, H. Koch, and M. Gühr, Faraday Discussions 228, 555 (2021), publisher: The Royal Society of Chemistry.
- Dunning [1989] T. H. Dunning, The Journal of Chemical Physics 90, 1007 (1989), publisher: American Institute of Physics.
- Kendall et al. [1992] R. A. Kendall, T. H. Dunning, and R. J. Harrison, J. Chem. Phys. 96, 6796 (1992).
- Adamo and Barone [1999] C. Adamo and V. Barone, The Journal of Chemical Physics 110, 6158 (1999), publisher: American Institute of Physics.
- Srinivasan et al. [2003] R. Srinivasan, V. A. Lobastov, C.-Y. Ruan, and A. H. Zewail, Helvetica Chimica Acta 86, 1761 (2003), https://onlinelibrary.wiley.com/doi/pdf/10.1002/hlca.200390147 .
- Marshall et al. [1992] A. Marshall, A. Clark, R. Jennings, K. Ledingham, and R. Singhal, International Journal of Mass Spectrometry and Ion Processes 112, 273 (1992).
- Nagakura et al. [1964] S. Nagakura, M. Kojima, and Y. Maruyama, Journal of Molecular Spectroscopy 13, 174 (1964).
- Penfold et al. [2018] T. J. Penfold, E. Gindensperger, C. Daniel, and C. M. Marian, Chemical Reviews 118, 6975 (2018), pMID: 29558159, https://doi.org/10.1021/acs.chemrev.7b00617 .
- Cumpson and Seah [1992] P. J. Cumpson and M. P. Seah, Surface and Interface Analysis 18, 345 (1992), https://analyticalsciencejournals.onlinelibrary.wiley.com/doi/pdf/10.1002/sia.740180508 .
Supplemental Materials
VI Static Nitrobenzene Signal
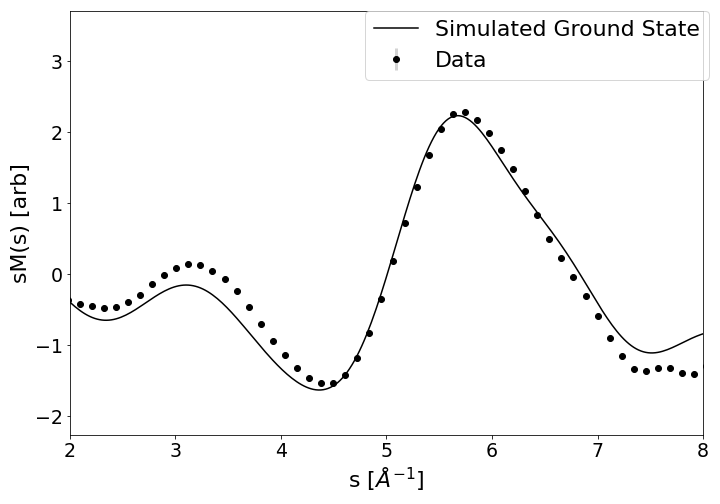
To validate the delivery of ground state nitrobenzene in the gas phase, we recorded static diffraction images taken without the 267 nm pump pulse. To remove the atomic scattering and contributions from the experimental response function we fit the measurement using the five expected zero-crossings, from simulation. These zero-crossings were found at 1.76, 4.99, 6.82, 9.01, and 11.74 Å-1. Each zero-crossing was fit with an exponential to guarantee that the signal at these points are equal to 0, as expected by the ground state simulation. After subtracting these exponentials, the results were fitted with the simulated ground state molecular diffraction signal (sM()). Figure S1 shows the delivered sample is in good agreement with ground state nitrobenzene and that the sample was not damaged upon delivery.
VII Rise Time Measurement
We isolate the temporal dynamics from the two-dimensional sM() by summing over . However, the sM() amplifies the signal at higher that suffers from poor signal-to-noise, while the raw diffraction intensity is dominated by low contributions. To account for the strong dependence in the raw diffraction intensity and weight data points based on their signal to noise, we normalize the sM() by its standard deviation .
| (S1) |
This temporal signal is shown as data points in Fig. 2b.
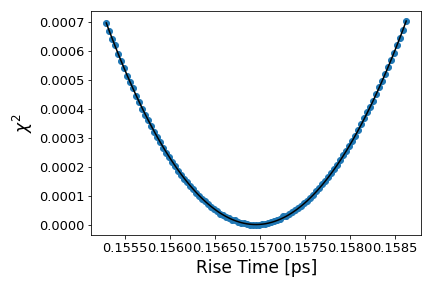
To retrieve the rise time, we fit to an error function. We simultaneously fit the mean, standard deviation, and amplitude of the Gaussian that is integrated within the error function. The rise time corresponds to the fitted standard deviation. To further resolve the optimal rise time and calculate its error, we fit the mean and amplitude of the error function while varying the standard deviation around the region of the first fit. This produces a quadratic distribution of values, shown in Fig S2, where the minimum corresponds to the optimal rise time and the width corresponds to its error [50]. We retrieved a rise time of fs.