Interfacial thermodynamics of spherical nanodroplets: Molecular understanding of surface tension via hydrogen bond network
Abstract
Surface tension plays a ubiquitous role in phase transitions including condensation or evaporation of atmospheric liquid droplets. Especially, understanding of interfacial thermodynamics of the critical nucleus of 1 nm scale is important for molecular characterization of the activation energy barrier of nucleation. Here, we investigate surface tension of spherical nanodroplets with both molecular dynamics and density functional theory, and find that surface tension decreases appreciably below 1 nm radius, whose analytic expression is consistently derived from the classic Tolman’s equation. In particular, the free energy analysis of nanodroplets shows that the change of surface tension originates dominantly from the configurational energy of interfacial molecules, which is evidenced by the increasingly disrupted hydrogen bond network as the droplet size decreases. Our result can be applied to the interface-related phenomena associated with molecular fluctuations such as biomolecule adsorption at sub-nm scale where the macroscopic thermodynamic quantities are ill-defined.
pacs:
Valid PACS appear hereNucleation of nanoscale water droplets in the atmospheric clouds is crucial for the control of earth climate Baker1997 ; Kulmala2004 . When homogeneous nucleation initiates with the formation of water nanodroplets from the supersaturated vapor, there exists the thermodynamic energy barrier formed by the difference between the favorable volume- and unfavorable surface-energy. The barrier height, which determines the nucleation rate of the condensed phase, is governed by the surface tension of the critical nucleus Kalikmanov2005 . The classical nucleation theory has employed the value of surface tension of planar interface in estimating the nucleation rate and has suffered from poor predictability, which is even orders of magnitude off from the experimental results of liquid droplets such as the simple liquid and water Oxtoby1988 ; Holten2005 ; Bruot2016 . Moreover, the surface energy model with the planar tension produces (i) inaccurate estimation of the solvation free energy of hydrophobic molecules Sedlmeier2012 and (ii) improper description of the heterogeneous nucleation processes of the concave nanodroplets formed between two hydrophilic surfaces Kwon2018 ; Kim2018 . Despite numerous theoretical Factorovich2014 ; Sampayo2010 ; Koga1998 ; Malijevsky2012 ; Rehner2018 and experimental Bruot2016 ; Kim2018 ; Kwon2018 studies performed for decades, determination of surface tension of the curved interface Bruot2016 ; Rowlinson1982 ; Joswiak2013 ; Azouzi2013 ; Wilhelmsen2015 ; Kwon2018 ; Kim2018-2 of the nucleus is still a topic of ongoing controversies. Therefore, quantitative and consistent study of surface tension of the highly curved liquid-vapor interface should be carried out for the fundamental understanding of the nucleation phenomena.
The first attempt to describe the curvature dependence of surface tension was made by the Tolman’s equation in 1949 Tolman1949 ,
| (1) |
where the constants and are the surface tension and Tolman length of the planar interface, respectively. Notice that is defined as the difference between two possible definitions of the nanodroplet radius, equimolar radius and the radius of surface of tension , when the nanodroplets become infinitely large; . Therefore, Tolman’s equation provides a general description of surface tension of nanodroplets in terms of only a ‘single’ parameter for a given . Theoretical studies suggest that the magnitude of the constant is comparable to the molecular diameter Rowlinson1982 , but there are still many debates concerning the magnitude and sign of . Moreover, despite substantial development of experimental methods Bruot2016 ; Kim2018 , there does not exist a consensus on either the value of nor the change of surface tension at the molecular scale because quantitative information of molecules in the nanodroplets still lacks, which may behave very differently from the planar case. Therefore, for a unified understanding of the molecular-scale surface tension and the nanoscale liquid-vapor interface, single-molecule study is on high demand, including the investigation of the free energy as well as hydrogen bond (HB) networks of individual molecules.
Here, we employ the molecular dynamics (MD) and density functional theory (DFT) to calculate the surface tension of liquid nanodroplet from the pressure profile and the thermodynamic free energy. We find curvature dependence of surface tension below 1 nm radius and derive analytic expression from the classic Tolman’s equation combined with the radius-dependent Tolman length Tolman1949 . The derived analytic expression predicts surface tension within the error below 1. Moreover, to describe the origin of the change of surface tension in the nanoscale droplet, we use the statistical analysis of individual molecules that provides the free energy of nanodroplets and also use the HB network analysis with graph theory approach. They show that surface tension is governed by the energy change of interfacial molecules, associated with the disruption of the HB network.
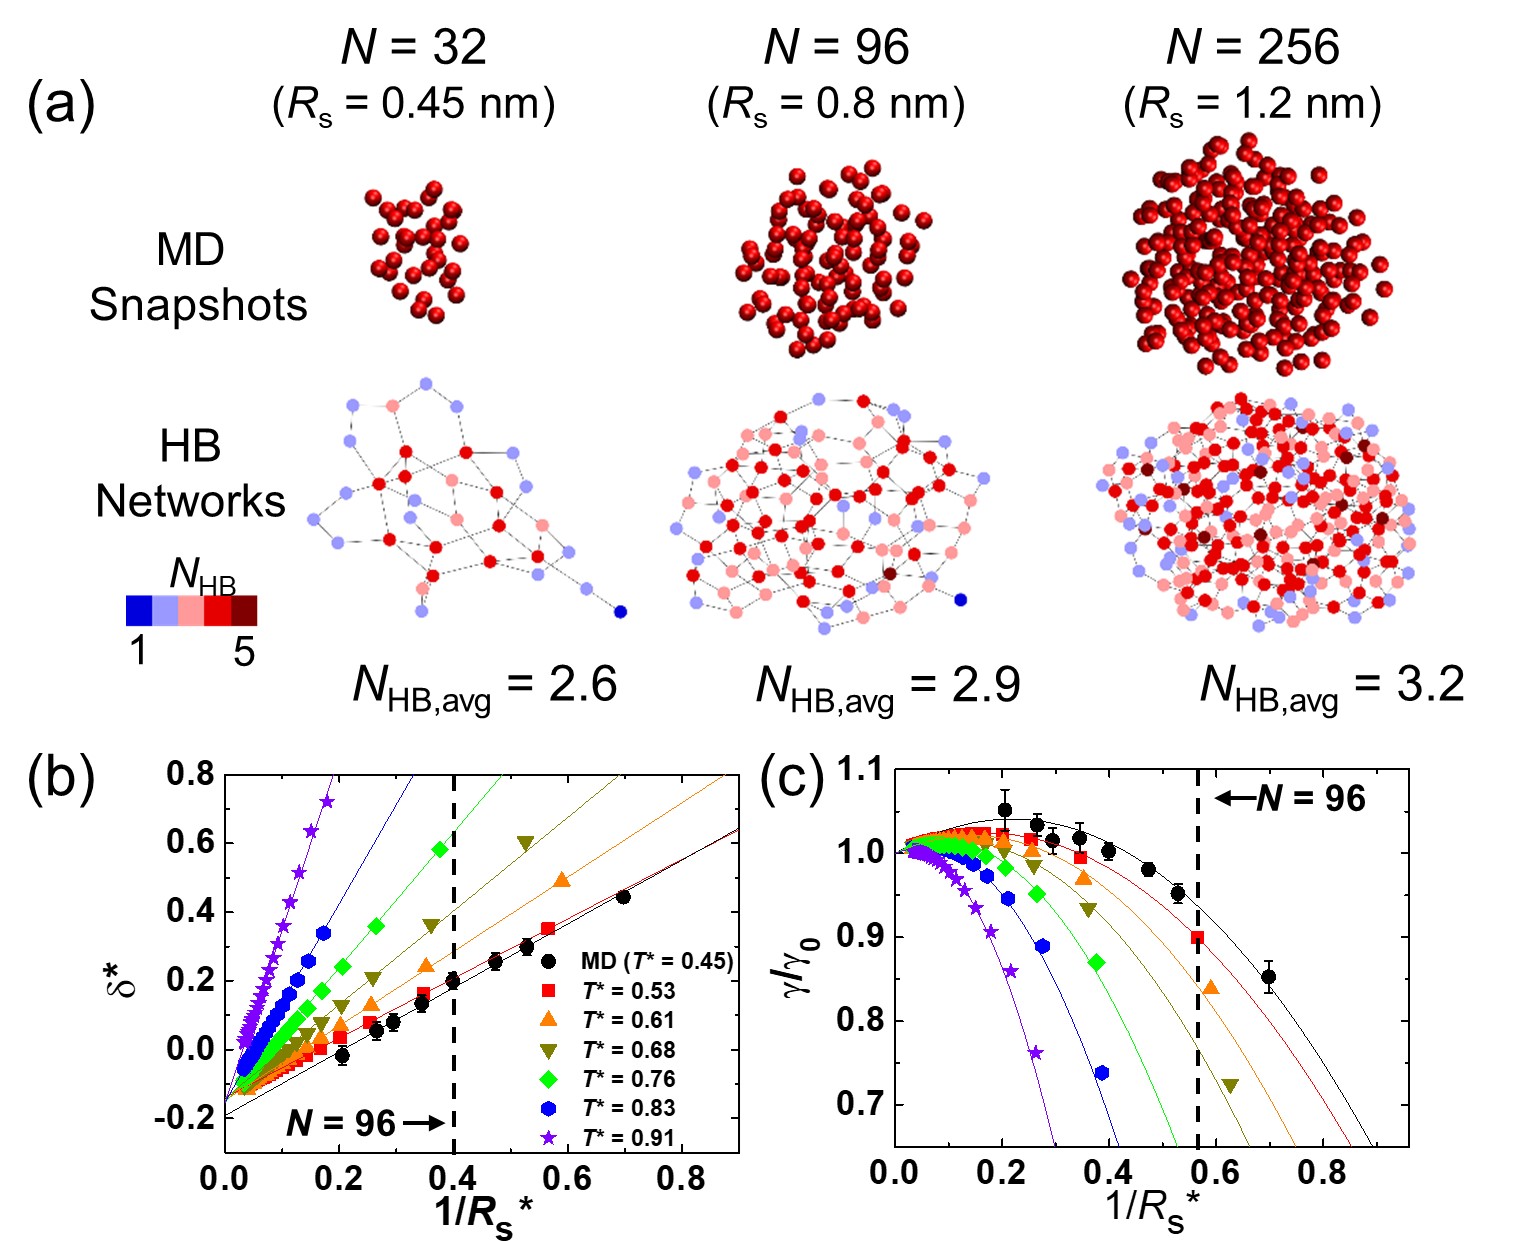
Figure 1(a) summarizes the main results of our work. The MD snapshots of nanodroplets for , 96 and 256 water molecules (or equivalently , 0.8 and 1.2 are provided in the top row. The bottom row shows the network representations of the snapshots. The points (nodes) and lines (edges) of the HB network correspond to the water molecules and HBs, respectively. The strength of the interaction is qualitatively represented by the number of HB, , which is reflected by the color of the nodes. The color distributions in the networks and the average values of the HB number, , demonstrate that the overall interaction strength, which is directly related to the surface tension of nanodroplets, decreases considerably when .
To study nanodroplet systems, we have performed the MD simulation of the TIP4P/2005 water model and the DFT calculation of the Lennard-Jones liquid (refer to Supplementary Information for detailed information about MD and DFT). In the MD simulation, the number of water molecules ranges from to 512 at = 290 K. In DFT, we deal with nanodroplets with a radius of to 30 at the temperature to 0.91. We chose the smallest radius of droplet in DFT as the lower size limit without thermal instability. In our simulations, the reduced units are employed: , , , and , where is the diameter of the liquid molecule and is the critical temperature of the liquid. For the TIP4P/2005 water model Vega2006 , we used K and nm.
Let us first calculate the theoretical values of the Tolman length, , which are presented in Fig. 1(b) as a function of the inverse radius of the surface of tension, (definitions of and are summarized in Supplementary Information). For the curvature dependence, we have adopted (and justified later) the ansatz in the linear form, , which fits well with the MD and DFT resultsBruot2016 ; Block2010 . The resulting numerical values of the coefficients and are listed in Table 1. Interestingly, at = 0.45 (water droplet), the sign of the Tolman length changes from negative to positive at , which marks the region where surface tension begins to decrease. Notice that the Tolman length we find for the planar interface of water is , which is consistent with the previous theoretical and experimental resultsWilhelmsen2015 ; Azouzi2013 ; Joswiak2013 .
| (DFT) | |||
| 0.53 | -0.139 | 0.865 | -0.807 |
| 0.61 | -0.147 | 1.082 | -0.717 |
| 0.68 | -0.141 | 1.261 | -0.501 |
| 0.76 | -0.165 | 1.965 | -0.382 |
| 0.83 | -0.164 | 2.886 | -0.285 |
| 0.91 | -0.155 | 5.040 | -0.197 |
| (MD) | |||
| 290 K | -0.59 () | 9.27 () | -1.34 () |
Using the simulation results of and presented in Fig. 1(b) and Table 1, we now can derive the analytic governing equation of surface tension from the rigorous Gibbs-Tolman-Koenig-Buff (GTKB) equation Gibbs1906 ; Koenig1950 ; Buff1951 ; Rowlinson1982 ,
| (2) |
Here we have used the series expansion using the ansatz and thus the resulting equation can be written as, up to the second order of ,
| (3) |
Equation (3) is our analytic result and is expected to be more exact compared to Eq. (1) since the curvature dependent Tolman length is considered. To demonstrate the validity of Eq. (3), we compare it with the surface tension directly calculated from MD and DFT results without the ansatz (Fig. 1(c)). The surface tension of the TIP4P/2005 water droplet is computed from the difference between the normal and transverse pressure tensorsGhoufi2011 . Surface tension of Lennard-Jones liquid droplet is calculated from the grand potential energy of the system (refer to Supplementary Information for detailed information). As shown in Fig. 1(c), Eq. (3) predicts excellently the surface tension of nanodroplets down to the smallest radius we consider, for water. We estimate the accuracy of Eq. (3), for example, at of Lennard-Jones droplet; Eq. (3) shows an error within 0.5 until the lower size limit of nanodroplet, while the error jumps over 10 without the second order term (Supplementary Fig. 1). The observed Tolman length and surface tension equation with second order correction agrees well with the recent results of Rehner and GrossRehner2018 . Our study shows that the Tolman length approach can be applied to the hydrogen-bond liquid with strong directional bond, and also the second-order correction is good for describing surface tension of 1 nm nanodroplet.
Interestingly, the second-order term in Eq. (3) is closely related to the bending rigidityHelfrich1973 , which is typically used as an empirical parameter to describe the free energy of the curved membrane. The bending rigidity, , can be related to the Tolman length as Helfrich1973 . For water nanodroplets, we find the negative rigidity as shown in Table 1, , which is comparable to the MD result Sedlmeier2012 , , that considered the interface between hydrophobic solute and water. Here, the negative sign of bending rigidity is the general feature of the liquid nanodroplet of water, Lennard-Jones liquid, and polymeric liquid Rehner2018 .
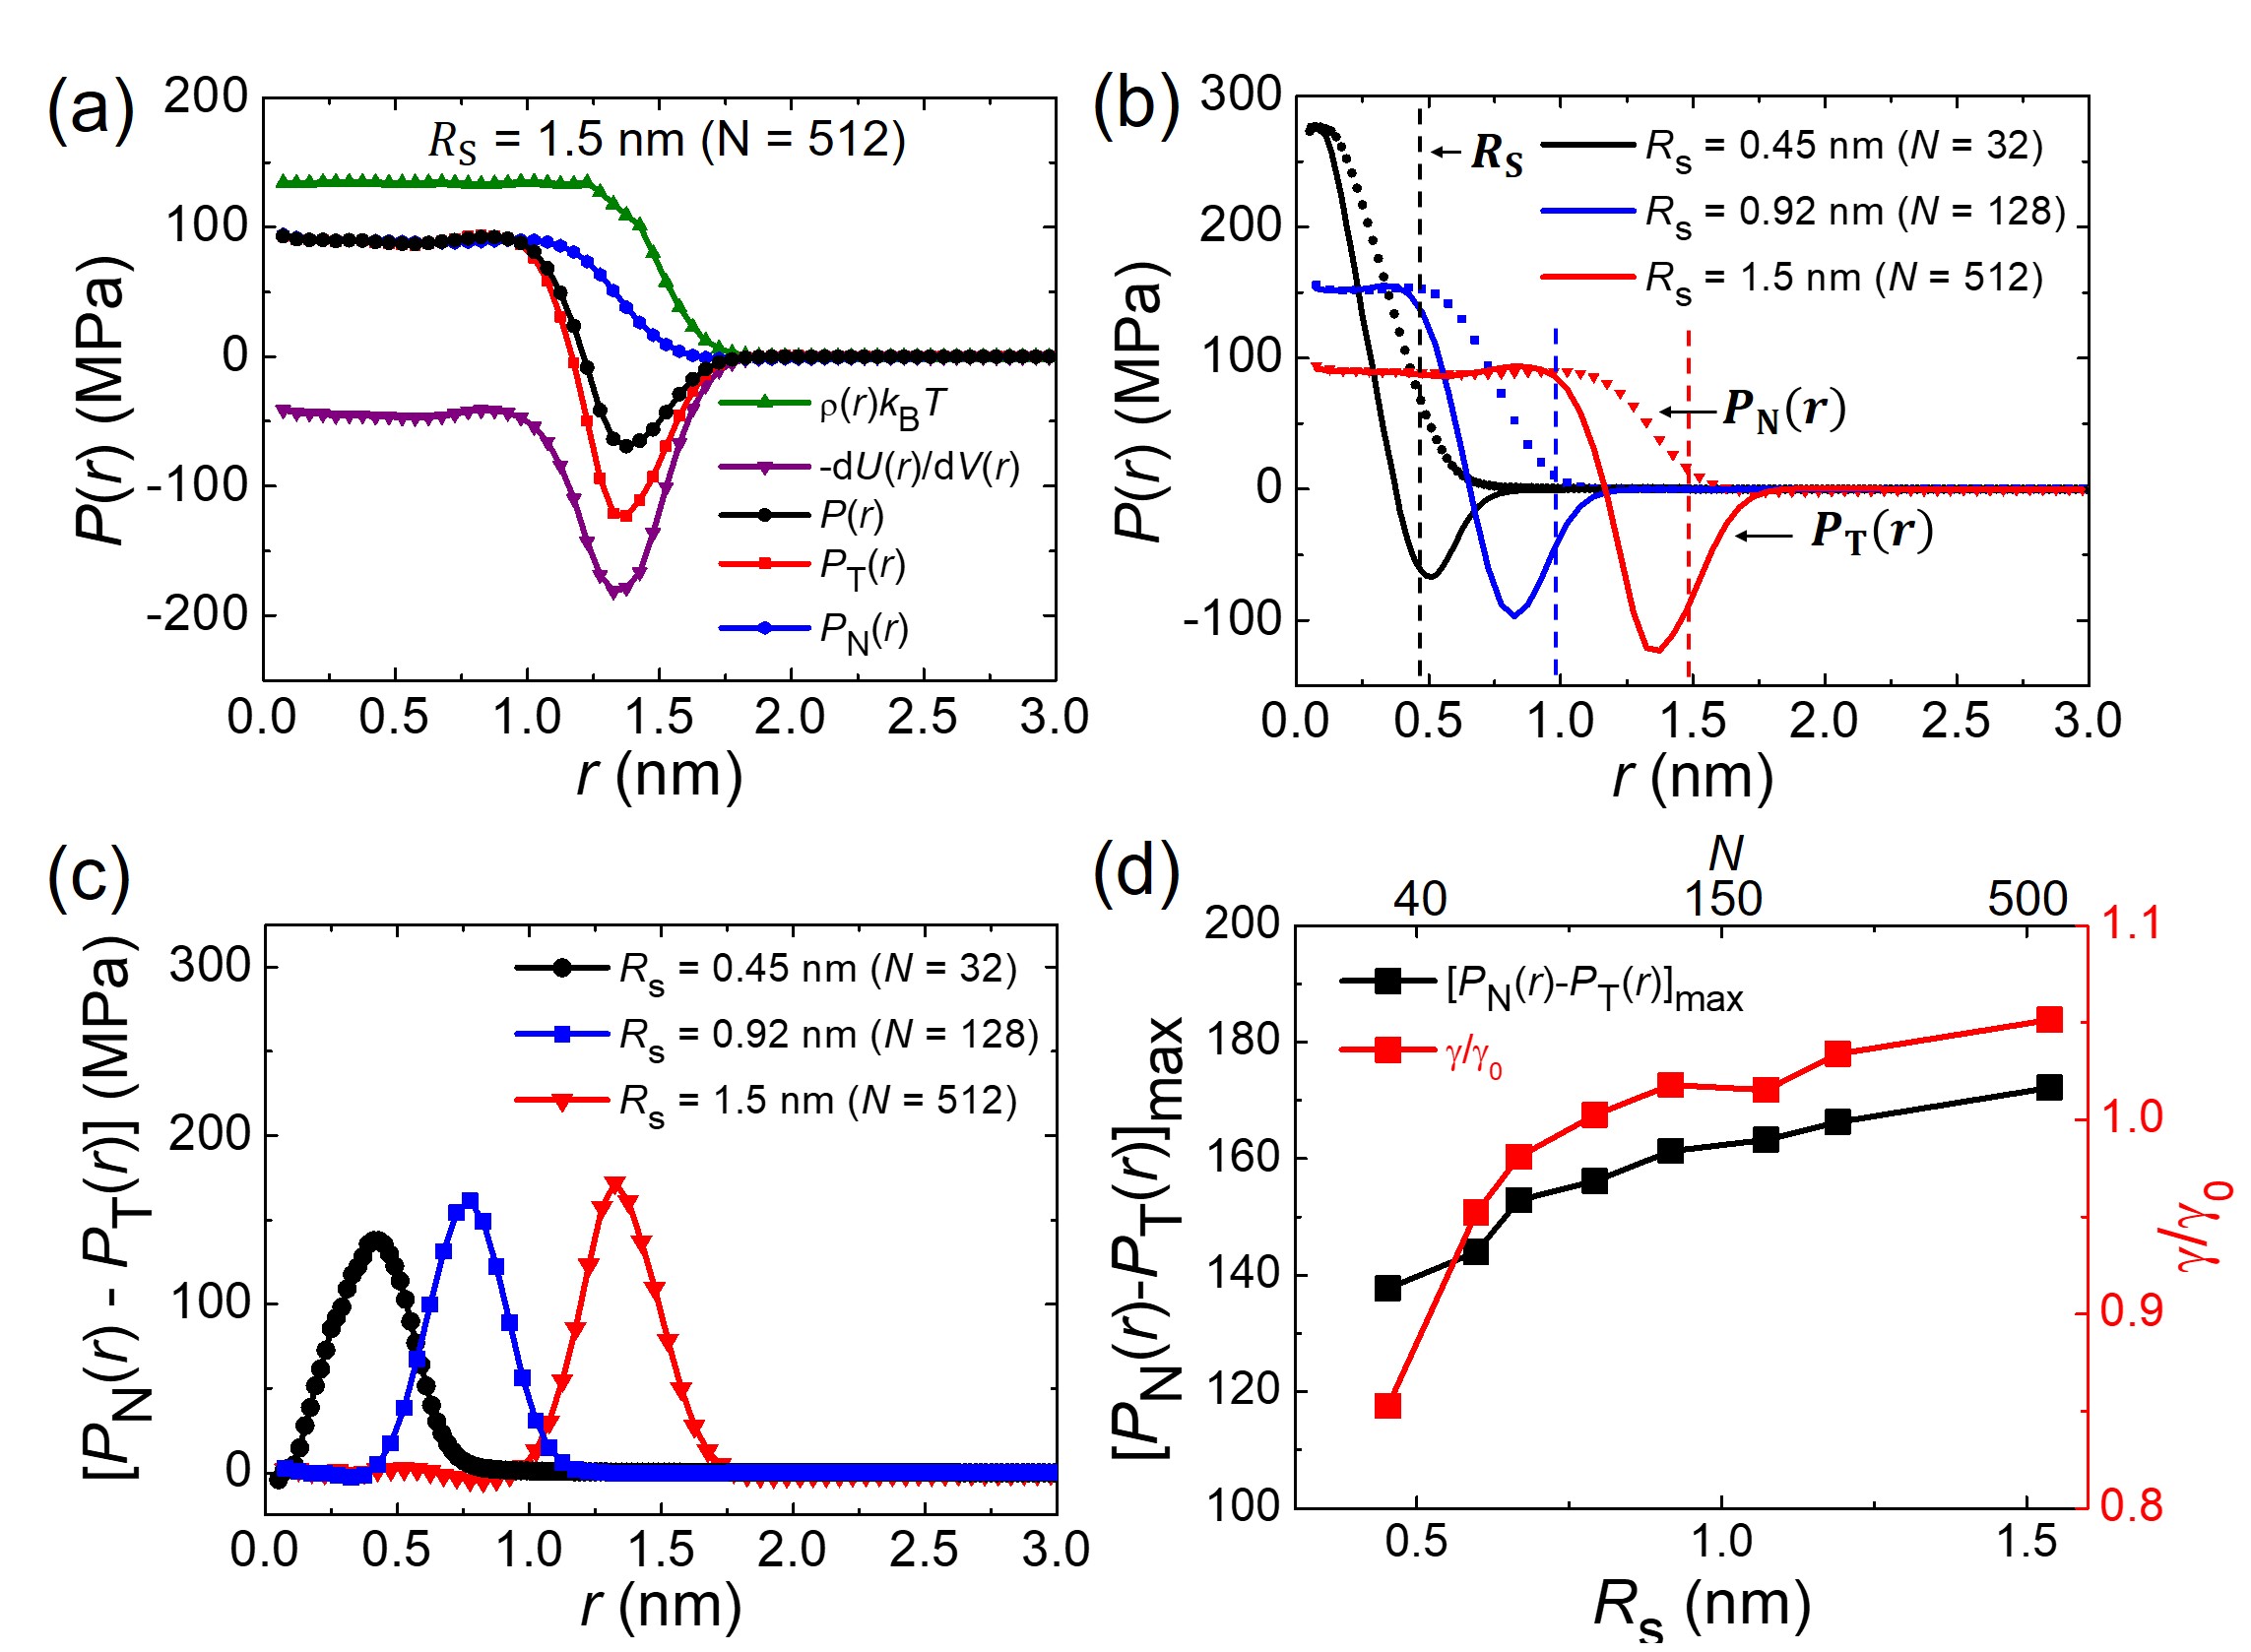
Let us now elucidate the physical origin of the smaller surface tension with respect to the planar interface from three perspectives; (i) pressure tensor, (ii) free energy, and (iii) HB network. First, we calculate the radial pressure tensor of molecules, , which comes from the sum of kinetic pressure, , obtained from radial density and configurational pressure, , obtained from potential energy difference induced by volume perturbation (refer to Supplementary Information for detailed derivation). We decompose into the transverse () and normal () profiles under the hydrostatic equilibrium condition () and the boundary condition (). At the interface of = 1.5 nm droplet (Fig. 2(a)), deviates from and shows a negative minimum, which indicates the origin of surface tension from the imbalanced interaction of the interfacial molecules. Notice that the values of negative minimum (Fig. 2(b)) and pressure imbalance (Fig. 2(c)) decrease as the droplet radius decreases, which shows that the interaction between interfacial molecules weakens accordingly and is responsible for the curvature dependence of surface tension. As expected, a direct comparison between surface tension and pressure imbalance (Fig. 2(d)) evidences the relationship between the two.
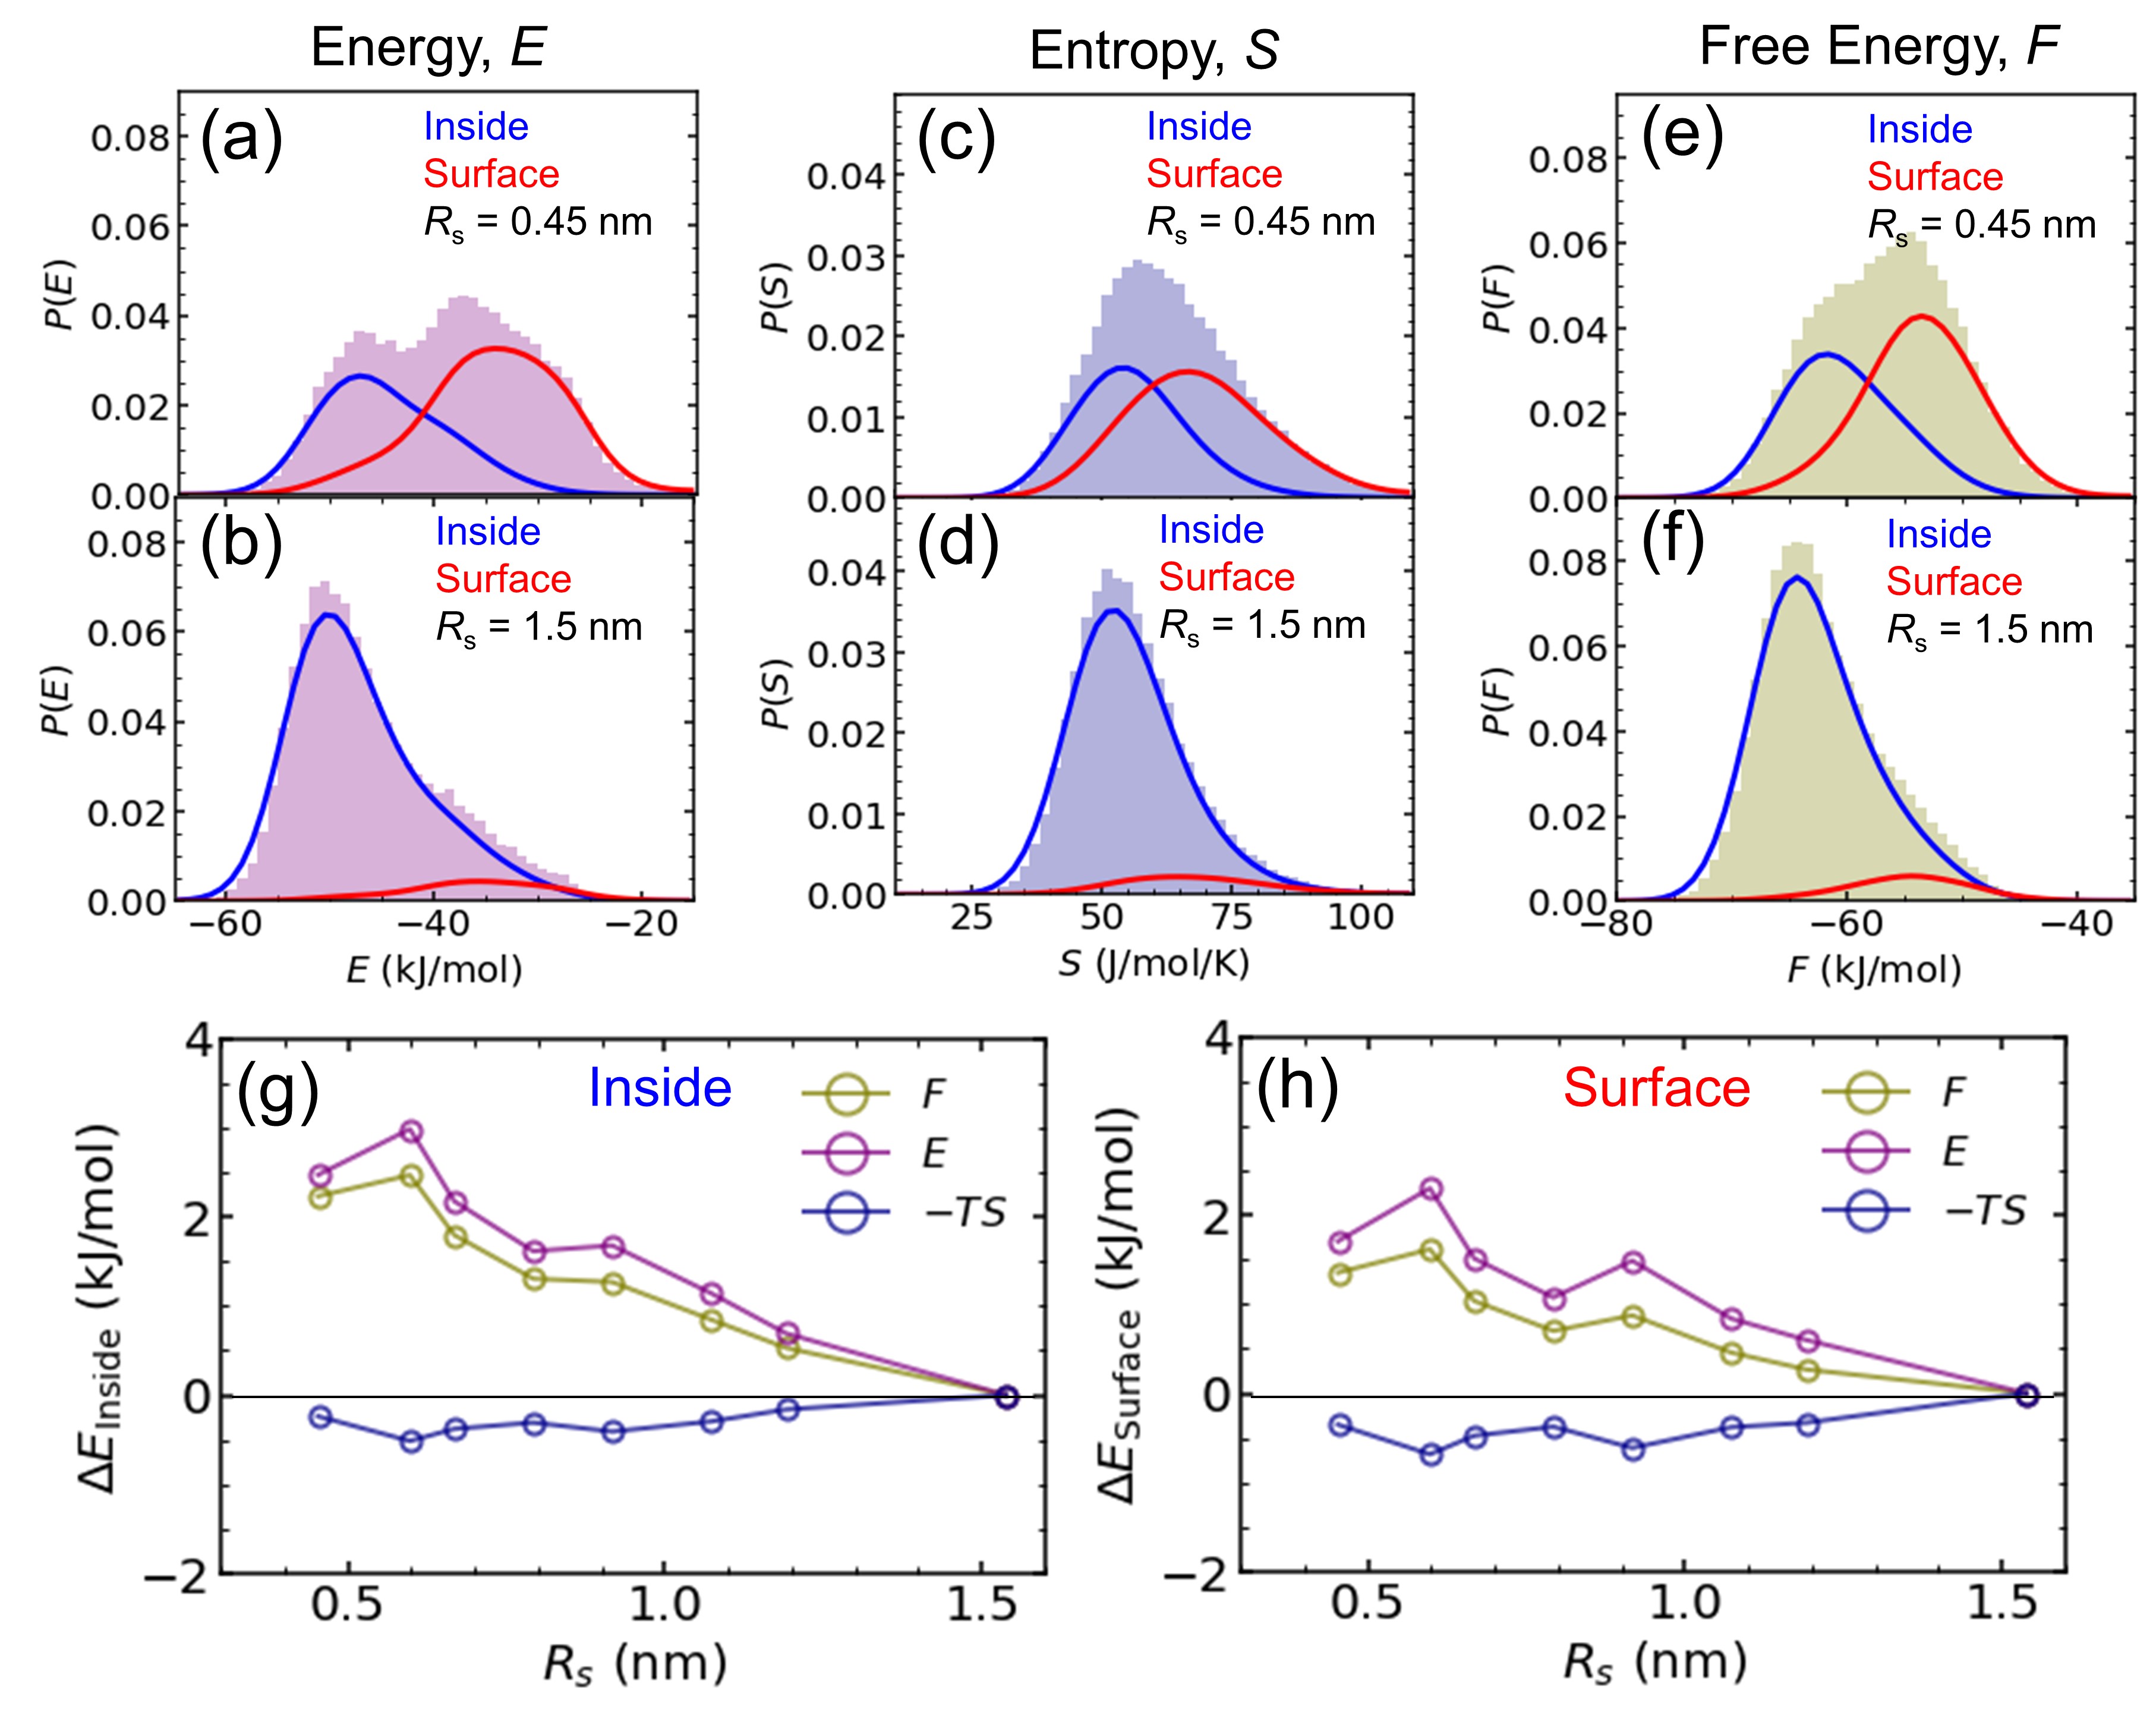
Second, we investigate the physical mechanism with regard to interfacial thermodynamics at the molecular level. For this purpose, we compute the energy (), entropy (), and Helmholtz free energy () of nanodroplets (Fig. 3). Entropy is derived from the integration of the density of states of molecules, which are obtained via the Fourier transform of the velocity autocorrelation function. Formalism is established by the two-phase thermodynamics (2PT) model in calculating the entropy of liquid molecules Huang2011 (refer to Supplementary Information for detailed information). Helmholtz free energy is calculated by the relation . Figures 3(a) - (f) show the probability distributions of , , and for the droplets of = 0.45 nm and 1.5 nm. By dividing two regions across , each nanodroplet is well separated into the ‘inside’ region having low energy and low entropy, and the ‘surface’ region with high energy and high entropy. Figures 3(g) and (h) compile all the thermodynamic quantities of water molecules in the inside and surface region as a function of nanodroplet radius, respectively. For example, the average Helmholtz free energy of the surface molecules for = 0.45 nm is about 2 kJ/mol higher than that of = 1.5 nm, which evidences that the change of surface tension is associated with the decrease of intermolecular interaction strength of nanodroplets. Notice that the free energy change is dominated by the energy, which compensates for the entropy change that behaves oppositely.
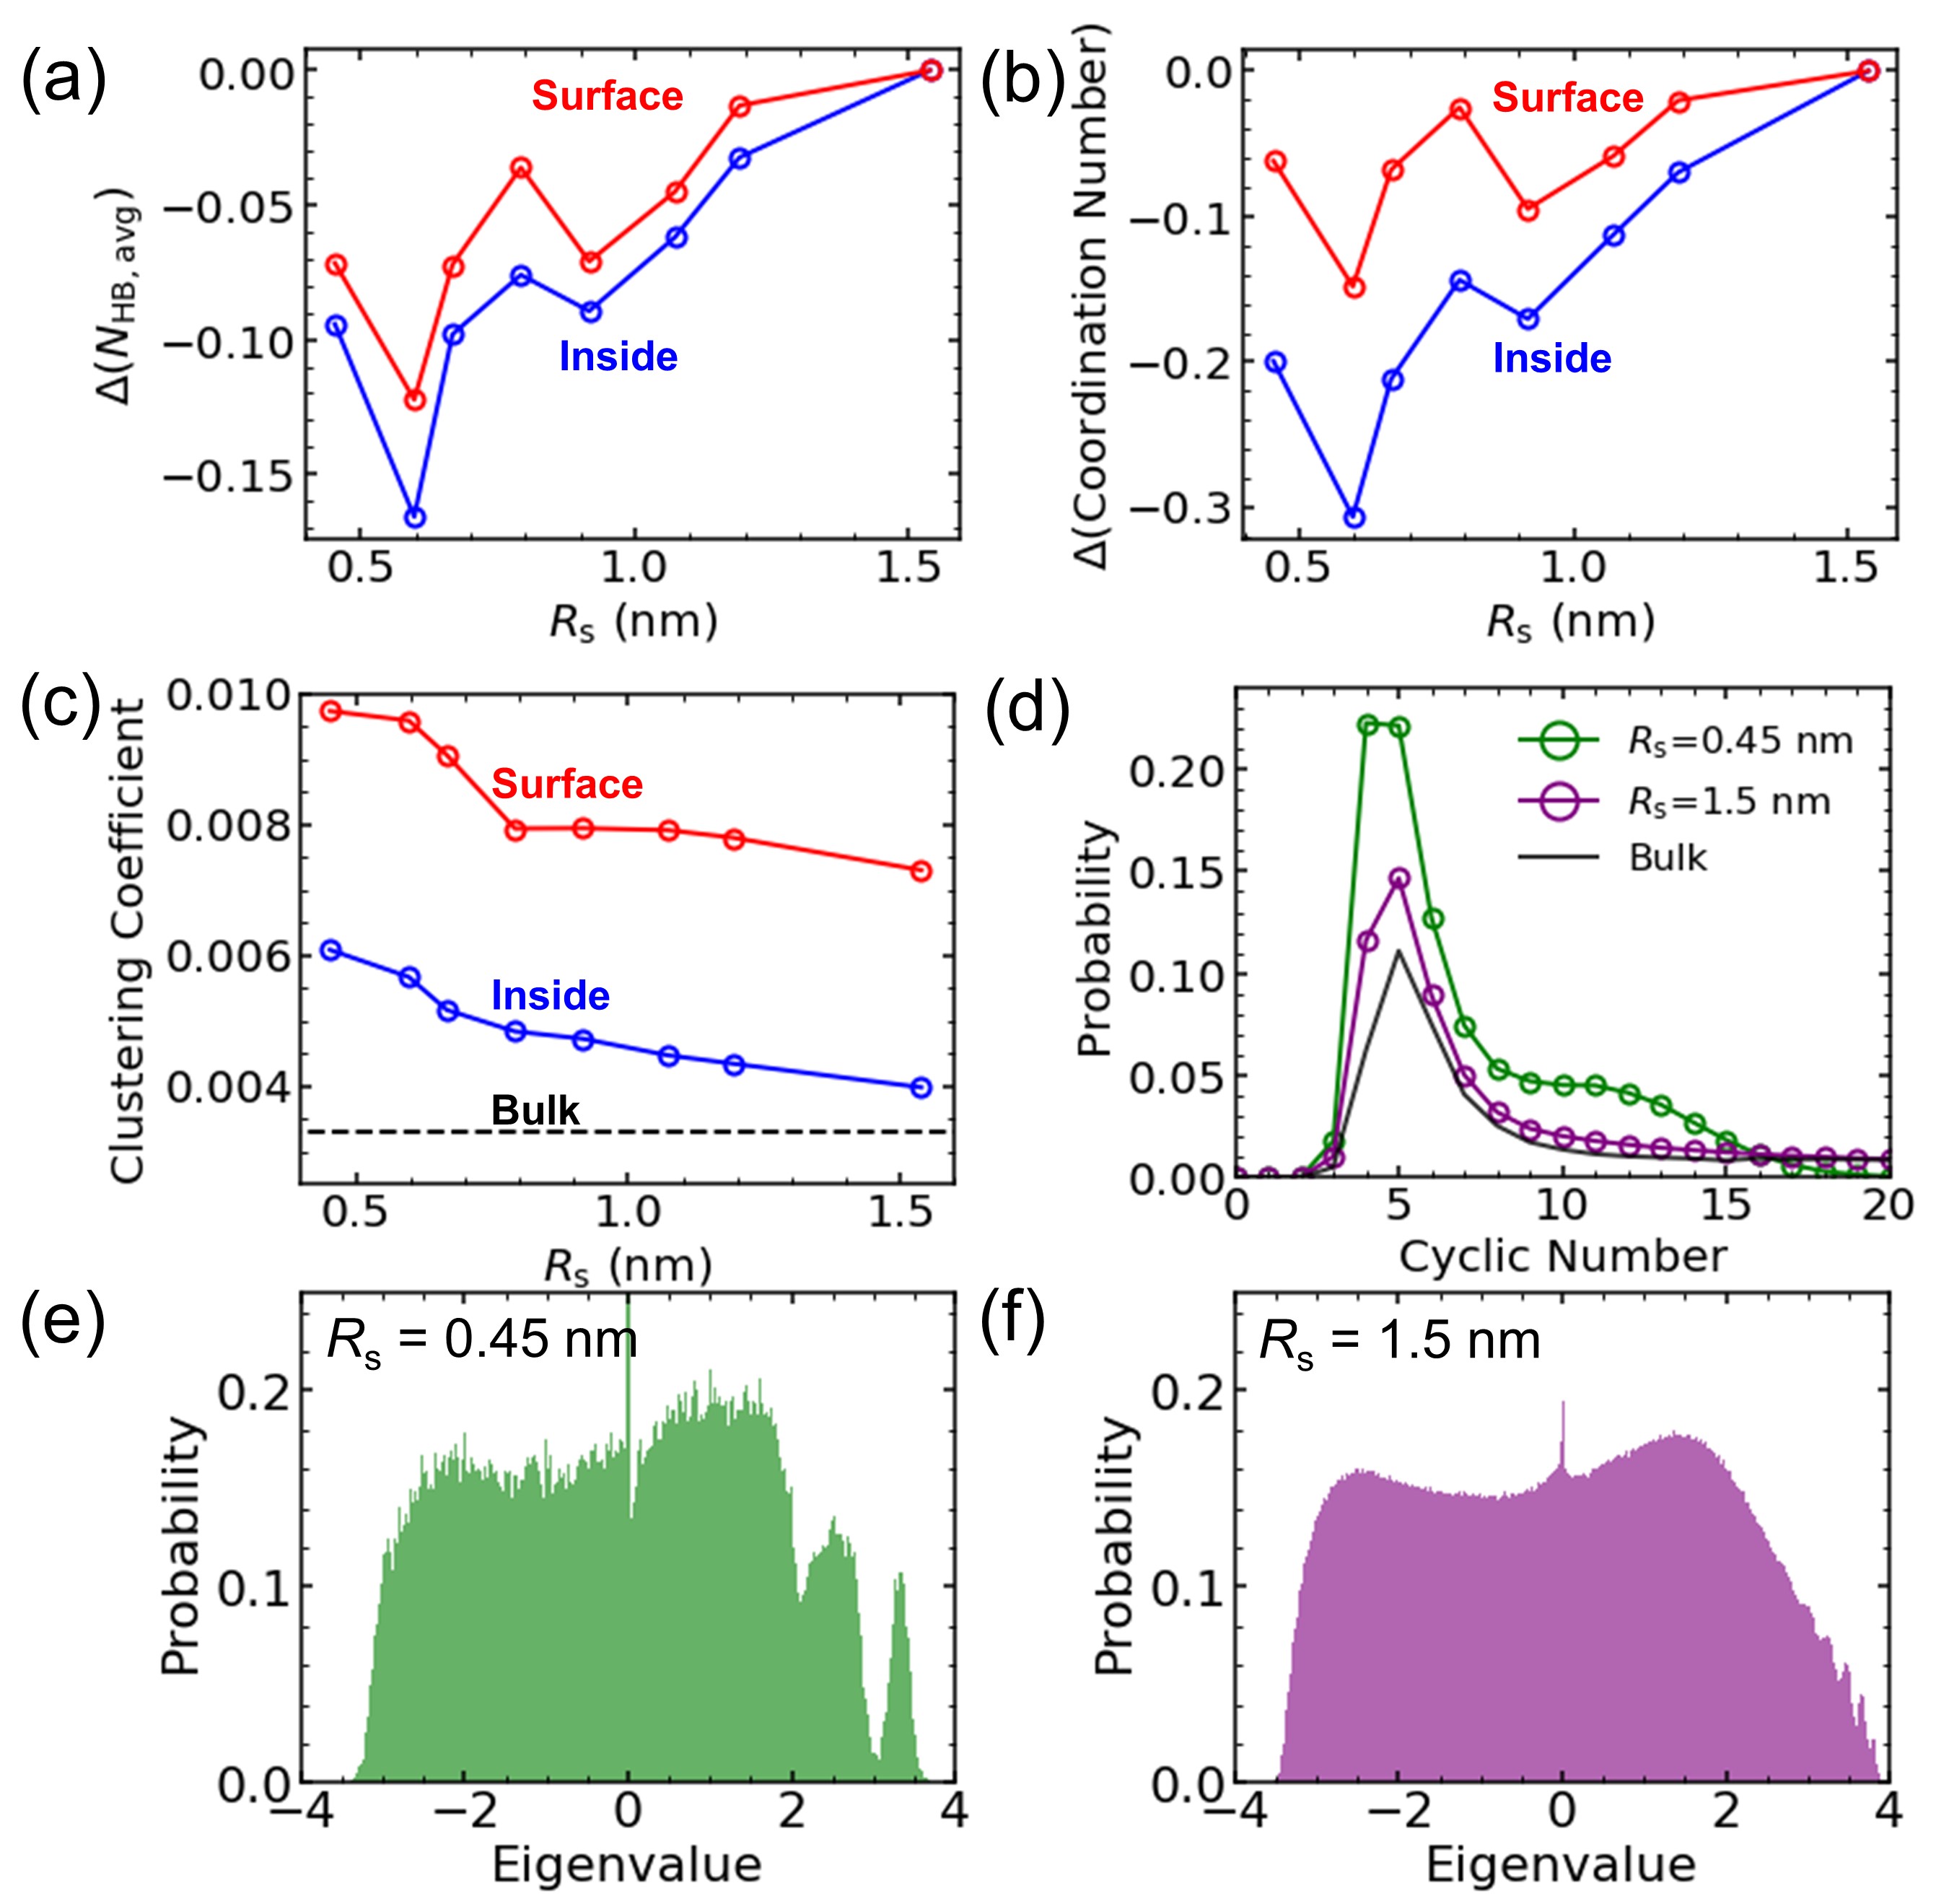
Lastly, we address the molecular description in terms of the relation between the configurational energy change of nanodroplets and the change of HB network characteristics (refer to Supplementary Information for detailed information). Two water molecules are considered to be connected via HB when (i) the distance between two oxygen atoms is smaller than 0.35 nm and (ii) the angle between hydrogen and donor-acceptor oxygen atoms is smaller than Kumar2007 . We represent the HB network of nanodroplets by the adjacency matrix , which is a square symmetric matrix with elements of 1 if the molecular pair has an HB, and 0 if otherwise. Figure 4(a) shows the change of average number of HB, , for the inside as well as the surface molecules in comparison to of = 1.5 nm nanodroplet. We find that the smaller nanodroplets have relatively smaller , which is already expected by Figs. 3(g) and (h). The disruption of the HB network shown in Fig. 4(a) can be explained by the decreasing coordination number (Fig. 4(b)). Notice that these results are independent of the choice of radius, which is still observed even if is used instead of (Supplementary Fig. 2). The overall change of the HB network characteristics can be observed by the clustering coefficient and cyclic number distribution of the network presented in Figs. 4(c) and (d), respectively. The clustering coefficient of the HB network is defined as the probability that the two hydrogen-bonded neighboring molecules are connected via the HB and form a triangular network. The cyclic number is defined as the number of edges connected in a closed HB loop in a network. As shown, the nanodroplet network has a larger average clustering coefficient and a smaller average cyclic number than the bulk water network, which demonstrates that the nanodroplets are more structured than the bulk water, and their structure is similar to that of the high-density water or Ice-VII Shin2019 . Moreover, from the eigenvalue spectra of (Figs. 4(e) and (f)), one can observe that the change of network structure is concentrated in the local network topology with large eigenvalue of (or large number of HB), which shows that the disruptions of HB networks are focused on the four or five HBs. Because of the large energy content of water HB, disruption of the HB network directly leads to the increase of free energy and the resulting decrease of surface tension.
As a conclusion, we emphasize that the above three perspectives provide the unified understanding of the decreasing surface tension in terms of the decrease of interaction strength (Fig. 2), an increase of energy (Fig. 3) and the decrease of HB number as well as the change of HB network structure (Fig. 4) in the molecular-scale nanodroplets. In particular, the large HB energy of water (i) compensates the entropy change and (ii) dominates the change of Helmholtz free energy and the change of pressure imbalance.
In summary, we have demonstrated the curvature dependence of surface tension from the perspectives of interfacial thermodynamics using the complementary methods of MD and DFT simulations. We show that the surface tension is a decreasing function of the inverse radius of nanodroplets with the positive Tolman length. Statistical analysis of the Helmholtz free energy of individual water molecules shows that the change of surface tension is governed by the surface molecules having higher free energy than that of the planar interface, which is closely related to the disruption of the HB network at the interface. Our results may trigger further theoretical development for an accurate understanding of the nucleation of nanoclusters at the molecular level. Moreover, the thermodynamic approach presented here can be used to study the chemically heterogenous interface where the local energy varies at the nanoscale.
Acknowledgements
The authors are grateful to Dr. Fang Gu for introduction of the DFT formalism of the Lennard-Jones liquid. This work was supported by the National Research Foundation of Korea (NRF) grant funded by the Korea Government (MSIP) (No. 2016R1A3B1908660).
References
- (1) M. Baker, Cloud microphysics and climate, Science 276, 1072-1078 (1997).
- (2) M. Kulmala, H. Vehkamäki, T. Petäjä, M. Dal Maso, A. Lauri, V. -M. Kerminen, W. Birmili, and P. H. McMurry, Formation and growth rates of ultrafine atmospheric particles: a review of observations, J. Aerosol Sci. 35, 143-176 (2004).
- (3) V. Kalikmanov, Nucleation Theory (Spinger Netherlands, 2013).
- (4) N. Bruot, and F. Caupin, Curvature dependence of the liquid-vapor surface tension beyond the Tolman approximation, Phys. Rev. Lett. 116, 056102 (2016).
- (5) D. W. Oxtoby, Nonclassical nucleation theory for the gas-liquid transition, J. Chem. Phys. 89, 7521 (1988).
- (6) V. Holten, D. G. Labetski, and M. E. H. van Dongen, Homogeneous nucleation of water between 200 and 240 K: New wave tube data and estimation of the Tolman length, J. Chem. Phys. 123, 104505 (2005).
- (7) F. Sedlmeier, and R. R. Netz, The spontaneous curvature of the water-hydrophobe interface, J. Chem. Phys. 137, 135102 (2012).
- (8) S. Kim, D. Kim, J. Kim, S. An, and W. Jhe, Direct evidence for curvature-dependent surface tension in capillary condensation: Kelvin equation at molecular scale, Phys. Rev. X 8, 041046 (2018).
- (9) S. Kwon, B. Kim, S. An, W. Lee, H. Kwak, and W. Jhe, Adhesive force measurement of steady-state water nano-meniscus: Effective surface tension at nanoscale, Sci. Rep 8, 8462 (2018).
- (10) M. H. Factorovich, V. Molinero, and D. A. Scherlis, Vapor pressure of water nanodroplets, J. Am. Chem. Soc. 136, 4508-4514 (2014).
- (11) J. G. Sampayo, A. Malijevsky, E. A. Muller, E. de Miguel, and G. Jackson, Communications: Evidence for the role of fluctuations in the thermodynamics of nanoscale drops and the implications in computations of the surface tension, J. Chem. Phys. 132, 141101 (2010).
- (12) K. Koga, X. C. Zeng, and A. K. Shchekin, Validity of Tolman’s equation: How large should a droplet be? J. Chem. Phys. 109, 4063 (1998).
- (13) A. Malijevsky, and G. Jackson, A perspective on the interfacial properties of nanoscopic liquid drops, J. Phys.: Condens. Matter 24, 464121 (2012).
- (14) P. Rehner and J. Gross, Surface tension of dropelts and Tolman lengths of real substances and mixtures from density functional theory, J. Chem. Phys. 148, 164703 (2018).
- (15) J. S. Rowlinson, and B. Widom, Molecular theory of capillarity. (Clarendon Press, 1982).
- (16) O. Wilhelmsen, D. Bedeaux, and D. Reguera, Communication: Tolman length and rigidity constants of water and their role in nucleation, J. Chem. Phys. 142, 171103 (2015).
- (17) M. E. M. Azouzi, C. Ramboz, J. F. Lenain, and F. Caupin, A coherent picture of water at extreme negative pressure, Nat. Phys. 9, 38-41 (2013).
- (18) Q. Kim, D. Shin, J. Park, D. A. Weitz, and W. Jhe, Initial growth dynamics of 10 nm nanobubbles in the graphene liquid cell, Appl. Nanosci. https://doi.org/10.1007/s13204-018-0925-3 (2018).
- (19) M. N. Joswiak, N. Duff, M. F. Doherty, and B. Peters, Size-dependent surface free energy and Tolman-corrected droplet nucleation of TIP4P/2005 water, J. Phys. Chem. Lett. 4, 4267-4272 (2013).
- (20) R. C. Tolman, The effect of droplet size on surface tension, J. Chem. Phys. 17, 333 (1949).
- (21) C. Vega, J. L. F. Abascal, and I. Nezbeda, Vapor-liquid equilibria from the triple point up to the critical point for the new generation of TIP4P-like models: TIP4P/Ew, TIP4P/2005, and TIP4P/ice, J. Chem. Phys. 124, 074507 (2006).
- (22) B. J. Block, S. K. Das, M. Oettel, P. Virnau, and K. Binder, Curvature dependence of surface free energy of liquid drops and bubbles: A simulation study, J. Chem. Phys. 133, 154702 (2010).
- (23) J. W. Gibbs, H. A. Bumstead, and R. G. van Name, Scientific Papers of J. Willard Gibbs: Thermodynamics (Longmans and Green, New York).
- (24) F. O. Koenig, On the thermodynamic relation between surface tension and curvature, J. Chem. Phys. 18, 449 (1950).
- (25) F. P. Buff, The spherical interface. I. Thermodynamics, J. Chem. Phys. 19, 1591 (1951).
- (26) A. Ghoufi, and P. Malfreyt, Local pressure components and surface tension of spherical interfaces. Thermodynamic versus mechanical definitions. I. A mesoscale modeling of droplets, J. Chem. Phys. 135, 104105 (2011).
- (27) W. Helfrich, Elastic properties of lipid bilayers: theory and possible experiments, Z. Naturforsch. C 28, (1973).
- (28) S. N. Huang, T. A. Pascal, W. A. Goddard, P. K. Maiti, and S. T. Lin, Absolute entropy and energy of carbon dioxide using the two-phase thermodynamic model, J. Chem. Theory Comput. 115, 14190-14195 (2011).
- (29) R. Kumar, J. R. Schmidt, J. L. Skinner, Hydrogen bonding definitions and dynamics in liquid water. J. Chem. Phys. 126, 204107 (2007).
- (30) D. Shin, J. Hwang, and W. Jhe, Ice-VII-like molecular structure of ambient water nanomeniscus, Nat. Comm. 10, 286 (2019).