Insights into the structural symmetry of single-crystal YCrO3 from
synchrotron X-ray diffraction
Abstract
We report on the crystallographic information such as lattice parameters, atomic positions, bond lengths and angles, and local crystalline distortion size and mode of single-crystal YCrO3 compound by a high-resolution synchrotron X-ray diffraction study. The data was collected at 120 K (below 141.5 K), 300 K (within [, ]), and 500 K (above 473 K). Taking advantages of high intensity and brilliance of synchrotron X-rays, we are able to refine collected patterns with the noncentrosymmetric monoclinic structural model (, No. 4) that was proposed previously but detailed structural parameters have not determined yet. Meanwhile, we calculated patterns with the centrosymmetric orthorhombic space group (Pmnb, No. 62) for a controlled study. Lattice constants a, b, and c as well as unit-cell volume almost increase linearly upon warming. We observed more dispersive distributions of bond length and angle and local distortion strength with the space group. This indicates that (i) The local distortion mode of Cr2O6 at 120 K correlates the formation of the canted antiferromagnetic order by Cr1-Cr2 spin interactions mainly through intermediate of O3 and O4 ions. (ii) The strain-balanced Cr1-O3(O4) and Cr2-O5(O5) bonds as well as the local distortion modes of Cr1O6 and Cr2O6 octohedra at 300 K may be a microscopic origin of the previously-reported dielectric anomaly. Our study demonstrates that local crystalline distortion is a key factor for the formation of ferroelectric order and provides a complete set of crystallography for a full understanding of the interesting magnetic and quasi-ferroelectric properties of YCrO3 compound.
keywords:
Ferroelectrics , Orthochromates , Single crystal , Synchrotron X-ray diffraction , Crystal symmetry[1]organization=Joint Key Laboratory of the Ministry of Education, Institute of Applied Physics and Materials Engineering, University of Macau, addressline=Avenida da Universidade, Taipa, city=Macao SAR, postcode=999078, country=China \affiliation[2]organization=State Key Laboratory of High Performance Ceramics and Superfine Microstructure, Shanghai Institute of Ceramics, Chinese Academy of Science, city=Shanghai, postcode=200050, country=China \affiliation[3]organization=Guangdong–Hong Kong–Macao Joint Laboratory for Neutron Scattering Science and Technology, addressline=No. 1. Zhongziyuan Road, Dalang, city=DongGuan, postcode=523803, country=China
1 Introduction
Biferroic materials, simultaneously accommodating both ferromagnetic and ferroelectric orders, are of particular interest due to potential couplings between the degrees of freedom as well as the resulting multiple applications [1, 2, 3, 4]. Meanwhile, there exist great challenges for completely solving the actual crystalline structure toward a full understanding of the microscopic mechanisms of interesting macroscopic properties [5, 6, 7, 8, 9, 10]. Theoretically, ferromagnetism and ferroelectricity appear to be mutually repulsion in oxides with perovskite-type structure [1, 2]. Therefore, such materials holding both ferromagnetic and ferroelectric degrees of freedom are few [3]. There exist many unsolved problems and reported controversies, for example, the disharmony between reported centrosymmetric structural model and appearance of ferroelectricity [5, 6, 7, 8, 9, 10]. As a consequence, to date, there is still subject of numerous experimental and theoretical studies [3, 4, 9, 10, 11, 12, 13, 14, 15, 16, 17, 18].
The system of RECrO3 (RE = rare earth) orthochromates has been attracting lots of attention. So far, their crystalline structure has been assigned as an orthorhombic one with centrosymmetric space group that holds an inversion charge center and cannot account for the appearance of ferroelectricity [19, 20, 21]. Among RECrO3 orthochromates, the YCrO3 compound was believed to be a biferroic material displaying simultaneously weak ferromagnetism below 140 K and ferroelectric-like behaviors below 473 K [22], together with potentials as catalyst [23], negative-temperature-coefficient thermistor [24], solid oxide fuel cell [25], and non-volatile memory application [26].


| A pulverized YCrO3 single crystal: Controlled refinements with two space groups | |||||||||
| Space group | |||||||||
| (K) | 120 | 300 | 500 | 120 | 300 | 500 | |||
| (Å) | 7.52424(1) | 7.53407(1) | 7.54756(1) | 7.52377(1) | 7.53350(1) | 7.54703(1) | |||
| (Å) | 5.52091(1) | 5.52315(1) | 5.52623(1) | 5.52045(1) | 5.52272(1) | 5.52583(1) | |||
| (Å) | 9.16631(2) | 9.17854(2) | 9.19557(2) | 5.23462(1) | 5.24183(1) | 5.25227(1) | |||
| 90 | 90 | 90 | 90 | 90 | 90 | ||||
| 145.17181(8) | 145.17030(7) | 145.16501(6) | 90 | 90 | 90 | ||||
| (Å3) | 217.467(1) | 218.138(1) | 219.086(1) | 217.418(1) | 218.088(1) | 219.039(1) | |||
| Y1(2a) x | 0.2669(1) | 0.2670(1) | 0.2675(1) | Y1(4c) x | 0.25 | 0.25 | 0.25 | ||
| Y1(2a) y | 0.0673(1) | 0.0669(1) | 0.0661(1) | Y1(4c) y | 0.56757(3) | 0.56689(2) | 0.56608(3) | ||
| Y1(2a) z | 0.2674(1) | 0.2670(1) | 0.2666(1) | Y1(4c) z | 0.48264(4) | 0.48299(3) | 0.48340(3) | ||
| Y2(2a) x | 0.7331(1) | 0.7330(1) | 0.7325(1) | ||||||
| Y2(2a) y | 0.9327(1) | 0.9331(1) | 0.9340(1) | ||||||
| Y2(2a) z | 0.2326(1) | 0.2330(1) | 0.2334(1) | ||||||
| Cr1(2a): | Cr1(4b): | ||||||||
| (0, 0, 0.75) | (0, 0, 0.75) | (0, 0, 0.75) | (0, 0, 0.5) | (0, 0, 0.5) | (0, 0, 0.5) | ||||
| Cr2(2a): | |||||||||
| (0.5, 0, 0.75) | (0.5, 0, 0.75) | (0.5, 0, 0.75) | |||||||
| O1(2a) x | 0.1427(1) | 0.1473(1) | 0.1505(1) | O1(4c) x | 0.25 | 0.25 | 0.25 | ||
| O1(2a) y | 0.4680(1) | 0.4663(1) | 0.4647(1) | O1(4c) y | 0.96643(27) | 0.96632(22) | 0.96519(22) | ||
| O1(2a) z | 0.1470(1) | 0.1473(1) | 0.1476(1) | O1(4c) z | 0.60153(27) | 0.60268(22) | 0.60192(22) | ||
| O2(2a) x | 0.8573(1) | 0.8527(1) | 0.8495(1) | ||||||
| O2(2a) y | 0.5320(1) | 0.5337(1) | 0.5353(1) | ||||||
| O2(2a) z | 0.3530(1) | 0.3527(1) | 0.3524(1) | ||||||
| O3(2a) x | 0.3664(1) | 0.3603(1) | 0.3537(1) | O2(8d) x | 0.05380(15) | 0.05378(11) | 0.05375(11) | ||
| O3(2a) y | 0.3144(1) | 0.3030(1) | 0.2969(1) | O2(8d) y | 0.30362(20) | 0.30297(15) | 0.30204(16) | ||
| O3(2a) z | 0.5689(1) | 0.5565(1) | 0.5474(1) | O2(8d) z | 0.30675(20) | 0.30654(16) | 0.30671(16) | ||
| O4(2a) x | 0.6336(1) | 0.6397(1) | 0.6463(1) | ||||||
| O4(2a) y | 0.6856(1) | 0.6970(1) | 0.7031(1) | ||||||
| O4(2a) z | 0.9311(1) | 0.9435(1) | 0.9526(1) | ||||||
| O5(2a) x | 0.7359(1) | 0.7527(1) | 0.7646(1) | ||||||
| O5(2a) y | 0.2034(1) | 0.1970(1) | 0.1930(1) | ||||||
| O5(2a) z | 0.0457(1) | 0.0565(1) | 0.0658(1) | ||||||
| O6(2a) x | 0.2641(1) | 0.2473(1) | 0.2354(1) | ||||||
| O6(2a) y | 0.7966(1) | 0.8030(1) | 0.8070(1) | ||||||
| O6(2a) z | 0.4543(1) | 0.4435(1) | 0.4342(1) | ||||||
| 19.4 | 16.2 | 14.4 | 12.5 | 8.95 | 7.93 | ||||
| 25.5 | 21.6 | 19.4 | 15.3 | 11.4 | 11.4 | ||||
| 6.60 | 6.57 | 6.45 | 6.87 | 6.55 | 6.40 | ||||
| 14.9 | 10.9 | 9.02 | 4.96 | 3.02 | 3.16 | ||||
| A pulverized YCrO3 single crystal: Controlled refinements with two space groups | |||||||
| Space group | |||||||
| (K) | 120 | 300 | 500 | 120 | 300 | 500 | |
| Cr1-O1(O2) (Å) | 1.9338(1) | 1.9678(1) | 1.9927(1) | Cr1-O1 (Å) | 1.9606(4) | 1.9676(3) | 1.9706(3) |
| Cr1-O3(O4) (Å) | 1.9912(1) | 1.9824(1) | 1.9699(1) | Cr1-O21 (Å) | 2.0000(11) | 1.9980(9) | 1.9952(9) |
| Cr1-O5(O6) (Å) | 2.0069(1) | 1.9985(1) | 1.9909(1) | Cr1-O22 (Å) | 1.9795(11) | 1.9824(9) | 1.9890(9) |
| Cr1-O (Å) | 1.9773(1) | 1.9829(1) | 1.9845(1) | Cr1-O (Å) | 1.9800(3) | 1.9827(3) | 1.9849(3) |
| Cr2-O1(O2) (Å) | 1.9958(1) | 1.9678(1) | 1.9508(1) | ||||
| Cr2-O3(O4) (Å) | 2.0098(1) | 1.9985(1) | 2.0013(1) | ||||
| Cr2-O5(O6) (Å) | 1.9646(1) | 1.9824(1) | 2.0096(1) | ||||
| Cr2-O (Å) | 1.9901(1) | 1.9829(1) | 1.9872(1) | ||||
| Cr1-O1(O2)-Cr2 | 146.420(1) | 146.346(1) | 146.259(1) | Cr1-O1-Cr1 | 147.223(1) | 146.346(1) | 146.452(1) |
| Cr1-O3(O4)-Cr2 | 143.902(1) | 146.052(1) | 147.458(1) | Cr1-O2-Cr1 | 145.824(59) | 146.054(47) | 146.170(47) |
| Cr1-O5(O6)-Cr2 | 146.608(1) | 146.052(1) | 144.694(1) | ||||
| (Y1) | 48.159 | 42.262 | 44.718 | 40.724 | 42.230 | 42.603 | |
| (Y2) | 48.159 | 42.264 | 44.785 | ||||
| (Cr1) | 2.522 | 0.398 | 0.269 | 0.664 | 0.392 | 0.275 | |
| (Cr2) | 0.901 | 0.402 | 1.711 | ||||
| (O1) | 53.841 | 50.868 | 49.924 | 54.779 | 50.881 | 50.356 | |
| (O2) | 53.840 | 50.865 | 50.000 | ||||
| (O3) | 125.483 | 131.629 | 140.423 | 130.085 | 131.605 | 132.797 | |
| (O4) | 125.483 | 131.630 | 140.412 | ||||
| (O5) | 143.801 | 131.601 | 128.605 | ||||
| (O6) | 143.801 | 131.603 | 128.576 | ||||


Up to now, most of the previous studies indicate that YCrO3 belongs to an orthorhombic structure with space group of Pnma [5, 6, 8, 27, 28, 29, 30, 31, 32, 33, 34, 35, 36], for example, a high-resolution neutron powder diffraction study [37] revealed that below and above 473 K at which the dielectric anomaly occurs [22], the average crystal structure of YCrO3 compound is orthorhombic with space group of (No. 62). Such an orthorhombic structure is centrosymmetric, which makes it not easy to form Dzyaloshinskii–Moriya interactions and ferroelectric polarizations. Furthermore, a monoclinic structure with space group of and lattice parameters of = 7.61 0.01 Å, = 7.54 0.01 Å, and = 92∘56′ 6′ were determined for YCrO3 [38, 39]. The excessive phonon entropy [6] was attributed to possible monoclinic structure (, No. 14, centrosymmetric) [38, 39] of YCrO3, and the additional Debye phonon modes in heat capacity data [6] were suspected to be related to the space group of (No. 4, noncentrosymmetric) [22]. Moreover, first-principles calculations indicated that the lowest energy structure of YCrO3 was a monoclinic system with the noncentrosymmetric space group of [22]. A neutron study on YCrO3 with pair distribution function (PDF) method [37] demonstrates that over the range of 1.6–6 Å, the high-temperature (550 K) data can be well indexed with the space group of , by contrast, the data collected in the ferroelectric state could be better fit with the noncentrosymmetric model, leading to a Cr off-centring displacement of the order of 0.01 Å along the direction. Therefore, local noncentrosymmetry was suggested to be the origin of the ferroelectricity in YCrO3 [22]. It is pointed out that so far, the theoretically and experimentally proposed monoclinic () model is the only noncentrosymmetric one [22], reconciling the existence of ferroelectricity in YCrO3.
As is well known, the PDF study [37] provides information of short-range or local crystalline structures from the diffuse scattering. The monoclinic () structure is one of the subgroups of the orthorhombic () one. Within the space group of , YCrO3 accommodates Y1, Cr1, O1, and O2 atomic sites, while in they transfer into Y1/Y2, Cr1/Cr2, O1/O2, and O3/O4/O5/O6 sites, respectively, making a more complicated crystalline structure. It is stressed that so far, it remains an unsolved issue to determine the lattice parameters and atomic positions of the monoclinic () model [9, 10, 37, 40].
In this paper, to reconcile the contradiction between the previously-observed dielectric anomaly [22] and the present consensus on a centrosymmetric crystal structure [34, 35, 36, 37] of YCrO3 compound, we carried out a high-resolution synchrotron X-ray powder diffraction on a pulverized YCrO3 single crystal. The collected data was refined with two space groups of centrosymmetric orthorhombic Pmnb (No. 62) and noncentrosymmetric monoclinic (No. 4), trying to identify the real crystalline structure and symmetry. From values of goodness of fit, it is evident that the orthorhombic model is more suitable for the average macroscopic crystalline structure of YCrO3 compound in consistent with the arrived comment consent. On the other hand, our study also confirms that the structure extracted by the neutron PDF study [37] indeed exists locally in YCrO3 compound. Taking advantage of the synchrotron X-ray powder diffraction, we are able to refine the collected high-quality data with model and determine the corresponding lattice parameters, atomic positions, bond lengths and angles, and local distortion modes, addressing the existing issue on crystallographic information of model and providing a basis for further experimental and theoretical studies. Meanwhile, we also extracted the crystallographic information of Pmnb model with the same data for a controlled study.
2 Experimental
We prepared polycrystalline YCrO3 samples by solid state reaction [41] with a procedure similar to the previously-reported one [9, 10]. The YCrO3 single crystals were grown with a laser-diode floating-zone furnace (Model: LD-FZ-5-200W-VPO-PC-UM) well-equipped at the University of Macau, Macao, China [42, 43].
We carefully chose and gently ground a YCrO3 single crystal into powdered sample with a Vibratory Micro Mill (FRITSCH PULVERISETTE 0) for the synchrotron X-ray powder diffraction study to determine temperature-dependent crystallographic information [44]. The measurements were performed on the beamline I11 at Diamond Light Source, Didcot, UK [45, 46, 47]. X-rays with a wavelength of 0.827 Å were used as the radiation source. High-resolution powder diffraction patterns were collected over a diffraction 2 angle range of 10–70∘ at 120, 300, and 500 K. The 2 step interval is 0.001∘, and the counting time is 1800 s. The YCrO3 powder was loaded onto the outside surface of a 0.3 mm diameter borosilicate glass capillary tube by attaching a thin layer of hand cream. The capillary sample holder fit directly to a magnetic spinner and was mounted at the center of the circle face plate.
We used the computer program FULLPROF SUITE [48] to analyze all collected data. The peak profile shape was modeled with a Pseudo-Voigt function. We refined the background with a linear interpolation between automatically-selected background points. We refined the scale factor, zero shift, peak shape parameters, asymmetry, lattice constants, and atomic positions, etc.
3 Results and discussion
3.1 High-resolution synchrotron X-ray powder diffraction
In order to clarify the structural effect on the magnetic and ferroelectric properties of single-crystal YCrO3 compound, we carried out synchrotron X-ray powder diffraction measurements at 120 K (below the antiferromagnetic transition temperature 141.5 K [10]), 300 K (between and ), and 500 K (above the ferroelectric transition temperature 473 K [22]) to probe the actual crystallographic symmetry. Figure 1 shows the collected synchrotron X-ray powder diffraction patterns as well as the corresponding structural refinements with space groups of (Fig. 1(a)) and Pmnb (Fig. 1(b)). It is clear that the collected data can be well indexed with both space groups. The extracted unit cells were illustrated in Figs. 2(a) () and 2(b) (Pmnb). The refined crystallographic information such as lattice parameters and atomic positions was listed in Table I, and the calculated bond lengths and angles as well as the local distortion parameter were recorded into Table II. From a comparison between the values of goodness of fit (Table I), we found that the values of , , , and from refinements with space group of Pmnb are much lower than the corresponding values from refinements with space group of , for example, 3.02 (Pmnb) and 10.9 () for the data collected at 300 K. In principle, with increasing the number of refinable parameters while transferring space group from Pmnb into , the goodness of fit should become better [48, 49], i.e., the goodness of fit gets lower values. Our refinements derogate from the above principle, which on the contrary demonstrates that the proper average macroscopic structural model for the YCrO3 single crystal is Pmnb rather than and indicates that the structure merely exists locally in YCrO3.
We carefully checked temperature evolution of the shape and position of Bragg peaks as marked in Figs. 2(c-e) within three representative 2 regimes. As a whole, the refinements with Pmnb space group (shown as solid lines in Figs. 2(c-e)) fit better to the Bragg peaks. The Bragg peak (451) observed in Pmnb space symmetry at 500 K evolved into (451) and (722) peaks at 300 K and (443), (451), and (722) reflections at 120 K, and the corresponding peak position shifted to higher angles (Fig. 2(c)); the observed (215) and (351) Bragg peaks at 500 and 300 K combined into one (215) peak at 120 K (Fig. 2(d)); the Bragg (423) and (242) peaks appeared at 500 K first united into (242) peak at 300 K and then split into (242) and (423) peaks again (Fig. 2(e)). The shift of Bragg positions indicates changes in lattice constants.
Traditionally, powder diffraction including X-ray and neutron is usually utilized to solve crystalline structures [50]. Especially, neutron scattering is a powerful technique to solve magnetic structures [51] and monitor spin excitations and fluctuations [52]. Compared to neutron sources, although synchrotron X-ray has much stronger intensity and brilliance [50], we did not observe any magnetic indications for single-crystal YCrO3 at 120 K (Fig. 1).
3.2 Temperature dependent lattice parameters
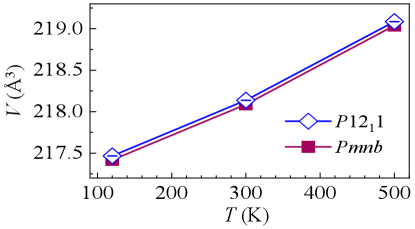
Figure 3 shows the refined lattice constants a (Fig. 3(a)), b (Fig. 3(b)), and c (Fig. 3(c)) of the YCrO3 single crystal with space groups of and Pmnb. With increasing temperature from 120 to 500 K, the lattice constants a, b, and c almost increase linearly. The values of lattice constants a and b in space group are a little larger than the ones in space group of Pmnb. It is pointed out that in space group, the monoclinic (mc) lattice c axis is transformed from (-a-c) in orthorhombic (or) Pmnb space group, which leads to the crystallographic angle 90∘ (Table I) and the value of constant (Fig. 3(c)). The temperature variances of lattice constants as well as the value change in angle jointly result in the change in unit-cell volumes with temperature as shown in Fig. 4.
3.3 Temperature dependent bond lengths and local distortion modes
Local crystalline environments such as bond lengths and angles as well as their unhomogeneous distributions may have dramatic impacts on macroscopic properties of the host. Figure 5 shows calculated bond lengths of Cr and O ions in the YCrO3 single crystal with space groups of (Figs. 5(a) and 5(b)) and Pmnb (Figs. 5(c) and 5(d)).
We first discuss the results extracted with the space group of Pmnb (Figs. 5(c) and 5(d)). With increasing temperature from 120 to 500 K, the bond lengths of Cr1-O1 and Cr1-O22 increase, whereas that of Cr1-O21 decreases, which jointly leads to an increase of the averaged bond length Cr1-O (Fig. 5(c)). Based on these results, we extracted the local distortion modes of Cr1O6 octahedra at different temperatures (Fig. 5(d)). At 500 K, i.e., in the paraelectric state, Cr1-O21 and Cr1-O22 bonds are stretched, and Cr1-O1 bonds are compressed, displaying like a cooperative Jahn-Teller distortion. Upon cooling, when 300 K, YCrO3 stays in the quasi-ferroelectric state, and the Cr1-O22 bonds get balanced, i.e., without any stretching and suppressing. With further cooling down to 120 K, although YCrO3 undergoes an antiferromagnetic phase transition at 141.5 K, the Cr1O6 local distortion mode keeps similar to that at 300 K. Therefore, the change in Cr1-O22 bonds responses sensitively to the observed dielectric anomaly.
Secondly, we present the results obtained from refinements with space group (Figs. 5(a) and 5(b)). As shown in Fig. 5(a): (i) For the Cr1 ions, as temperature increases from 120 to 500 K, the values of Cr1-O3(O4) and Cr1-O5(O6) bond lengths decrease, by contrast, that of Cr1-O1(O2) bonds increases. (ii) For the Cr2 ions, Cr2-O1(O2) and Cr2-O3(O4) bond lengths decrease, whereas that of Cr2-O5(O6) increases. Fig. 5(b) shows the extracted local distortion modes of Cr1(Cr2)O6 octahedra: (i) When 500 K, the distortion mode of Cr2O(1-6) so obtained resembles that of Cr1O(1,2) in Pmnb space group. For the Cr1O(1-6) octahedron, Cr1-O1(O2) and Cr1-O3(O4) bonds change their strained states, i.e., from the shortened to a prolongated state for Cr1-O1(O2) bonds and an opposite effect on Cr1-O3(O4) bonds. Cr1-O5(O6) bonds keep a similar state to that of Cr2-O5(O6). (ii) At 300 K, Cr1-O3(O4) and Cr2-O5(O6) bonds become normal, and other Cr1(Cr2)-O bonds keep their respective states as that of Cr2O6 at 500 K. (iii) At 120 K, Cr1(Cr2)-O3(O4), Cr1-O5(O6), and Cr2-O1(O2) bonds are stretched, and Cr1-O1(O2) and Cr2-O5(O6) bonds are compressed.
By carefully comparing all the local distortion modes in space group displayed in Fig. 5(b), it is clear that Cr1O6 at 120 K displays the same local distortion mode as that of Cr2O6 at 500 K, therefore, the local distortion mode of Cr2O6 at 120 K is sensitive to the formation of the antiferromagnetic order. The local distortion modes of Cr1O6 and Cr2O6 octohedra at 300 K, beside the relaxation of Cr1-O3(O4) and Cr2-O5(O6) bonds, may be the key factors for a full understanding of the quasi-ferroelectric order.
3.4 Temperature dependent strength of the local crystalline distortion
The strength of the local crystalline distortion of CrO6 octahedra can be estimated by the parameter [53, 54],
| (1) |
where n is the coordination number, which equals six in a CrO6 octahedral, di is the bond length along one of the n coordination directions, and is the mean Cr–O bond length. As shown in Fig. 6 and Table II, the local distortion parameter extracted with Pmnb space group has similar values as previously reported [10, 40]: of Cr1 ions keeps a lower value of 1 10-4, while Y1, O1, and O2 ions have more than one order of magnitude larger values, indicating that stronger local distortions exist in Y1, O1, and O2 ions. This could be a key to understand the dielectric anomaly [22, 55]. As temperature increases, the values of Y1 and O2 ions increase, whereas those of Cr1 and O1 ions decrease (Fig. 6(b)). While refining the data with space group, despite that Y1(Y2), O1(O2), O3(O4), and O5(O6) ions locate at different crystalline positions (Table I), the values of their distortion parameter are almost the same within error bars and display a decreasing tread upon warming except for the O3(O4) ions. It is hard to distinguish their responses to the antiferromagnetic phase transition and the quasi-ferroelectric transition. Meanwhile, the value of Cr1 ions shows an increase at 120 K below the antiferromagnetic transition temperature, and that of Cr2 ions increases at 500 K above the quasi-ferroelectric transition temperature. This phenomenon implies that although Cr1 and Cr2 ions show the same behaviors in space group of Pmnb, they are easily distinguishable in space group and contribute differently to the formations of the antiferromagnetic and the quasi-ferroelectric phases.
3.5 Temperature dependent bond angles
Figure 7 shows the space configurations and calculated values of Cr-O-Cr bond angles with space groups of (Figs. 7(a) and 7(b)) and Pmnb (Figs. 7(c) and 7(d)). Within the crystal structure, Cr1-O3(O4)-Cr2 is an angle along the intra-chain of CrO6 octahedra, and Cr1-O5(O6)-Cr2 is an inter-chain angle (Fig. 7(a)). The bond angles extracted from refinements with space group show that the value of Cr1-O3(O4)-Cr2 increases upon warming while that of Cr1-O5(O6)-Cr2 decreases, and that of Cr1-O1(O2)-Cr2 displays no obvious change (Fig. 7(b)). Thus thermal enhancements weaken the tilting of CrO6 octahedra along the intra-chains and strengthen the rotating of CrO6 octahedra along the inter-chains. As shown in Figs. 7(c) and 7(d), the inter-chain angle Cr1-O1-Cr1 shows a clear enhancement at 120 K, and the intra-chain angle Cr1-O2-Cr1 displays a small decrease at 120 K in the Pmnb space group.
It is well known that the value of bond angle Cr-O-Cr has a strong effect on the strength of spin exchanges. Within the Pmnb space group, magnetic interactions between Cr1 and Cr1 ions are stronger through the intermediate of O2 ions than via O1 ions while entering into the antiferromagnetic state upon cooling below (Fig. 7(d)). In the space group, the spin interactions of Cr1-Cr2 ions occur mainly via O3(O4) ions (Fig. 7(b)).
4 Conclusions
In summary, we have collected high-resolution synchrotron X-ray powder diffraction data of single-crystal YCrO3 compound at 120, 300, and 500 K, which was refined with two space groups of (No. 4, noncentrosymmetric) and Pmnb (No. 62, centrosymmetric). From physics point of view, the data can be well fit with both space groups. We extracted the structural parameters such as lattice constants, lattice angle , unit-cell volume, atomic positions, and bond lengths and angles. We thus calculated the local crystalline distortion parameter . For the pairs of Y1 and Y2 ions, O1 and O2 ions, O3 and O4 ions, and O5 and O6 ions, their values are almost the same in the space group. From the calculated values of bond lengths, we extracted the detailed CrO6 distortion modes and discussed their effects on the formations of the antiferromagnetic order and the quasi-ferroelectric state. From the values of refined Cr-O-Cr bond angles, we discussed the pathway of spin interactions. The crystallograhpic information of single-crystal YCrO3 obtained in this study with space group provides for the first time a set of complete structural parameters of the noncentrosymmetric space group, which may shed light on the observed dielectric anomaly in YCrO3 compound and be very important for further experimental and theoretical studies.
CRediT authorship contribution statement
Qian Zhao: Methodology, Investigation, Validation, Writing - Original Draft, Visualization. Si Wu: Methodology, Investigation, Validation, Writing - Original Draft, Visualization. Yinghao Zhu: Methodology, Investigation, Validation, Writing - Original Draft, Visualization. Junchao Xia: Methodology, Software, Investigation, Validation, Visualization. Hai-Feng Li: Conceptualization, Writing - Review & Editing, Visualization, Supervision, Project administration, Funding acquisition.
Declaration of Competing Interest
The authors declare that they have no known competing financial interests or personal relationships that could have appeared to influence the work reported in this paper.
Acknowledgments
Authors acknowledge financial supports from the opening project of State Key Laboratory of High Performance Ceramics and Superfine Microstructure (Grant No. SKL201907SIC), Science and Technology Development Fund, Macao SAR (File Nos. 0051/2019/AFJ and 0090/2021/A2), Guangdong Basic and Applied Basic Research Foundation (Guangdong–Dongguan Joint Fund No. 2020B1515120025), University of Macau (
MYRG2020-00278-IAPME and EF030/IAPME-LHF/2021/GDSTIC), and Guangdong–Hong Kong–Macao Joint Laboratory for Neutron Scattering Science and Technology (Grant No. 2019B121205003).
References
- [1] V. Wadhawan, Introduction to ferroic materials, CRC press, 2000.
- [2] W. Eerenstein, N. Mathur, J. F. Scott, Multiferroic and magnetoelectric materials, Nature 442 (7104) (2006) 759–765.
- [3] L. W. Martin, A. M. Rappe, Thin-film ferroelectric materials and their applications, Nature Reviews Materials 2 (2) (2016) 1–14.
- [4] K. Uchino, Ferroelectric devices, CRC press, 2018.
- [5] E. Bertaut, G. Bassi, G. Buisson, P. Burlet, J. Chappert, A. Delapalme, J. Mareschal, G. Roult, R. Aleonard, R. Pauthenet, et al., Some neutron-diffraction investigations at the nuclear center of grenoble, Journal of Applied Physics 37 (3) (1966) 1038–1039.
- [6] J. Kim, Y. S. Oh, K. Suh, Y. Park, K. H. Kim, Specific heat of a YCrO3 single crystal as investigated by a Si–N membrane based microcalorimeter, Thermochimica acta 455 (1-2) (2007) 2–6.
- [7] G. Alvarez, M. Cruz, A. Durán, H. Montiel, R. Zamorano, Weak ferromagnetism in the magnetoelectric YCrO3 detected by microwave power absorption measurements, Solid state communications 150 (35-36) (2010) 1597–1600.
- [8] J. Gervacio-Arciniega, E. Murillo-Bracamontes, O. Contreras, J. Siqueiros, O. Raymond, A. Durán, D. Bueno-Baques, D. Valdespino, E. Cruz-Valeriano, C. Enríquez-Flores, et al., Multiferroic YCrO3 thin films: Structural, ferroelectric and magnetic properties, Applied Surface Science 427 (2018) 635–639.
- [9] Y. Zhu, S. Wu, B. Tu, S. Jin, A. Huq, J. Persson, H. Gao, D. Ouyang, Z. He, D.-X. Yao, et al., High-temperature magnetism and crystallography of a YCrO3 single crystal, Physical Review B 101 (1) (2020) 014114.
- [10] Y. Zhu, Y. Fu, B. Tu, T. Li, J. Miao, Q. Zhao, S. Wu, J. Xia, P. Zhou, A. Huq, et al., Crystalline and magnetic structures, magnetization, heat capacity, and anisotropic magnetostriction effect in a yttrium-chromium oxide, Physical Review Materials 4 (9) (2020) 094409.
- [11] Y. Zhu, P. Zhou, T. Li, J. Xia, S. Wu, Y. Fu, K. Sun, Q. Zhao, Z. Li, Z. Tang, et al., Enhanced magnetocaloric effect and magnetic phase diagrams of single-crystal GdCrO3, Physical Review B 102 (14) (2020) 144425.
- [12] N. A. Spaldin, M. Fiebig, The renaissance of magnetoelectric multiferroics, Science 309 (5733) (2005) 391–392.
- [13] S. Mishra, K. Rudrapal, A. Rahaman, P. Pal, A. Sagdeo, R. Mishra, D. Topwal, A. R. Chaudhuri, V. Adyam, D. Choudhury, et al., Observation of room-temperature ferroelectricity in spark-plasma sintered GdCrO3, Physical Review B 104 (18) (2021) L180101.
- [14] I. Fita, R. Puzniak, A. Wisniewski, Pressure-tuned spin switching in compensated GdCrO3 ferrimagnet, Physical Review B 103 (5) (2021) 054423.
- [15] H. Wang, X. Liu, K. Sun, X. Ma, H. Guo, I. Bobrikov, Y. Sui, Q. Liu, Y. Xia, X. Chen, et al., Competition of ferromagnetism and antiferromagnetism in mn-doped orthorhombic YCrO3, Journal of Magnetism and Magnetic Materials 535 (2021) 168022.
- [16] M. K. Gupta, R. Mittal, S. K. Mishra, P. Goel, B. Singh, S. Rols, S. L. Chaplot, Spin–phonon coupling and thermodynamic behaviour in YCrO3 and LaCrO3: inelastic neutron scattering and lattice dynamics, Journal of Physics: Condensed Matter 32 (50) (2020) 505402.
- [17] Y. Sharma, B. Paudel, J. Lee, W. S. Choi, Z. Yang, H. Wang, Y. Du, K. T. Kang, G. Pilania, A. Chen, Tuning magnetic and optical properties through strain in epitaxial LaCrO3 thin films, arXiv preprint arXiv:2105.02941 (2021).
- [18] A. Otsuka, R. S. Silva Jr, C. dos Santos, N. S. Ferreira, M. d. S. Rezende, M. C. dos Santos, Effect of chemical and hydrostatic pressures on the structural and mechanical properties of orthorhombic rare-earth RNiO3, Computational Materials Science 197 (2021) 110691.
- [19] R. Saha, A. Sundaresan, C. Rao, Novel features of multiferroic and magnetoelectric ferrites and chromites exhibiting magnetically driven ferroelectricity, Materials Horizons 1 (1) (2014) 20–31.
- [20] X. Zeng, Y. Liang, H. Zhang, X. Xi, J. Cao, B. Li, J. Zhou, Smoothing method to directly denoise terahertz signals in rare-earth orthoferrite antiferromagnets, Journal of the American Ceramic Society 104 (7) (2021) 3325–3333.
- [21] A. Zvezdin, Z. Gareeva, X. Chen, Multiferroic order parameters in rhombic antiferromagnets RCrO3, Journal of Physics: Condensed Matter 33 (38) (2021) 385801.
- [22] C. R. Serrao, A. K. Kundu, S. B. Krupanidhi, U. V. Waghmare, C. N. R. Rao, Biferroic YCrO3, Phys. Rev. B 72 (2005) 220101.
- [23] K. Poplawski, J. Lichtenberger, F. J. Keil, K. Schnitzlein, M. D. Amiridis, Catalytic oxidation of 1, 2-dichlorobenzene over ABO3-type perovskites, Catalysis today 62 (4) (2000) 329–336.
- [24] J. H. Kim, H.-S. Shin, S.-H. Kim, J.-H. Moon, B.-T. Lee, Formation of YCrO3 thin films using radio-frequency magnetron sputtering method for a wide range thermistor application, Japanese journal of applied physics 42 (2R) (2003) 575.
- [25] M. H. A. Jabbar, I. Robinson, K.-J. Pan, B. M. Blackburn, C. Pellegrinelli, Y.-L. Huang, E. D. Wachsman, Chromate-based oxide anodes for low-temperature operating solid oxide fuel cells, ECS Transactions 78 (1) (2017) 1319.
- [26] Y. Sharma, P. Misra, R. S. Katiyar, Unipolar resistive switching behavior of amorphous YCrO3 films for nonvolatile memory applications, Journal of Applied Physics 116 (8) (2014) 084505.
- [27] J. R. Sahu, C. R. Serrao, C. Rao, Modification of the multiferroic properties of YCrO3 and LuCrO3 by mn substitution, Solid state communications 145 (1-2) (2008) 52–55.
- [28] A. Durán, A. Arévalo-López, E. Castillo-Martínez, M. García-Guaderrama, E. Moran, M. Cruz, F. Fernández, M. Alario-Franco, Magneto-thermal and dielectric properties of biferroic YCrO3 prepared by combustion synthesis, Journal of Solid State Chemistry 183 (8) (2010) 1863–1871.
- [29] M. Ardit, G. Cruciani, M. Dondi, M. Merlini, P. Bouvier, Elastic properties of perovskite YCrO3 up to 60 GPa, Physical Review B 82 (6) (2010) 064109.
- [30] K. Sardar, M. R. Lees, R. J. Kashtiban, J. Sloan, R. I. Walton, Direct hydrothermal synthesis and physical properties of rare-earth and yttrium orthochromite perovskites, Chemistry of Materials 23 (1) (2011) 48–56.
- [31] I. Singh, A. Nigam, K. Landfester, R. Muñoz-Espí, A. Chandra, Anomalous magnetic behavior below 10 K in YCrO3 nanoparticles obtained under droplet confinement, Applied Physics Letters 103 (18) (2013) 182902.
- [32] S. Krishnan, N. Kalarikkal, Synthesis of YCrO3 nanoparticles through paa assisted sol–gel route, Journal of sol-gel science and technology 66 (1) (2013) 6–14.
- [33] A. N. Jara, J. F. Carvalho, A. F. Júnior, L. J. Maia, R. C. Santana, On the optical and magnetic studies of YCrO3 perovskites, Physica B: Condensed Matter 546 (2018) 67–72.
- [34] V. Sanina, B. K. Khannanov, E. Golovenchits, M. Shcheglov, Electric polarization in YCrO3 induced by restricted polar domains of magnetic and structural natures, Physics of the Solid State 60 (12) (2018) 2532–2540.
- [35] Y. Sharma, E. Skoropata, B. Paudel, K. T. Kang, D. Yarotski, T. Z. Ward, A. Chen, Epitaxial stabilization of single-crystal multiferroic YCrO3 thin films, Nanomaterials 10 (10) (2020) 2085.
- [36] P. Chakraborty, S. Dey, S. Basu, Structural, electrical and magnetic properties of eu doped YCrO3 nanoparticles, Physica B: Condensed Matter 601 (2021) 412677.
- [37] K. Ramesha, A. Llobet, T. Proffen, C. Serrao, C. Rao, Observation of local non-centrosymmetry in weakly biferroic YCrO3, Journal of Physics: Condensed Matter 19 (10) (2007) 102202.
- [38] J. T. Looby, L. Katz, Yttrium chromium oxide, a new compound of the perowskite type, Journal of the American Chemical Society 76 (23) (1954) 6029–6030.
- [39] L. Katz, On the unit cell of YCrO3, Acta Crystallographica 8 (2) (1955) 121–122.
- [40] Q. Zhao, Y. Zhu, S. Wu, J. Xia, P. Zhou, K. Sun, H.-F. Li, Temperature-dependent structure and magnetization of YCrO3 compound, arXiv:2109.11751 (2021).
- [41] H. Li, Synthesis of CMR manganites and ordering phenomena in complex transition metal oxides, Forschungszentrum Jlich GmbH Press, 2008.
- [42] S. Wu, Y. Zhu, H. Gao, Y. Xiao, J. Xia, P. Zhou, D. Ouyang, Z. Li, Z. Chen, Z. Tang, et al., Super-necking crystal growth and structural and magnetic properties of SrTb2O4 single crystals, ACS omega 5 (27) (2020) 16584–16594.
- [43] H. Li, Y. Zhu, S. Wu, Z. Tang, Centimeter-level chromium oxide single crystal, preparation method thereof and storage device, China Patent CN110904497B, 2021.
- [44] H.-F. Li, A. Wildes, B. Hou, C. Zhang, B. Schmitz, P. Meuffels, G. Roth, T. Brückel, Magnetization, crystal structure and anisotropic thermal expansion of single-crystal SrEr2O4, RSC Advances 4 (96) (2014) 53602–53607.
- [45] S. Thompson, J. Parker, J. Potter, T. Hill, A. Birt, T. Cobb, F. Yuan, C. Tang, Beamline I11 at diamond: A new instrument for high resolution powder diffraction, Review of scientific instruments 80 (7) (2009) 075107.
- [46] J. E. Parker, S. P. Thompson, T. M. Cobb, F. Yuan, J. Potter, A. R. Lennie, S. Alexander, C. J. Tighe, J. A. Darr, J. C. Cockcroft, et al., High-throughput powder diffraction on beamline I11 at diamond, Journal of Applied Crystallography 44 (1) (2011) 102–110.
- [47] C. Tang, S. Thompson, T. Hill, G. Wilkin, U. Wagner, Design of powder diffraction beamline (BL-I11) at diamond, in: Tenth European Powder Diffraction Conference, Oldenbourg Wissenschaftsverlag, 2015, pp. 153–158.
- [48] J. Rodríguez-Carvajal, Recent advances in magnetic structure determination by neutron powder diffraction, Physica B: Condensed Matter 192 (1-2) (1993) 55–69.
- [49] H.-F. Li, Y. Su, Y. Xiao, J. Persson, P. Meuffels, T. Brückel, Crystal and magnetic structure of single-crystal La1-xSrxMnO3 (x 1/8), The European Physical Journal B 67 (2) (2009) 149–157.
- [50] D. W.I.F., K. Shankland, L. McCusker, C. Bärlocher, Structure Determination from Powder Diffraction Data, Oxford University Press, 2006.
- [51] Y. Xiao, Y. Su, H.-F. Li, C. Kumar, R. Mittal, J. Persson, A. Senyshyn, K. Gross, T. Brueckel, Neutron diffraction investigation of the crystal and magnetic structures in KCrF3 perovskite, Physical Review B 82 (9) (2010) 094437.
- [52] H.-F. Li, C. Broholm, D. Vaknin, R. M. Fernandes, D. L. Abernathy, M. B. Stone, D. K. Pratt, W. Tian, Y. Qiu, N. Ni, S. O. Diallo, J. L. Zarestky, S. L. Bud’ko, P. C. Canfield, R. J. McQueeney, Anisotropic and quasipropagating spin excitations in superconducting Ba(Fe0.926CoAs2, Phys. Rev. B 82 (2010) 140503.
- [53] H. Li, Y. Su, J. Persson, P. Meuffels, J. Walter, R. Skowronek, T. Brückel, Correlation between structural and magnetic properties of La7/8Sr1/8Mn1-γO3+δ with controlled nonstoichiometry, Journal of Physics: Condensed Matter 19 (1) (2006) 016003.
- [54] H. Li, Y. Su, J. Persson, P. Meuffels, J. Walter, R. Skowronek, T. Brückel, Neutron-diffraction study of structural transition and magnetic order in orthorhombic and rhombohedral La7/8Sr1/8Mn1-γO3+δ, Journal of Physics: Condensed Matter 19 (17) (2007) 176226.
- [55] A. K. Mall, B. Paul, A. Garg, R. Gupta, Temperature dependent X-ray diffraction and raman spectroscopy studies of polycrystalline YCrO3 ceramics across the 460 K, Journal of Raman Spectroscopy 51 (3) (2020) 537–545.