[table]capposition=top \DeclareFloatFontnormalsize\floatsetup[table]font=normalsize
Inertial Sensor Data To Image Encoding For Human Action Recognition
Abstract
Convolutional Neural Networks (CNNs) are successful deep learning models in the field of computer vision. To get the maximum advantage of CNN model for Human Action Recognition (HAR) using inertial sensor data, in this paper, we use four types of spatial domain methods for transforming inertial sensor data to activity images, which are then utilized in a novel fusion framework. These four types of activity images are Signal Images (SI), Gramian Angular Field (GAF) Images, Markov Transition Field (MTF) Images and Recurrence Plot (RP) Images. Furthermore, for creating a multimodal fusion framework and to exploit activity images, we made each type of activity images multimodal by convolving with two spatial domain filters : Prewitt filter and High-boost filter. ResNet-18, a CNN model, is used to learn deep features from multi-modalities. Learned features are extracted from the last pooling layer of each ResNet and then fused by canonical correlation based fusion (CCF) for improving the accuracy of human action recognition. These highly informative features are served as input to a multi-class Support Vector Machine (SVM). Experimental results on three publicly available inertial datasets show the superiority of the proposed method over the current state-of-the-art.
Index Terms:
Deep learning, human action recognition, image encoding, mutimodal fusion.I Introduction
HUMAN action recognition is a progressive area of research in the field of computer vision and machine learning due to its applications in various spheres of our life such as healthcare [1], surveillance [2] and sports [3]. ††An earlier version of this paper is published in 2019 IEEE Fifth International Conference on Multimedia Big Data (BigMM). IEEE, 2019, pp. 429–434. URL: https://ieeexplore.ieee.org/document/8919410
Human Action Recognition using inertial data gained significant attention due to the availability of cost-effective smart phones, wearable sensors and their advantages over vision based sensors such as Kinect and RGB cameras. These advantages include the provisioning of data at high sampling rate, ability to work in gloomy and bounded conditions [4], preserving the privacy of patients while using for healthcare applications, insensitivity to noise and simpler hardware setup.
Earlier or conventional methods for HAR were statistical methods that were based on hand crafted methods of feature extraction such as descriptive statistics [5] and techniques from signal processing [6]. These traditional methods have few disadvantages: 1) requirement of domain knowledge about the data and separation of feature extraction and classification parts [7]; 2) capturing only a subset of the features; resulting in difficulty to generalize for unseen data. The success of deep learning models in the field of computer vision [8] and image classification [9], especially the CNN, convinced the researchers to use deep learning models for HAR.
Commonly used inertial sensors for HAR are accelerometer and gyroscope. These sensors provide data in the form of multivariate time series. Existing methods for HAR using inertial sensor data and deep learning models depend upon the utilization of raw multivariate time series using recurrent neural networks (RNN) [10], deep belief networks (DBN) [11], restricted Boltzmann machine (RBM) [12], stacked autoencoders [13] and using 1D and 2D CNN [14]. In [15], we experimentally proved that converting inertial data from 1D to 2D i.e in the form of images considerably improves the performance of action recognition task. Furthermore, inertial sensor modality has been extensively used with vision sensor modality such as Kinect to provide supplementary information during the fusion of modalities using both statistical [16] and deep learning methods [17].
In [18], inertial data for HAR was transformed into 2D activity images for improved performance. Moreover, for further analysis, activity images were transformed to frequecy domain and time-spectrum domain using Discrete Fourier transform (DFT) and 2D Wavelet transform respectively. However, these images in different domains are utilized independently and their fusion could not be exploited. To get the maximum benefit of multidomain fusion for HAR using inertial data, in our previous work [19], we proposed CNN based multidomain multimodal fusion framework that extracts features in spatial, frequency and time-frequency domain and hence provide multiscale and multichromatic complementary features in addition to discriminative features. These multidomain features are then integrated using canonical correlation based fusion (CCF). Experimental results show that multidomain fusion achieved state-of-the-art performance as compared to previous works. However, we find a deficiency in multidomain fusion. Since inertial sensor data is a time series having sharp transitions or abrupt changes at different instances of its progression, these sharp transitions may not be accurately modeled in frequency domain as sharp transitions in time domain require infinite frequency contents to be modeled in frequency domain. These ringing artifacts are shown in Fig. 1 and we can see overshoots in frequency domain when a sharp transition occurs in spatial domain. These artifacts also affect the transformed domain images and lead to deterioration in accuracy. This can be observed in Table I.

To improve on our previous work in [19], in this paper, we use four spatial domain methods of transforming inertial sensor data for HAR into activity images called Signal Images (SI), Gramian Angular Field (GAF) Images, Markov Transition Field (MTF) Images and Recurrence Plot (RP) Images. Since each kind of inertial sensor data to image encoding shows different patterns and highlights different features of inertial data, therefore the purpose of using four different kind of activity images is to find the best sensor data to image encoding method for HAR. We experimentally observe that GAF and RP images perform better than MTF and signal images. However, GAF images achieve state-of-the-art performance as compared to other three kinds of images for all datasets.
For performing multimodal fusion using the proposed fusion framework shown in Fig. 2, we made each type of activity image multimodal by convolving them with spatial domain Prewitt and high-boost filters as shown in Fig. 2. We train ResNets on each modality. Finally, the learned features extracted from “ pool5 ” layer of each ResNet-18, a CNN model [20], are fused using CCF. Experimental results shown in Table II prove the dominance of the proposed fusion framework. The proposed method is explained in detail in section III and experimental results are discussed in section IV-D.
The key contributions of the presented work are:
-
1.
We use four spatial domain methods of transforming raw inertial sensor data into activity images for HAR. To the best of our knowledge, this is the first paper where an inertial sensor data for HAR is transformed into four different kinds of images and a detailed experimental based analysis for each kind of activity image using the proposed fusion framework is presented.
-
2.
Converting raw inertial data into spatial domain activity images and then creation of additional modalities using spatial domain filters preserves the temporal correlation among the samples of time series and thus we achieve better recognition performance as compared to the frequency domain transformation methods that cause ringing effects in the images.
The rest of the paper is organized as follows. Section II describes the related works on HAR using inertial sensor data individually and their fusion with other modalities. Section III provides detailed description of the proposed method. In Section IV, we provide detailed experimental analysis, where the aforementioned contributions are analyzed in detail through large number of experiments and comparisons with the state-of-the-art models. Section V concludes the paper.
II Related Work
In this section we present the existing work on HAR using inertial sensor data in spatial domain, transform domain and its fusion with other modalities.
In [21], an improved algorithm based on Fast Fourier Transform (FFT) is proposed which extracts features from resultant acceleration of the data obtained from smartphones. In [22], a frequency-based action descriptor called “FADE” is proposed to represent human actions. FFT is used to transform the signals into frequency domain and then these signals are resampled to exploit the frequency domain features. Finally, Manhattan distance is used for measuring similarities between the actions. In [14], CNN is used to classify eight different human actions from the data collected by tri-axial accelerometer. In [18], wearable sensor data is converted into activity images and then CNN is employed for action classification. Experiments on three datasets show that proposed method is robust and highly accurate. In [23], limited data from accelerometer and gyroscope is used for HAR using CNN, LSTM and classical machine learning algorithms. Accuracy of action recognition was further increased by applying data augmentation and data balancing techniques. Complex activity recognition system based on cascade classifiers and wearable device data is developed in [24]. The data was collected by smartphone, smartwatch and bluetooth devices and experimental results show the reliability of the proposed method. In [25], inertial data is converted into GAF images and then a multi-sensor data fusion network called Fusion-MdkResNet is used which can process data collected by different sensors and fuse data automatically.
In [26], a novel deep learning model called multi-scale image encoded HHAR (MS-IE-HHAR) for fine-grained human activity recognition from heterogeneous sensors, is presented. Sensor data is transformed into RGB images and then an important module of the proposed model called Hierarchical Multi-scale Extraction (HME) is used for feature extraction. Experimental results show competitive performance of the proposed model. In [27], accelerometer signals are encoded as color images using a modified recurrence plot (RP) and then a tiny residual neural network is employed for end-to-end image classification. Experiments show that the proposed framework achieves better performance. In [28], mobile sensor data for acceleration and angular velocity is encoded to GAF images and then two deep learning models are used to extract features from GAF images of acceleration and angular velocity. These features are then fused by fusion ResNet for improved performance of human activity recognition. Authors in [29] presented a new deep learning model called MMHAR-EnsemNet (Multi-Modal Human Activity Recognition Ensemble Network) to perform sensor based human activity using four different modalities. Two separate Convolutional Neural Networks (CNNs) are made for skeleton data while one CNN and one LSTM is trained for RGB images. Accelerometer and Gyroscope data is transformed to signal diagram and then another CNN model is trained on them. Finally, all the outputs of the said models have been used to form an ensemble to improve the performance of HAR. In [30], a two-stream ConvNet for action recognition, enhanced with Long Short-Term Memory (LSTM) and a Temporal Convolution Networks (TCN) is presented to perform human action recognition. To enhance the recognition process, feature level and late fusions are also investigated using two datasets. In [31], a novel loss function called harmonic loss, which is based on the label replication method to replicate true labels at each sequence step of LSTM models, is presented to improve the overall classification performance of sensor based HAR. This loss function not only takes all local sequence errors into accounts but also considers the relative importance of different local errors in the training. Finally, integrated methods based on ensemble learning strategy and harmonic loss are presented and analyzed. In [32], the time series radar data for HAR is converted into radar spectrograms using short-time Fourier transform(STFT). Radar spectrogram is treated as a time-sequential vector, and a deep learning model (DL) composed of 1-D convolutional neural networks (1D-CNNs) and recurrent neural networks (RNNs) is proposed. The experiments show that the proposed DL achieves the highest accuracy than that of existing 2-D CNN methods with fewest number of parameters. Authors in [33] presented a residual and LSTM recurrent networks-based transportation mode detection algorithm using multiple light-weight sensors integrated in commodity smartphones. Transportation mode detection, a branch of HAR, is of great importance in analyzing human travel patterns, traffic prediction and planning. Residual units are used to accelerate the learning speed and enhance the accuracy of transportation mode detection while the aattention models are employed to learn the significance of different features and different timesteps to enhance the recognition accuracy.
A survey article [34] provides a detail about the performance of current deep learning models and future challenges on sensor based activity recognition.
Multimodal fusion alleviates the shortcomings of individual modalities and thus improve the performance of HAR. In [35], inertial data is transformed into GAF images for performing vision-inertial HAR with RGB videos and then a novel framework, named Semantics-aware Adaptive Knowledge Distillation Networks (SAKDN) is proposed to enhance action recognition in vision-sensor modalities by adaptively transferring and distilling the knowledge from multiple wearable sensors. In [36], computationally efficient real-time detection and recognition approach is presented to identify actions in the smart TV application from continuous action streams using continuous integration of information obtained from depth and inertial sensor data. An efficient real-time human action recognition system is developed in [37] using decision level fusion of depth and inertial sensor data. Deep learning based decision level multimodal fusion framework is proposed in [38]. CNN is used to extract features from depth images while Recurrent Neural Netwrok (RNN) is used to capture features from inertial sensor data. Data augmentation is also carried out to cop up with limited size data. Authors in [39] proposed deep neural network based fusion of images and inertial data for improving the performance of human action recognition. Two CNNs were used to extract features from images and inertial sensors and finally the fused fearures were used to train an RNN classifier. In [40], video and inertial data is converted into 2D and 3D images which are used as input to 2D and 3D CNN. Finally, decision level fusion is used to increase the recognition accuracy. In[4], multimodal feature-level fusion approach for robust human action recognition is presented which utilizes data from multiple sensors, including RGB camera, depth sensor, and wearable inertial sensors. Computationally efficient features are extracted from the data obtained from RGB-D video camera and inertial body sensors. Experimental results show that feature-level fusion of RGB and inertial sensors provides best performance for the proposed method.
To improve our work presented in [19], in this paper, we use four spatial domain methods of transforming inertial data for HAR into activity images called Signal Images (SI), Gramian Angular Field (GAF) Images, Markov Transition Field (MTF) Images and Recurrence Plot (RP) Images. For multimodal fusion using the proposed fusion framework shown in Fig. 2, we made each type of activity image multimodal by convolving them with spatial domain Prewitt and high-boost filters as shown in Fig. 2. Finally, the learned features extracted from “ pool5 ” layer of each ResNet are fused using CCF. The proposed method in this paper is an extension of our work in [19]. Following is the difference between presented work in this paper and our previous work in [19].
-
1.
In our previous work, we transformed inertial sensor data into one kind of activity images only whereas in presented work, we transformed inertial sensor data into four kind of activity images named as Signal Images (SI), Gramian Angular Field (GAF) Images, Markov Transition Field (MTF) Images and Recurrence Plot (RP) Images.
-
2.
In previous work, analysis is only performed in transform domain i.e frequency domain and time-spectrum domain using Discrete Fourier transform (DFT) and 2D Wavelet transform respectively whereas in presented work, a detailed experimental based analysis for both transform domain and spatial domain is presented. Thus 75% more analysis is carried out in presented work.
-
3.
In previous work, no baseline experiments were performed whereas in presented work, experiments are also performed with two baseline fusion frameworks i.e one baseline in transform domain and other baseline in spatial domain.
-
4.
In previous work only quantitative analysis of the results were presented whereas in presented work, both quantitative and qualitative analysis of the results are presented.
-
5.
The literature review of the presented work is more enriched with recent proposed methods on inertial sensor data for HAR than our previous work.

III Proposed Method
At the input of the proposed fusion framework shown in Fig. 2, we transform the inertial data into activity images. After forming activity images, we made them multimodal by convolving them with Prewitt and high-boost filters. The three modalities i.e activity images, Prewitt filtered activity images and High boost filtered activity images, shown in Fig. 2, are trained simultaneously using three ResNets-18 of same architecture. The learned features are extracted from “ pool5 ” layer of each ResNets-18 and are fused using canonical correlation fusion method. These fused features are finally sent to the SVM classifier for classification task. The SVM classifier is trained separately from the ResNets-18. ResNets-18 are used as feature extractors, SVM is employed for the final classification. We extract features from “ pool5 ” layer because this is the last layer before classification layer and this layer has more learned features than other layers [41].
The block element of proposed model named “Activity Images”, shown in Fig. 2, represents only one kind of activity image at a time. It does not represent the data fusion of four activity images. The only fusion performed in proposed model is the canonical correlation based fusion (CCF) among the activity image and its spatial domain modalities created by Prewitt filter and high boost filter respectively.
Below we explain each component of the proposed fusion framework.
III-A Formation of Activity Images
Since we transform inertial data into four types of activity images, therefore, we first explain the formation of these images.
III-A1 Formation of Signal Images (SI)
The combination of accelerometer and gyroscope provide multivariate time series data consists of six sequences of signals : three acceleration and three angular velocity sequences.
We converted six sequences into 2D images called signal images based on the algorithm in [18]. Signal image is obtained through row-by-row stacking of given six signal sequences in such a way that each sequence appears alongside to every other sequence. The signal images are formed by taking advantage of the temporal correlation among the signals.
Row wise stacking of six sequences has the following order.
123456135246142536152616
Where the numbers 1 to 6 represent the sequence numbers in a raw signal. Order of the sequences clearly shows that every sequence neighbors every other sequence to make a signal image. Thus the final width of signal image becomes 24.
Length of signal image is decided by making use of sampling rate of datasets which is 50Hz for our two datasets. Therefore, to capture granular motion accurately, the length of the signal image is finalized as 52, resulting in a final image size of 24 x 52. These signal images are shown in Fig. 3 and it is observed that each signal image shows unique pattern and thus enhance the performance of classification. Finally, we resize the images to 224 x 224 for training on resnet.

III-A2 Formation of Gramian Angular Field Images (GAF)
The image formed by Gramian Angular Field (GAF) represents time series in a polar coordinate system rather than conventional cartesian coordinate system.
Let be a real valued time series of samples such that . We rescaled to so that the value of each sample in falls between 0 and 1. Now we represent the rescaled time series in polar coordinate system by encoding the value as the angular cosine and the time stamp as the radius. This encoding can be understood by the following equation.
| (1) |
where is the rescaled sample of the time series, is the time stamp and is a constant factor to regularize the span of the polar coordinate system. This transformation has two main advantages. First the transformation is bijective and secondly, it preserves temporal relations through the cordinates [42]. From top-left to bottom-right, the image position corresponds to the raw time series is symmetrical along the main diagonal. Due to this characteristic, the polar coordinates can revert back to the raw time series [43].
The angular perspective of the encoded image can be fully utilized by cosidering the sum/difference between each point to identify the temporal correlation within different time intervals. In this paper we used summation method for Grammian Angular Field and is explained by the following equations
| (2) |
| (3) |
In equation 3, is the unit row vector. Since is the length of inertial time series data, therefore, the three channel GAF images obtained are of size .
GAF Images obtained from inertial data are shown in Fig 4.

III-A3 Formation of Images by Markov Transition Field (MTF)
We used the method described in [44] to encode inertial sensor data into images. Consider the time series such that . The first step is to identify its quantile bins and assign each to the corresponding bins . Next step is to construct a weighted adjacency matrix by counting transitions among quantile bins in the manner of a first-order Markov chain along the time axis. The normalized form of weighted adjacency matrix is called Markov transition matrix and is unsusceptible to the temporal dependencies, resulting in loss of information. In order to deal with this information loss, Markov transition matrix is converted to Markov transition field matrix (MTF) by spreading out the transition probabilities related to the temporal positions. The Markov transition field matrix is given by
| (4) |
Where is the frequency with which a point in quantile is followed by a point in quantile . Since the transformed matrix is formed by the probabilities of element moving, the MTF method cannot revert to the raw time series data like GAF. Since MTF requires the time series to be discretized into quantile bins to calculate the Markov transition matrix, therefore the size of MTF images is .
In this Paper, we use 10 bins for the discretization and encoding of inertial data into images. The images formed by MTF is shown in Fig 5.
III-A4 Formation of Images by Recurrence Plot (RP)
Periodicity and irregular cyclicity are the key recurrent behaviors of time series data. The recurrence plots are used as visualization tool for observing the recurrence structure of a time-series [45]. A recurrence plot (RP) is an image obtained from a multivariate time-series, representing the distances between each time point [46].
Let be a multi-variate time-series. Its recurrence plot is defined as
| (5) |
In equation 5, is threshold and is called heaviside function. Since is the length of inertial time series data, therefore, the three channel RP images obtained are of size .
The images formed by RP is shown in Fig 6.

III-B Multimodal Fusion
Since we have converted inertial data into four kinds of activity images. We experiment with each kind of images using our proposed multimodal fusion framework shown in Fig. 2. For experiments with proposed fusion framework, we made each imaging modality multimodal by convolving with Prewitt and High-boost filter.
III-B1 Creation of Modality Using Prewitt Filter
We create a modality for each kind of activity image by convolving images with the Prewitt filter. Prewitt filters are edge detectors and are simple to implement. Creating additional modality using Prewitt filter has been proved significant for improving the performance of action recognition task as additional modality provide complementary features for fusion [15].
We apply the following 3-by-3 Prewitt filter for creating a modality.
| (6) |
III-B2 Creation of Modality Using High-boost Filter
Another modality is created by convolving each kind of activity images with high-boost filter. High-boost filter assigns proper boosted value to each pixel of image according to its significance [47]. High-boost filter has been used in [48] for watermark recovery in spatial domain by enhancing the dissimilarity between watermarked and unwatermarked parts of the image. High boost filter is a second order derivative filter obtained by subtracting the low pass filtered version of the image from the scaled input image.
| (7) |
where and are the scaled and low pass versions of original image and is called amplification factor that controls the amount of weight given to the images during convolution.
We apply the following 3-by-3 high-boost filter for creating a modality.
| (8) |


III-B3 Canonical Correlation based Fusion (CCF)
After creating modalities, we employ ResNet for extracting features from each modality as shown in Fig. 2. Finally the learned features from “ pool5 ” layer of each ResNet are extracted and fuses in two stages using Canonical correlation based fusion as shown in Fig. 2.
Canonical correlation analysis (CCA) is effective and robust multivariate statistical method for finding the relationship between two sets of variables.
Let and represents the feature matrices from two modalities, where and are the dimensions of the first and second feature set respectively and are the training samples in each modality. let and denote the within set covariance matrices of and respectively and denotes the between set covariance matrix for and and . The overall augmented covariance matrix of size is given by
| (9) |
The purpose of CCA is to find the linear combination and such that the maximum pairwise correlation between the modalities could be achieved. Matrices and are called transformation matrices for and respectively. The correlation between and is given by
| (10) |
where , and . and are known as canonical variates.
Lagrange’s Optimization method is used to maximize the covariance between and subject to the constraint that the variance of and variance of is equal to unity [49].
On the transformed feature vectors, canonical correlation based fusion (CCF) is performed by adding the transformed feature vector. Mathematically this addition is written as
| (11) |
The fused features obtained from equation 11 are served as input to a multi-class Support Vector Machine.
We chose SVM classifier over softmax because in our previous work [50], we experimentally showed that SVM performs better than softmax for HAR. Softmax classifier reduces the crossentropy function while SVM employs a margin-based function. Multiclass SVM classifies data by locating the hyperplane at a position where all data points are classified correctly. Thus, SVM determines the maximum margin among the data points of various classes. The more rigorous nature of classification is likely the reason why SVM performs better than softmax.
IV Experiments and Results
We experiment on three publicly available inertial datasets for human action recognition. These datasets are : Inertial component of UTD Multimodal Human Action Dataset (UTD-MHAD) [51], Heterogeneity Human Activity Recognition Dataset (HHAR) [52] and the inertial component of Kinect V2 dataset [53]. We used subject specific setting for experiments on both datasets by randomly splitting 80% data into training and 20% data into testing samples.
We ran the random split 20 times and report the average accuracy and precision. For training on ResNet-18, we resize the images to 224 x 224 using bicubic interpolation. We conduct our experiments on Matlab R2020a on a desktop computer with NVIDIA GTX-1070 GPU. We train ResNet-18 on images till the validation loss stops decreasing further. In addition to this, momentum of 0.9, initial learn rate of 0.005, regularization of 0.004 and mini-batch size of 32 is used to control overfitting. We reached these values through using the grid search method.
IV-A UTD MHAD Dataset
This dataset consists of 27 different actions performed by 8 subjects with each subject repeating actions 4 times. We only used inertial component of the dataset and convert inertial time series data into activity images as described in section III. We observe that the number of images are less to train ResNet-18. Thus to increase the number of samples we used data augmentation techniques described in [50].
IV-A1 Baseline Experiments
We performed baseline experiments with UTD-MHAD dataset to validate the effect of our proposed fusion framework shown in Fig.2. Two fusion frameworks for baseline experiments are shown in Fig. 7 and Fig. 8 respectively.
The first baseline fusion framework is the same framework proposed in [19]. In this framework, modalities are created using transform domain transformations such as Discrete Fourier transform and Gabor Wavelet transform respectively. Experimental results in Table I show that the performance of signal images is worst in transform domains as compared to spatial domain. The performance of signal images in transform domain adversely effect the performance of CCF as shown in Table I.
The poor performance in transform domain compelled us to redesign the fusion framework. To improve the performance and to create the modalities in spatial domain, we transform inertial data into GAF, MTF and RP images, as described in section III, and design an spatial domain fusion framework shown in Fig. 8. We used GAF, MTF and RP images in the second baseline fusion framework because we obtained higher accuracy with this combination. With second baseline framework, we obtained an increase in accuracy of 0.8%.
| Methods | Accuracies% |
| Signal Images only | 94.2 |
| FFT Signal Images | 85.6 |
| Gabor Signal Images | 87.7 |
| CCA Fusion (Baseline 1) | 96.7 |
| CCA Fusion (Baseline 2) | 97.5 |
| Decision level Fusion( GAF-MTF-RP) | 95.3 |
| Inertial data with LSTM [15] | 86 |
| Inertial data with 1D-CNN [15] | 77 |
IV-A2 Experiments with Proposed Fusion Framework
Increased performance of second baseline framework motivated us to further improved the fusion framework. Exemplary performance of Prewitt filter in creating modality in [15] and high-boost filter in [47] encouraged us to use these filters for creating modalities as shown in Fig. 2. We perform experiments with the proposed fusion framework using all activity images obtained from inertial data. The experimental results in terms of recognition accuracy and precision are shown in Table II. It is observed that proposed fusion framework beats the baseline experiments convincingly with all kinds of activity images. The accuracies and precisions are calculated using following equations.
| (12) |
| (13) |
where,
= True positive
= True negative
= False positive
= False negative
Comparison of Accuracies of proposed method with previous methods on inertial component of UTD-MHAD dataset is shown in Table III.
Image Type Methods Accuracies% Precision% Signal Images Signal Images only 94.1 94.1 Prewitt filtered Signal Images 93 93.1 High boost filtered Signal Images 95.2 95.3 Proposed CCA based Fusion 97.8 97.9 GAF Images GAF Images only 94.7 94.8 Prewitt filtered GAF Images 94.1 94 High boost filtered GAF Images 96 96.1 Proposed CCA based Fusion 98.3 98.4 MTF Images MTF Images only 94.1 94 Prewitt filtered MTF Images 93.2 93.1 High boost filtered MTF Images 95.2 95.2 Proposed CCA based Fusion 98 98 RP Images RP Images only 94.4 94.4 Prewitt filtered RP Images 94 94 High boost filtered RP Images 95.8 95.9 Proposed CCA based Fusion 98.2 98.3
| Previous Methods | Accuracy% |
| Ranieri et al. [30] | 76 |
| Das et al. [29] | 85.4 |
| Chen et al. [37] | 88.3 |
| Ehatisham et al. [4] | 91.6 |
| Z.Ahmad et al. [50] | 93.7 |
| Z.Ahmad et al. [19] | 95.8 |
| CCA Fusion (Baseline01) | 96.7 |
| CCA Fusion (Baseline 02) | 97.5 |
| Proposed CCA Fusion (GAF Images) | 98.3 |
IV-B Heterogeneity Human Activity Recognition Dataset
This dataset consists of six actions and is collected through nine users. All users followed a scripted set of activities while carrying eight smartphones (2 instances of LG Nexus 4, Samsung Galaxy S+ and Samsung Galaxy S3 and S3 mini) and four smart watches (2 instances of LG G and Samsung Galaxy Gear). These smart phones and smart watches are worn by the participents at their waists and arms respectively. Each participant conducted five minutes of each activity, which ensured a near equal data distribution among activity classes (for each user and device). We perform same experiments with this dataset, using our proposed fusion framework shown in Fig. 2, as we did with UTD-MHAD. The experimental results are shown in Table IV
Image Type Methods Accuracies% Precision% Signal Images Signal Images only 95.9 95.9 Prewitt filtered Signal Images 93.8 93.8 High boost filtered Signal Images 96.7 96.7 Proposed CCA based Fusion 98.3 98.3 GAF Images GAF Images only 96.1 96.1 Prewitt filtered GAF Images 94.9 94.9 High boost filtered GAF Images 97.1 97.1 Proposed CCA based Fusion 99.1 99.1 MTF Images MTF Images only 95.9 95.9 Prewitt filtered MTF Images 94.1 94.1 High boost filtered MTF Images 96.8 96.2 Proposed CCA based Fusion 98.8 98.8 RP Images RP Images only 96.1 96.1 Prewitt filtered RP Images 94.7 94.7 High boost filtered RP Images 96.9 96.9 Proposed CCA based Fusion 99 99
Comparison of Accuracies of proposed method with previous methods on HHAR dataset is shown in Table V.
IV-C Kinect V2 Dataset
We use only inertial modality of KinectV2 action dataset. It contains 10 actions performed by six subjects with each subject repeating the action 5 times. We perform same experiments with this dataset, using our proposed fusion framework shown in Fig. 2, as we did with two previous datasets. The experimental results are shown in Table VI.
Image Type Methods Accuracies% Precision% Signal Images Signal Images only 96.8 96.9 Prewitt filtered Signal Images 95.4 95.5 High boost filtered Signal Images 97.9 98 Proposed CCA based Fusion 98.9 99 GAF Images GAF Images only 97.2 97.3 Prewitt filtered GAF Images 96 96.1 High boost filtered GAF Images 98.4 98.5 Proposed CCA based Fusion 99.5 99.5 MTF Images MTF Images only 96.9 96.9 Prewitt filtered MTF Images 95.7 95.7 High boost filtered MTF Images 98.1 98.1 Proposed CCA based Fusion 99.2 99.2 RP Images RP Images only 97.1 97.2 Prewitt filtered RP Images 96 96.1 High boost filtered RP Images 98.2 98.3 Proposed CCA based Fusion 99.4 99.5
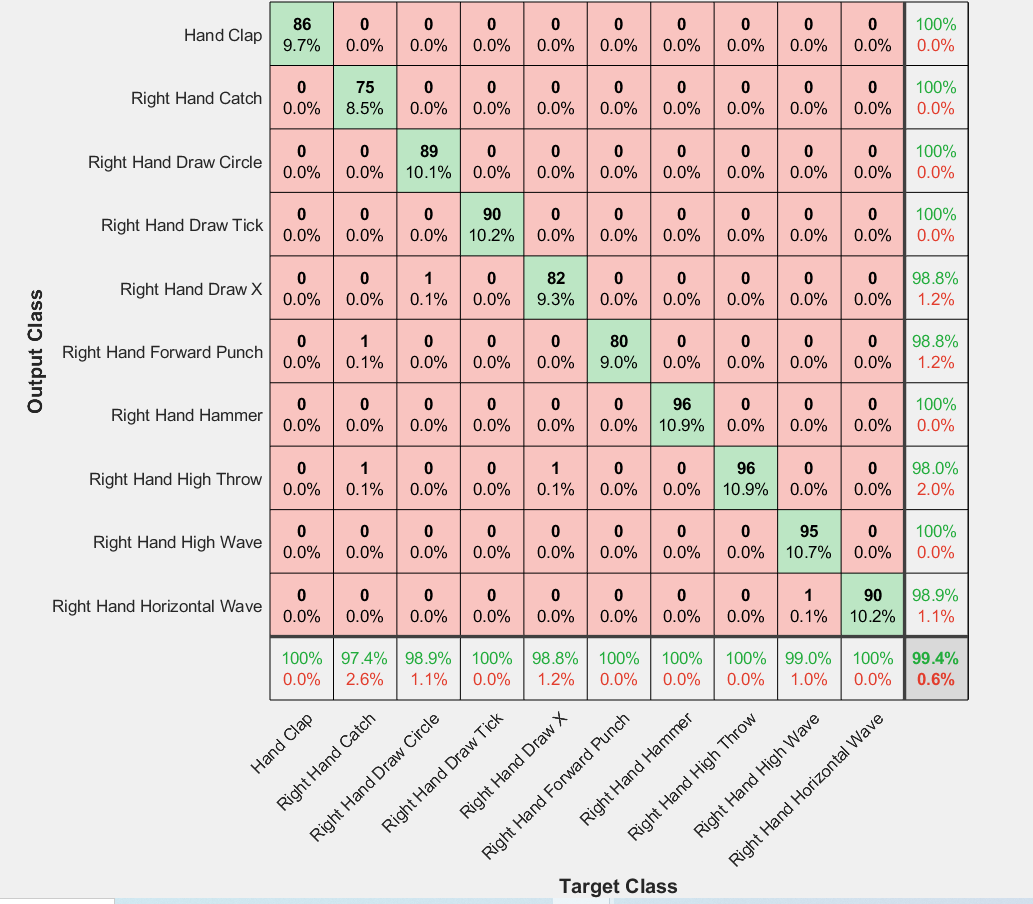
Comparison of Accuracies of proposed method with previous methods on inertial component of Kinect V2 dataset is shown in Table VII. The confusion Matrix of Kinect V2 dataset using proposed method for RP images is shown in Fig. 10.
| Previous Methods | Accuracy% |
| Chen et al. [53] | 96.7 |
| Z.Ahmad et al. [50] | 96.7 |
| Z.Ahmad et al. [19] | 98.3 |
| Proposed CCA Fusion (GAF Images) | 99.5 |

IV-D Discussion on Results
The experimental results of ablation studies, shown in Tables II, IV and VI, prove that the proposed method perform better than the baseline experiments shown in Table I.
In the first baseline framework, modalities are created using transform domain methods. These methods could not accurately model the spatial domain abrupt changes in the original data and thus leading to lower accuracy during classification. In second baseline framework, modalities are spatial domain and thus we get improved performance. To build on this increased performance, we design the proposed fusion framework shown in Fig. 2 using Prewitt and high-boost filters. During convolution, these filters enhance the most important specifics of the image and thus lead to better performance than the second baseline framework.
IV-E Qualitative Analysis of Results
For qualitative analysis, we construct feature visualizations of Kinect V2 datset for GAF images using t-SNE [55] as shown in Fig. 9. In Fig. 9(a), features are shown without fusion and we observe that the classes seem to be inseparable. In Fig. 9(b), we see that features are distinctly separated and these distinct features improve the performance of a classifier and thus highest recognition accuracy is achieved. Since CCF helps in separating the feature space in a more distinctive manner, we believe that the application of the proposed framework may help improving performance in other application areas as well.
V Conclusion
In this paper, we used four spatial domain methods of transforming inertial sensor data for Human Action Recognition (HAR) into actvity images. These four types of activity images are Signal Images (SI), Gramian Angular Field (GAF) Images, Markov Transition Field (MTF) Images and Recurrence Plot (RP) Images. We made each type of activity image multimodal by convolving with two spatial domain filters called Prewitt filter and High-boost filter. ResNet-18 are used to extract features from each modality. Learned features from resnet are extracted and fused by canonical correlation based fusion (CCF) for improving the accuracy of human action recognition. Experimental results on three publicly available inertial datasets show the superiority of the proposed method over the current state-of-the-art.
References
- [1] P. Corbishley and E. Rodriguez-Villegas, “Breathing detection: towards a miniaturized, wearable, battery-operated monitoring system,” IEEE Transactions on Biomedical Engineering, vol. 55, no. 1, pp. 196–204, 2007.
- [2] C. Dhiman and D. K. Vishwakarma, “A robust framework for abnormal human action recognition using -Transform and Zernike moments in depth videos,” IEEE Sensors Journal, vol. 19, no. 13, pp. 5195–5203, 2019.
- [3] G. Zhu, C. Xu, Q. Huang, Y. Rui, S. Jiang, W. Gao, and H. Yao, “Event tactic analysis based on broadcast sports video,” IEEE Transactions on Multimedia, vol. 11, no. 1, pp. 49–67, 2008.
- [4] M. Ehatisham-Ul-Haq, A. Javed, M. A. Azam, H. M. Malik, A. Irtaza, I. H. Lee, and M. T. Mahmood, “Robust human activity recognition using multimodal feature-level fusion,” IEEE Access, vol. 7, pp. 60 736–60 751, 2019.
- [5] L. Bao and S. S. Intille, “Activity recognition from user-annotated acceleration data,” in International conference on pervasive computing. Springer, 2004, pp. 1–17.
- [6] A. Krause, D. P. Siewiorek, A. Smailagic, and J. Farringdon, “Unsupervised, dynamic identification of physiological and activity context in wearable computing.” in ISWC, vol. 3, 2003, p. 88.
- [7] T. Plötz, N. Y. Hammerla, and P. L. Olivier, “Feature learning for activity recognition in ubiquitous computing,” in Twenty-second international joint conference on artificial intelligence, 2011.
- [8] Z. Ahmad, K. Illanko, N. Khan, and D. Androutsos, “Human action recognition using convolutional neural network and depth sensor data,” in Proceedings of the 2019 International Conference on Information Technology and Computer Communications, 2019, pp. 1–5.
- [9] A. Krizhevsky, I. Sutskever, and G. E. Hinton, “Imagenet classification with deep convolutional neural networks,” in Advances in neural information processing systems, 2012, pp. 1097–1105.
- [10] M. Edel and E. Köppe, “Binarized-blstm-rnn based human activity recognition,” in 2016 International conference on indoor positioning and indoor navigation (IPIN). IEEE, 2016, pp. 1–7.
- [11] H. Fang and C. Hu, “Recognizing human activity in smart home using deep learning algorithm,” in Proceedings of the 33rd chinese control conference. IEEE, 2014, pp. 4716–4720.
- [12] N. Hammerla, T. Ploetz, L. Rochester, J. Fisher, R. Walker, P. Andras et al., “Pd disease state assessment in naturalistic environments using deep learning,” 2015.
- [13] B. Almaslukh, J. AlMuhtadi, and A. Artoli, “An effective deep autoencoder approach for online smartphone-based human activity recognition,” Int. J. Comput. Sci. Netw. Secur, vol. 17, no. 4, pp. 160–165, 2017.
- [14] Y. Chen and Y. Xue, “A deep learning approach to human activity recognition based on single accelerometer,” in 2015 ieee international conference on systems, man, and cybernetics. IEEE, 2015, pp. 1488–1492.
- [15] Z. Ahmad and N. Khan, “Human action recognition using deep multilevel multimodal (m2) fusion of depth and inertial sensors,” IEEE Sensors Journal, vol. 20, no. 3, pp. 1445–1455, 2019.
- [16] C. Chen, R. Jafari, and N. Kehtarnavaz, “Improving human action recognition using fusion of depth camera and inertial sensors,” IEEE Transactions on Human-Machine Systems, vol. 45, no. 1, pp. 51–61, 2015.
- [17] N. Dawar and N. Kehtarnavaz, “Action detection and recognition in continuous action streams by deep learning-based sensing fusion,” IEEE Sensors Journal, vol. 18, no. 23, pp. 9660–9668, 2018.
- [18] W. Jiang and Z. Yin, “Human activity recognition using wearable sensors by deep convolutional neural networks,” in Proceedings of the 23rd ACM international conference on Multimedia. Acm, 2015, pp. 1307–1310.
- [19] Z. Ahmad and N. M. Khan, “Multidomain multimodal fusion for human action recognition using inertial sensors,” in 2019 IEEE Fifth International Conference on Multimedia Big Data (BigMM). IEEE, 2019, pp. 429–434.
- [20] K. He, X. Zhang, S. Ren, and J. Sun, “Deep residual learning for image recognition,” in Proceedings of the IEEE conference on computer vision and pattern recognition, 2016, pp. 770–778.
- [21] C. Wang, J. Zhang, Z. Wang, and J. Wang, “Position-independent activity recognition model for smartphone based on frequency domain algorithm,” in Proceedings of 2013 3rd International Conference on Computer Science and Network Technology. IEEE, 2013, pp. 396–399.
- [22] D. Shah, P. Falco, M. Saveriano, and D. Lee, “Encoding human actions with a frequency domain approach,” in 2016 IEEE/RSJ International Conference on Intelligent Robots and Systems (IROS). IEEE, 2016, pp. 5304–5311.
- [23] N. Tufek, M. Yalcin, M. Altintas, F. Kalaoglu, Y. Li, and S. K. Bahadir, “Human action recognition using deep learning methods on limited sensory data,” IEEE Sensors Journal, 2019.
- [24] L. Ciabattoni, G. Foresi, A. Monteriù, D. P. Pagnotta, L. Romeo, L. Spalazzi, and A. De Cesare, “Complex activity recognition system based on cascade classifiers and wearable device data,” in 2018 IEEE International Conference on Consumer Electronics (ICCE). IEEE, 2018, pp. 1–2.
- [25] H. Xu, J. Li, H. Yuan, Q. Liu, S. Fan, T. Li, and X. Sun, “Human activity recognition based on gramian angular field and deep convolutional neural network,” IEEE Access, 2020.
- [26] M. Abdel-Basset, H. Hawash, V. Chang, R. K. Chakrabortty, and M. Ryan, “Deep learning for heterogeneous human activity recognition in complex iot applications,” IEEE Internet of Things Journal, 2020.
- [27] J. Lu and K.-Y. Tong, “Robust single accelerometer-based activity recognition using modified recurrence plot,” IEEE Sensors Journal, vol. 19, no. 15, pp. 6317–6324, 2019.
- [28] Z. Qin, Y. Zhang, S. Meng, Z. Qin, and K.-K. R. Choo, “Imaging and fusing time series for wearable sensor-based human activity recognition,” Information Fusion, vol. 53, pp. 80–87, 2020.
- [29] A. Das, P. Sil, P. K. Singh, V. Bhateja, and R. Sarkar, “Mmhar-ensemnet: A multi-modal human activity recognition model,” IEEE Sensors Journal, 2020.
- [30] C. M. Ranieri, P. A. Vargas, and R. A. Romero, “Uncovering human multimodal activity recognition with a deep learning approach,” in 2020 International Joint Conference on Neural Networks (IJCNN). IEEE, 2020, pp. 1–8.
- [31] Y. Hu, X.-Q. Zhang, L. Xu, F. X. He, Z. Tian, W. She, and W. Liu, “Harmonic loss function for sensor-based human activity recognition based on lstm recurrent neural networks,” IEEE Access, vol. 8, pp. 135 617–135 627, 2020.
- [32] J. Zhu, H. Chen, and W. Ye, “Classification of human activities based on radar signals using 1d-cnn and lstm,” in 2020 IEEE International Symposium on Circuits and Systems (ISCAS). IEEE, 2020, pp. 1–5.
- [33] C. Wang, H. Luo, F. Zhao, and Y. Qin, “Combining residual and lstm recurrent networks for transportation mode detection using multimodal sensors integrated in smartphones,” IEEE Transactions on Intelligent Transportation Systems, 2020.
- [34] J. Wang, Y. Chen, S. Hao, X. Peng, and L. Hu, “Deep learning for sensor-based activity recognition: A survey,” Pattern Recognition Letters, 2018.
- [35] Y. Liu, G. Li, and L. Lin, “Semantics-aware adaptive knowledge distillation for sensor-to-vision action recognition,” arXiv preprint arXiv:2009.00210, 2020.
- [36] N. Dawar and N. Kehtarnavaz, “Real-time continuous detection and recognition of subject-specific smart tv gestures via fusion of depth and inertial sensing,” IEEE Access, vol. 6, pp. 7019–7028, 2018.
- [37] C. Chen, R. Jafari, and N. Kehtarnavaz, “A real-time human action recognition system using depth and inertial sensor fusion,” IEEE Sensors Journal, vol. 16, no. 3, pp. 773–781, 2016.
- [38] N. Dawar, S. Ostadabbas, and N. Kehtarnavaz, “Data augmentation in deep learning-based fusion of depth and inertial sensing for action recognition,” IEEE Sensors Letters, vol. 3, no. 1, pp. 1–4, 2019.
- [39] I. Hwang, G. Cha, and S. Oh, “Multi-modal human action recognition using deep neural networks fusing image and inertial sensor data,” in 2017 IEEE International Conference on Multisensor Fusion and Integration for Intelligent Systems (MFI). IEEE, 2017, pp. 278–283.
- [40] H. Wei and N. Kehtarnavaz, “Simultaneous utilization of inertial and video sensing for action detection and recognition in continuous action streams,” IEEE Sensors Journal, 2020.
- [41] Extracting image features from pretrained netwrok. [Online]. Available: https://www.mathworks.com/help/deeplearning/ug/extract-image-features-using-pretrained-network.html
- [42] Z. Wang and T. Oates, “Imaging time-series to improve classification and imputation,” in Twenty-Fourth International Joint Conference on Artificial Intelligence, 2015.
- [43] C.-L. Yang, Z.-X. Chen, and C.-Y. Yang, “Sensor classification using convolutional neural network by encoding multivariate time series as two-dimensional colored images,” Sensors, vol. 20, no. 1, p. 168, 2020.
- [44] Z. Wang and T. Oates, “Encoding time series as images for visual inspection and classification using tiled convolutional neural networks,” in Workshops at the Twenty-Ninth AAAI Conference on Artificial Intelligence, 2015.
- [45] J. Eckmann, S. O. Kamphorst, D. Ruelle et al., “Recurrence plots of dynamical systems,” World Scientific Series on Nonlinear Science Series A, vol. 16, pp. 441–446, 1995.
- [46] Recuplots and cnns for time-series classification. [Online]. Available: https://www.kaggle.com/tigurius/recuplots-and-cnns-for-time-series-classification
- [47] Z. Ahmad and N. Khan, “Cnn based multistage gated average fusion (mgaf) for human action recognition using depth and inertial sensors,” IEEE Sensors Journal, 2020.
- [48] M. Alirezanejad, V. Saffari, S. Amirgholipour, and A. M. Sharifi, “Effect of locations of using high boost filtering on the watermark recovery in spatial domain watermarking,” Indian Journal of Science and Technology, vol. 7, no. 4, p. 517, 2014.
- [49] V. Uurtio, J. M. Monteiro, J. Kandola, J. Shawe-Taylor, D. Fernandez-Reyes, and J. Rousu, “A tutorial on canonical correlation methods,” ACM Computing Surveys (CSUR), vol. 50, no. 6, p. 95, 2018.
- [50] Z. Ahmad and N. Khan, “Towards improved human action recognition using convolutional neural networks and multimodal fusion of depth and inertial sensor data,” in 2018 IEEE International Symposium on Multimedia (ISM). IEEE, 2018, pp. 223–230.
- [51] C. Chen, R. Jafari, and N. Kehtarnavaz, “Utd-mhad: A multimodal dataset for human action recognition utilizing a depth camera and a wearable inertial sensor,” in 2015 IEEE International conference on image processing (ICIP). IEEE, 2015, pp. 168–172.
- [52] A. Stisen, H. Blunck, S. Bhattacharya, T. S. Prentow, M. B. Kjærgaard, A. Dey, T. Sonne, and M. M. Jensen, “Smart devices are different: Assessing and mitigatingmobile sensing heterogeneities for activity recognition,” in Proceedings of the 13th ACM Conference on Embedded Networked Sensor Systems. ACM, 2015, pp. 127–140.
- [53] C. Chen, R. Jafari, and N. Kehtarnavaz, “Fusion of depth, skeleton, and inertial data for human action recognition,” in 2016 IEEE international conference on acoustics, speech and signal processing (ICASSP). IEEE, 2016, pp. 2712–2716.
- [54] S. Yao, S. Hu, Y. Zhao, A. Zhang, and T. Abdelzaher, “Deepsense: A unified deep learning framework for time-series mobile sensing data processing,” in Proceedings of the 26th International Conference on World Wide Web. International World Wide Web Conferences Steering Committee, 2017, pp. 351–360.
- [55] L. v. d. Maaten and G. Hinton, “Visualizing data using t-sne,” Journal of machine learning research, vol. 9, no. Nov, pp. 2579–2605, 2008.
![[Uncaptioned image]](https://cdn.awesomepapers.org/papers/6fc1b003-8ffe-463c-b233-7989f4db1297/Zeeshan_Image.jpg) |
Zeeshan Ahmad received B.Eng. degree in Electrical Engineering from NED University of Engineering and Technology Karachi, Pakistan in 2001, M.Sc. degree in Electrical Engineering from National University of Sciences and Technology Pakistan in 2005 and MEng. degree in Electrical and Computer Engineering from Ryerson University, Toronto, Canada in 2017. He is currently pursuing Ph.D. degree with the Department of Electrical and Computer Engineering, Ryerson University, Toronto, Canada. His research interests include Machine learning, Computer vision, Multimodal fusion, signal and image processing. |
![[Uncaptioned image]](https://cdn.awesomepapers.org/papers/6fc1b003-8ffe-463c-b233-7989f4db1297/nkhan.jpg) |
Naimul Khan is an assistant professor of Electrical and Computer Engineering at Ryerson University, where he co-directs the Ryerson Multimedia Research Laboratory (RML). His research focuses on creating user-centric intelligent systems through the combination of novel machine learning and human-computer interaction mechanisms. He is a recipient of the best paper award at the IEEE International Symposium on Multimedia, the OCE TalentEdge Postdoctoral Fellowship, and the Ontario Graduate Scholarship. He is a senior member of IEEE and a member of ACM. |