Indicators of wavefunction (de)localisation for avoided crossing in a quadrupole quantum billiard
Abstract
The relationship between wavefunction (de)localisation and avoided crossing in a quadrupole billiard is analysed The following three-types of measures are employed for wavefunction (de)localisation: inverse participation ratio, inverse of Rényi entropy, and root-mean-square (RMS) image contrast. All these measures exhibit minimal values at the centre of the avoided crossing, where the wavefunction is maximally delocalised. Our results indicate that these quantities can be sufficient for the indication of wavefunction (de)localisation.
-
June 2021
Keywords: avoided crossing, wavefunction (de)localisation, Rényi entropy, inverse participation ratio, image contrast
1 Introduction
Avoided crossing is a phenomenon in which two eigenvalues of the Hamiltonian of a quantum system come closer when a system parameter is varied, but they repel each other [1]. Since the introduction of quantum mechanics, avoided crossing has been fundamental because it manifests the presence of subtle interactions between states in the quantum system. It has been extensively studied in various physical systems such as nanowires [2, 3], crystalline solids [4], topological magnons [5], charged ions [6], and quantum billiards [7, 8]. Particularly in the case of cavity resonators (related to avoided crossing), several intriguing physical properties of exceptional points [9, 10], unidirectional emission [11], and dynamical tunnelling [12] have been explored. Avoided crossing is basically considered based on the behaviour of eigenvalues [1]. However, in general, the behaviours of the wavefunctions also undergo certain changes from the influence of avoided crossing [13, 14, 15]. Here, we examine this issue in the framework of the wavefunction (de)localisation.
Localisation or delocalisation is a useful notion to probe spatial features and also determine essential physical properties. For example, conductance in condensed matter physics [16, 17] is controlled by the degree of localisation; the localised and delocalised electron wavefunctions correspond to the insulators and conductors, respectively. Anderson localisation has been investigated for systems such as aperiodic super lattices [18] and monolayer graphene [19]. In quantum billiard problems, wavefunction localisation is also an important issue for the scar, which refers to the wavefunction localisation on unstable periodic orbits in the semi-classical limit [20]. Numerous scar phenomena have been observed in various chaotic systems such as molecular systems, atomic systems, and micro-cavities [21, 22, 23]. Following these pioneering studies, the study of quasi-scars [24, 25] (without any association with classical periodic orbits) as well as scar-like modes in integrable systems [26, 27] were conducted. Furthermore, localisation associated with chaotic diffusion has also been studied [28, 29].
In our previous studies [30, 31], we investigated the Shannon entropy and its relation to avoided crossing in the microcavity. We found that the Shannon entropies increase as the centre of the avoided crossing is approached, and are exchanged across the avoided crossing. The definition of Shannon entropy is a relevant measure of the average amount of information for a random variable with a specific probability distribution [32]; however, the physical meaning of Shannon entropy in our system still remains unclear. Therefore, we elucidate it in the view point of the wavefunction (de)localisation in this work. For this purpose, we study the relation between the Shannon entropy to inverse participation ratio [33, 34], Rényi entropy [35, 36] and the root-mean-square (RMS) image contrast [37, 38, 39].
The remainder of this paper is organised as follows. In Sec. 2, the avoided crossing of two interacting modes in a quadrupole billiard is introduced. In Sec. 3, we study the inverse participation ratio. The Rényi entropy is discussed in Sec. 4. The RMS contrast is studied in Sec. 5. In Sec. 6, we compare the three measures based on the wavefunction delocalisation. Finally, we summarise our work in Sec. 7.
2 Avoided Crossing of Two Interacting Modes
Now, we consider a closed quadrupole cavity as a model for the chaotic billiard in order to study the avoided crossing; the non-linearity in a chaotic system leads to the avoided crossing [40, 41]. The geometric shape of the quadrupole is precisely described by , where is the deformation parameter and is the angle in the polar coordinate. The pre-factor is adopted for an area-preserving condition. We obtain the eigenvalues and their wavefunctions by solving the Helmholtz equation equipped with the boundary element method [42] for the transverse magnetic modes. We used the Dirichlet boundary conditions for closed (billiard) systems. Here, denotes the (vacuum) wavenumber, is the refractive index of the cavity whose value is in this paper and is the vertical component of the electric field. Note that the wavenumber and their resonances in the Helmholtz equation play the role of eigenvalues and their wavefunctions, respectively.
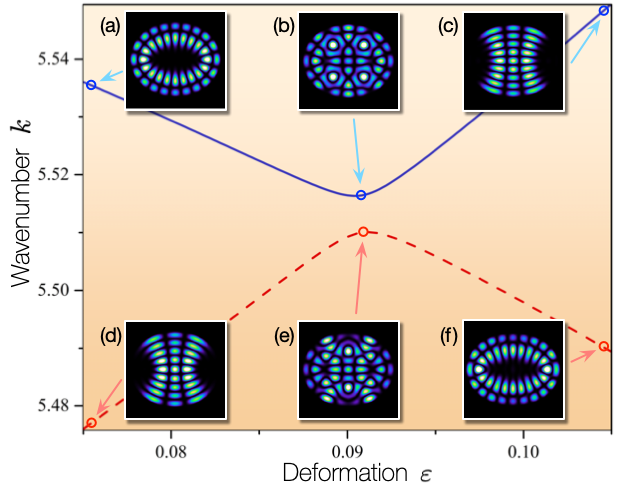
In figure 1, the eigenvalues (i.e., wavenumbers) of two interacting modes (denoted by red dashed and blue solid lines) and the intensities of representative wavefunctions [(a), (b), (c), (d), (e), and (f)], as a function of the deformation parameter , are plotted in the restricted range . In this range, the phase space shows soft chaos (the transition region between regular and chaotic system). In particular, eigenstates (a), (d), (c), and (f) are associated with regular invariant torus. The avoided crossing occurs at . We can also observe that the wavefunctions corresponding to (a) and (d) are mixing together at (b) and (e) in the state of the coherent superposition of wavefunctions. Subsequently, they exhibit an exchanging pattern of wavefunctions at (c) and (f). Here, we investigate the features of this avoided crossing by considering wavefunction (de)localisation.
3 Analysis of the Inverse Participation Ratio
The inverse participation ratio is widely employed in percolation systems [43], flat bands [44], and quantum chaos [45] to quantify the degree of localisation of the wavefunction with given probability distributions. It is defined by the summation (or integral) over the square of the probability density in the position and momentum space (or phase space). In the case of position space, we can simply define the formula as follows:
| (1) |
where . To apply to our quadrupole system, we normalise the intensity of the wavefunction as . Here, is the total number of mesh points for the cavity area, and we assume that it corresponds to an effective basis set for the position space. The inverse participation ratio has a maximal value of when the wavefunction is localised at the specific basis state , owing to the fact that .
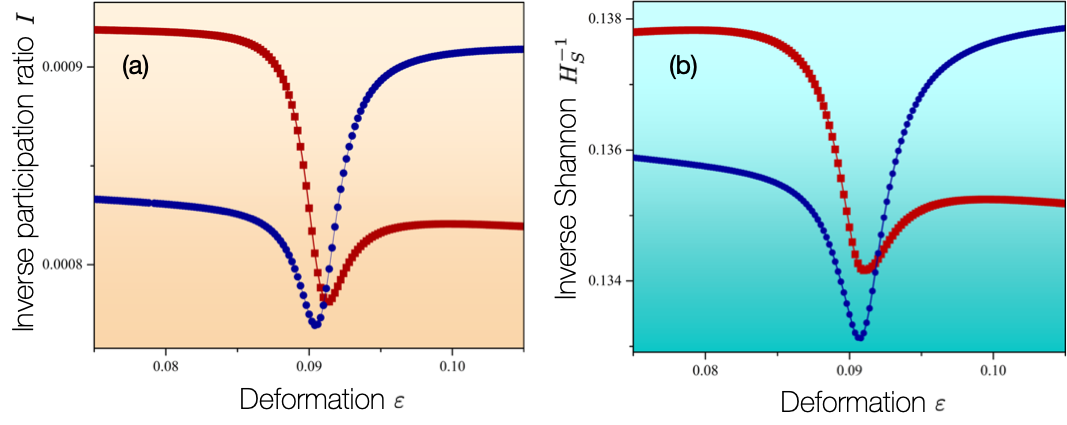
Figure 2(a) presents a plot of the inverse participation ratio of the normalised intensity distributions for the two interacting modes in figure 1. The values of that are distant from the centre of the avoided crossing have relatively higher values than those at the centre of the avoided crossing. In other words, the values of decrease when the centre of the avoided crossing is approached. This directly indicates that the wavefunction localisation of two interacting modes increases when the mixing of the wavefunction decreases (i.e., moving away from the centre of avoided crossing).
The inverse Shannon entropy of the intensity distributions of the two interacting modes (in figure1) is shown in figure2(b) for a relative comparison. The Shannon entropy was obtained in a similar manner as in our previous studies [30, 31], that is, . Note, that the Shannon entropy is a relevant measure of the average amount of information content, and we used it as a measure of the degree of uniformity for a given mode pattern. However, we confirm that the Shannon entropy can also be used to measure the wavefunction (de)localisation of the mode pattern; in panel (b) displays a similar trend with in panel (a) in figure2.
4 Quantifying the Delocalisation from Rényi Entropy
Intuitively, the inverse of the inverse participation ratio can be a natural measure of delocalisation. However, we consider the logarithm of instead of , which enables us to extend the concept of delocalisation to the information theory.
To achieve this, we first introduce the definition of Rényi entropy [35, 36], which is a generalisation of the Shannon entropy, Hartley entropy, min-entropy, and collision entropy [35]. The definition of order Rényi entropy for a discrete probability distribution (with and ) is given by
| (2) |
under a normalisation condition such that . Note that, the logarithm of is equal to the Rényi entropy with ; that is, . In this manner, the delocalisation measured by the inverse of the inverse participation ratio is related to the concept of entropy. Furthermore, the limiting case of , as , is the Shannon entropy in the form of
| (3) |
It can be easily proven using the L’Hôspital rule as follows: , where and , and their derivatives and , respectively.
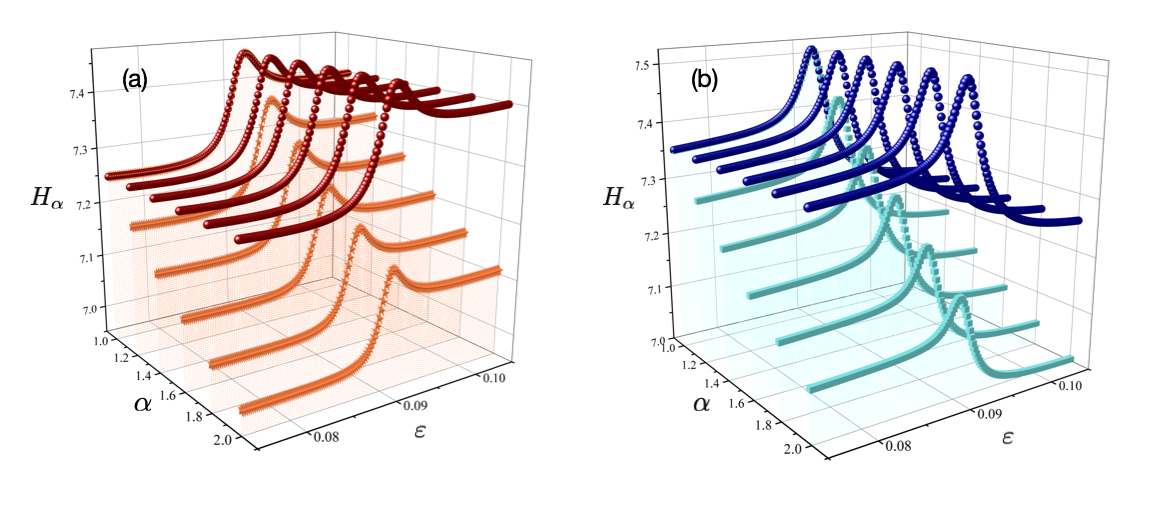
We make use of the Rényi entropy to study the wavefunction (de)localisation for avoided crossing in figure1; the explicit results are shown in figure3. As shown in figure3(a), the red spheres and orange stars correspond to the cases of Shannon entropy () and Rényi entropy (), respectively, for =2.0, 1.8, 1.6, 1.4, 1.2, and 1.001. Both can be obtained from the normalised intensity distributions of the red mode in figure1, and these are maximised at the centre of the avoided crossing point (i.e., ) for each . The profiles converge to as approaches , which confirms Eq. (3). In addition, and in panel (b) were observed to behave similar to those in panel (a) in figure3.
Moreover, when does not converge to (the Shannon entropy), particularly when we compare the Rényi entropy at with the Shannon entropy, we can easily observe that their profiles are significantly similar to each other, despite their absolute values being different. This fact reveals that Shannon entropy can also be a useful method to quantify the wavefunction (de)localisation for avoided crossing in a quantum billiard.
5 Root-Mean-Square Image Contrast
In this section, we assume that the effective basis for the position space corresponds to the pixel of the morphology (or image) of the wavefunction. Then, we can exploit the wavefunction intensity as the pixel intensity of the image of the wavefunction. In doing so, the measure of wavefunction (de)localisation can be converted into the measure of the intensity contrast of the image.
For this approach, we introduce the RMS contrast [37, 38, 39] in terms of the pixel intensity defined as follows:
| (4) |
where is the average of all pixel intensities in the image, is the th pixel intensity, and is the total number of pixels. Contrary to other contrast measures, the RMS contrast does not depend on the specific morphology of the image. That is, we can quantitatively compare the contrast having different morphologies by using RMS contrast [37, 38, 39]. Figure 4 presents the results.
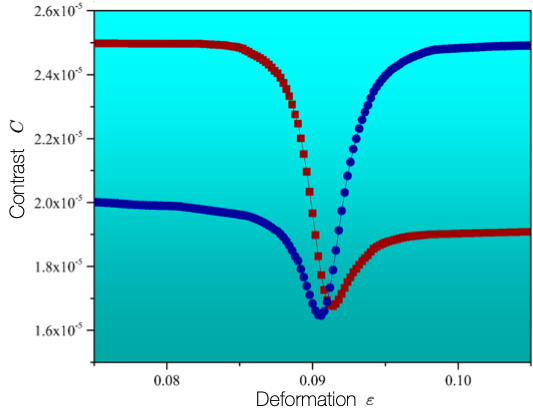
The RMS contrast of the pixel intensity of the wavefunctions for two interacting modes in figure 1 is shown in figure 4. The two values (indicated by red squares and blue circles) of decrease as the centre of the avoided crossing is approached, and they are exchanged across the avoided crossing. This behaviour is also significantly similar to the inverse participation ratio in figure 2(a). Thus, the RMS contrast , which is more intuitive and practical, can be used as a measure of the wavefunction (de)localisation property.
6 Comparison of Three-Type Measures
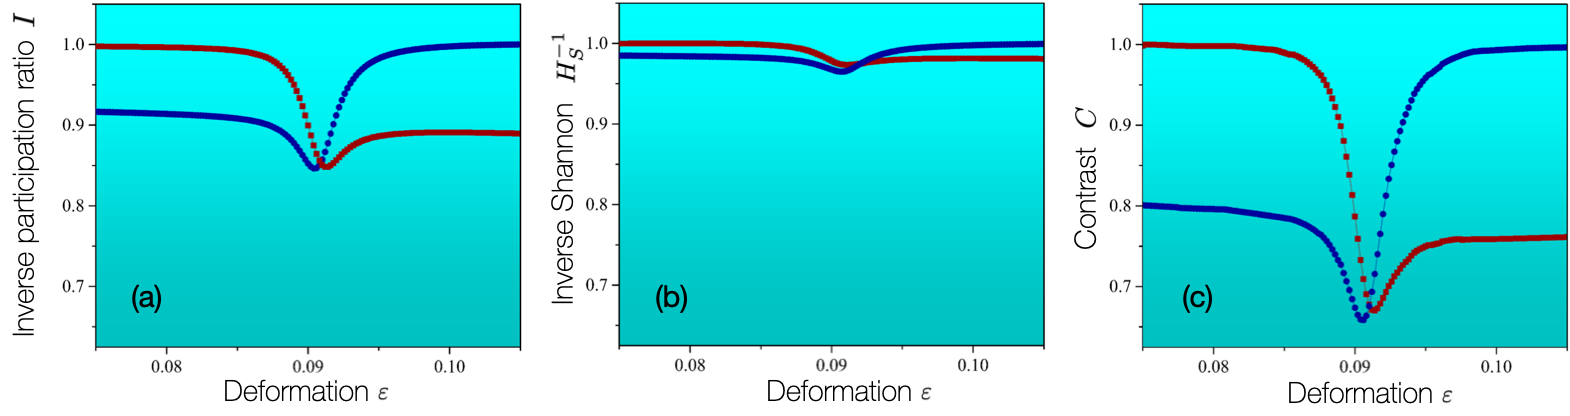
The inverse participation ratio , inverse of the Shannon entropy , and RMS contrast , are compared. These quantities are shown in figures 5(a), 5(b), and 5(c), respectively. For a fair comparison, we consider that all quantities must be normalised to their maximal values (See the caption in figure 5). It is clearly observed that all of them behave in a similar manner. That is, they are minimised at the centre of the avoided crossing and are also exchanged across the centre of the avoided crossing. These results indicate that and can also be meaningful indicators for wavefunction (de)localisation along with . Furthermore, we observe that the difference between the maximal and minimal values of is larger than those of the other two quantities. Thus, we can consider that is the most sensitive measure at least in our conducted numerical study (not in general case).
However, each quantity has its advantages. The inverse participation ratio is well defined in the position space, momentum space, or in the total phase space [45]. We can extend the wavefunction (de)localisation to the information theory by addressing , whereas may be a useful tool for interpreting the wavefunction (de)localisation in the framework of image processing tasks. In addition, the localisation measures in previous work [45] are related to those in this paper but are different. Those in the work [45] are defined on the phase space and are suitable for analysing the chaotic eigenfunctions whereas our measures are defined on the position space and are more suitable for analysing the effect of the mixing of wavefunctions under the avoided crossings.
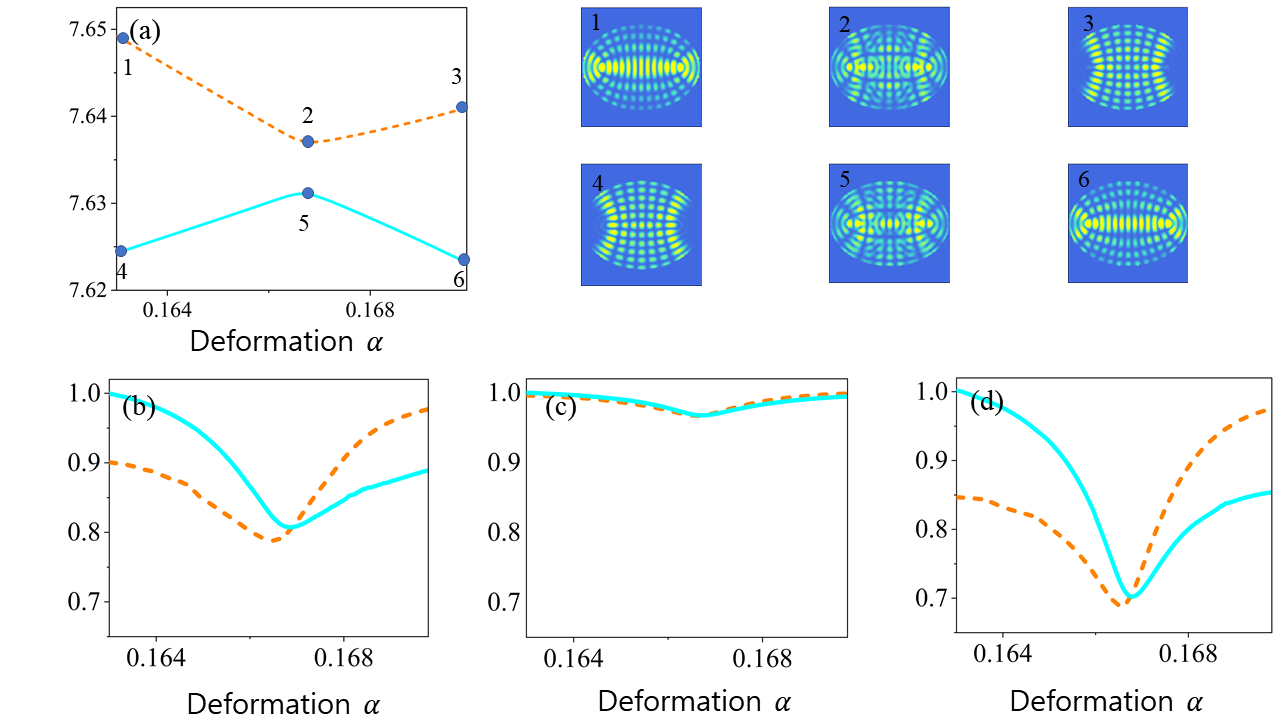
In addition, to demonstrate the general validity of our argument, we apply the three-type measures to an open elliptic billiard in 6. We notice that a similar trend is observed with the closed quadrupole billiard. This is not a trivial result sine the avoided crossing in 1 comes from the nonlinear dynamical effects in a chaotic system whereas the avoided crossing in 6 comes from the openness effects in non-Hermitian system [30, 46].
7 Conclusions
The inverse participation ratio, Rényi entropy, and RMS image contrast were investigated in a quadrupole billiard and an open elliptic billiard for the measurement of the wavefunction (de)localisation in an avoided crossing. The inverse participation ratio, as a measure of wavefunction localisation, is minimised at the centre of the avoided crossing and increases towards the ends of the avoided crossing. For the extension from the wavefunction delocalisation to the information theory, we employed the logarithm of the inverse of the inverse participation ratio instead of the inverse of the inverse participation ratio.
We confirmed that Shannon entropy can also be another indicator of wavefunction delocalisation. Moreover, we exploited the RMS image contrast of the pixel intensity of the mode pattern to quantify the wavefunction localisation, and the RMS image contrast was minimised as the centre of interaction approached. Consequently, we confirmed that the strength of the interaction can be related to the image contrast. The three indicators of wavefunction (de)localisation behave similarly; however, the RMS image contrast is the most sensitive at least in our presented example. The eigenvalues that we have used in this paper are in the low-energy region, and not in the semiclassical region. Apparently, one can expect that the effects of (de)localisation would be enhanced in the semi-classical (high-energy) range. We will address these conjectures on phase space as well as configuration space in our future works.
Acknowledgments
We thank Kyungwon An for valuable comments. This work was supported by the National Research Foundation of Korea, a grant funded by the Ministry of Science and ICT (Grant No. NRF-2020M3E4A1077861 & 2020R1A2C3009299) and the Ministry of Education (Grant No. NRF-2021R1I1A1A01052331 & NRF-2021R1I1A1A01042199).
References
References
- [1] Von Neumann J and Wigner E 1929 Über merkwürdige diskrete Eigenwerte, Phys. Z. 30 465–467
- [2] Fasth C, Fuhrer A, Samuelson L, Golovach V N and Loss D 2007 Direct Measurement of the Spin-Orbit Interaction in a Two-Electron InAs Nanowire Quantum Dot Phys. Rev. Lett. 98 266801
- [3] Ptok A, Kobiałka A and Domański T 2017 Controlling the bound states in a quantum-dot hybrid nanowire Phys. Rev. B 96 195430
- [4] Baggioli M, Cui B and Zaccone A 2019 Theory of the phonon spectrum in host-guest crystalline solids with avoided crossing Phys. Rev. B 100 220201(R)
- [5] Thingstad E, Kamra A, Brataas A and Sudbø A 2019 Chiral Phonon Transport Induced by Topological Magnons Phys. Rev. Lett. 122 107201
- [6] Beiersdorfer P, Scofield J H, Brown G V, Chen M H, Hell N, Osterheld A L, Vogel D A and Wong K L 2016 Avoided level crossings in very highly charged ions Phys. Rev. A 93 051403(R)
- [7] Zhu J, Özdemir Ş K, He L and Yang L 2010 Controlled manipulation of mode splitting in an optical microcavity by two Rayleigh scatterers Opt. Express 18 23535–23543
- [8] Song Q, Ge L, Wiersig J and Cao H 2013 Formation of long-lived resonances in hexagonal cavities by strong coupling of superscar modes Phys. Rev. A 88 023834
- [9] Shin Y, Kwak H, Moon S, Lee S B, Yang J and An K 2016 Observation of an exceptional point in a two-dimensional ultrasonic cavity of concentric circular shells Sci. Rep. 6 38826
- [10] Bittner S, Dietz B, Harney H L, Miski-Oglu M, Richter A and Schäfer F 2014 Scattering experiments with microwave billiards at an exceptional point under broken time-reversal invariance Phys. Rev. E 89 032909
- [11] Ryu J W, Lee S Y and Kim S W 2009 Coupled nonidentical microdisks: Avoided crossing of energy levels and unidirectional far-field emission Phys. Rev. A 79 053858
- [12] Song Q, Gu Z, Liu S and Xiao S 2014 Coherent destruction of tunneling in chaotic microcavities via three-state anti-crossings Sci. Rep. 4 4858
- [13] Toshiya T 1992 Semiclassical Interpretation of Avoided Crossings for Classically Nonintegrable Systems Phys. Rev. E 68 3371
- [14] Elvira Romera et al 2017 Delocalization properties at isolated avoided crossings in Lipkin-–Meshkov–-Glick type Hamiltonian models J. Stat. Mech. 013101
- [15] Kolovsky A R, Mantica G 2011 Cyclotron-Bloch dynamics of a quantum particle in a two-dimensional lattice Phys. Rev. E 83 041123
- [16] Orgiu E, George J, Hutchison J A, Devaux E, Dayen J F, Doudin B, Stellacci F, Genet C, Schachenmayer J, Genes C, Pupillo G, Samorì P and Ebbesen T W 2015 Conductivity in organic semiconductors hybridized with the vacuum field Nat. Mater. 14 1123
- [17] Hine N D M and Foulkes W M C 2007 Localization lengths over metal to band insulator transitions J. Phys.: Condens. Matter 19 506212
- [18] Juntunen T, Vänskä O and Tittonen I 2019 Anderson Localization Quenches Thermal Transport in Aperiodic Superlattices Phys. Rev. Lett. 122 105901
- [19] Sani M and Farzad M H 2018 Anderson localization of surface plasmons in monolayer graphene Phys. Rev. B 97 085406
- [20] Heller E J 1984 Bound-State Eigenfunctions of Classically Chaotic Hamiltonian Systems: Scars of Periodic Orbits Phys. Rev. Lett. 53 1515
- [21] Arranz F J, Borondo F and Benito R M 1998 Scar Formation at the Edge of the Chaotic Region Phys. Rev. Lett. 80 944
- [22] Walkup J R, Dunn M, Watson D K and Germann T C 1998 Avoided crossings of diamagnetic hydrogen as functions of magnetic field strength and angular momentum Phys. Rev. A 58 4668
- [23] Chang R K and Campillo A J 1996 Optical Process in Microcavities (World Scientific, Singapore)
- [24] Wiersig J 2006 Formation of Long-Lived, Scarlike Modes near Avoided Resonance Crossings in Optical Microcavities Phys. Rev. Lett. 97 253901
- [25] Unterhinninghofen J, Wiersig J and Hentschel M 2008 Goos-Hänchen shift and localization of optical modes in deformed microcavities Phys. Rev. E 78 016201
- [26] Lee S Y, Rim S, Ryu J W, Kwon T Y, Choi M and Kim C M 2004 Quasiscarred Resonances in a Spiral-Shaped Microcavity Phys. Rev. Lett. 93 164102
- [27] Ryu J W and Lee S Y 2011 Quasiscarred modes and their branching behavior at an exceptional point Phys. Rev. E 83 015203(R)
- [28] Notarnicola S, Iemini F, Rossini D, Fazio R, Silva A and Russomanno A 2018 From localization to anomalous diffusion in the dynamics of coupled kicked rotors Phys. Rev. E 97 022202
- [29] Gu Y Z, Chen L K, Qian Y J, Gong Q, Cao Q T and Xiao Y F 2020 Layered localization in a chaotic optical cavity Phys. Rev. E 102 062208
- [30] Park K W, Moon S, Shin Y, Kim J, Jeong K and An K 2018 Shannon entropy and avoided crossings in closed and open quantum billiards Phys. Rev. E 97 062205
- [31] Jeong K, Park K W and Kim J 2020 Relative Entropy as a Measure of Difference between Hermitian and Non-Hermitian Systems Entropy 22 809
- [32] Shannon C E 1948 A Mathematical Theory of Communication Bell Syst. Tech. J. 27 379
- [33] Evers F and Mirlin A D 2000 Fluctuations of the Inverse Participation Ratio at the Anderson Transition Phys. Rev. Lett. 84 3690
- [34] Murphy N C, Wortis R and Atkinson W A 2011 Generalized inverse participation ratio as a possible measure of localization for interacting systems Phys. Rev. B 83 184206
- [35] Rényi A 1961 ON MEASURES OF ENTROPY AND INFORMATION Proc. 4th Berkeley Symp. Math. Stat. Prob., Vol. 1: Contrib. Theory Stat. (University of California Press, Berkeley, CA)
- [36] Dong X 2019 Holographic Rényi Entropy at High Energy Density Phys. Rev. Lett. 122 041602
- [37] Solomon J A and Pelli D G 1994 The visual filter mediating letter identification Nature 369 395–397
- [38] Peli E 1990 Contrast in complex images J. Opt. Soc. Am. A 7 2032–2040
- [39] M. Pavel, G. Sperling, T. Riedl, and A. Vanderbeek, Limits of visual communication: the effect of signal-to-noise ratio on the intelligibility of American Sign Language, J. Opt. Soc. Am. A 4 2355–2365
- [40] Stöckmann H J 1999 Quantum Chaos: An Introduction (Cambridge University Press, London)
- [41] Haake F 2010 Quantum Signatures of Chaos (Springer, Berlin)
- [42] Wiersig J 2003 Boundary element method for resonances in dielectric microcavities J. Opt. A: Pure Appl. Opt. 5 53
- [43] Burlak G and Martinez-Sánchez E 2017 The optical Anderson localization in three-dimensional percolation system Opt. Commun. 387 426–431
- [44] Shukla P 2018 Disorder perturbed flat bands: Level density and inverse participation ratio Phys. Rev. B 98 054206
- [45] Batistić B, Lozej Č and Robnik M 2019 Statistical properties of the localization measure of chaotic eigenstates and the spectral statistics in a mixed-type billiard Phys. Rev. E 100 062208
- [46] Park K W, Moon S, Jeong H, Kim J, and Jeon K 2018 Non-Hermiticity and conservation of orthogonal relation in dielectric microcavity Jeong K, Park K W and Kim J J. Phys. Commun. 2 075007