Improving Statistical Significance in Human Evaluation
of Automatic Metrics via Soft Pairwise Accuracy
Abstract
Selecting an automatic metric that best emulates human annotators is often non-trivial, because there is no clear definition of “best emulates.” A meta-metric is required to compare the human judgments to the automatic metric scores, and metric rankings depend on the choice of meta-metric. We propose Soft Pairwise Accuracy (SPA), a new meta-metric that builds on Pairwise Accuracy (PA) but incorporates the statistical significance of both the human judgments and the metric scores. We show that SPA is more stable than PA with respect to changes in the number of systems/segments used for evaluation. We also show that PA can only assign a small set of distinct output values to metrics, and this results in many metrics being artificially assigned the exact same PA score. We demonstrate that SPA fixes this issue. Finally, we show that SPA is more discriminative than PA, producing more statistically significant comparisons between metrics. SPA was selected as the official system-level metric for the 2024 WMT Metrics Shared Task.
Improving Statistical Significance in Human Evaluation
of Automatic Metrics via Soft Pairwise Accuracy
Brian Thompson††thanks: Correspondence: [email protected]. Work is unrelated to and conducted independently from the author’s position at Amazon. Amazon Nitika Mathur Oracle Daniel Deutsch Google Huda Khayrallah Microsoft
1 Introduction
Automatic metrics are crucial because researchers and practitioners in NLP typically can’t afford the high cost and latency of high-quality human evaluations. Despite their shortcomings, metrics like word error rate and BLEU Papineni et al. (2002)—in conjunction with carefully curated test sets—have been crucial for the field of NLP, as they have provided a yardstick to make continual progress over many decades in automatic speech recognition and machine translation (MT), respectively.

Reliance on automatic metrics makes selecting a good automatic metric of paramount importance. Conceptually, an automatic metric should emulate human judgments. Selecting an automatic metric typically entails generating a set of human judgments for a wide variety of outputs from a large number of different systems, and selecting the automatic metric that produces scores most similar to the human judgments. But how do we quantify similarity? To select the metric which produces output most similar to human judgements, we need a meta-metric to compare metric scores and human judgments. Despite nearly two decades of research on MT meta-evaluation, the community has not reached a consensus on the choice of a meta-metric. Various meta-metrics have been introduced over the years to address problems with prior meta-metrics, while sometimes creating new problems or re-introducing old ones (see § 5).
Recent works Mathur et al. (2020b); Kocmi et al. (2021) have argued that the primary application of a metric is to choose between two competing systems, therefore the best metric is the one which produces pairwise system rankings most similar to the pairwise system rankings produced by human judgements. This led to Pairwise Accuracy (PA) being adopted by the WMT Metrics shared task for the past several years (Freitag et al., 2021, 2022, 2023). However, this argument omits a key detail: standard best practice when comparing two systems with an automatic metric is to consider not only which system the metric prefers, but also whether or not that preference is statistically significant Koehn (2004). Thus we argue that metrics should emulate not only the accuracy of human pairwise ranking, but also the confidence or statistical significance of the human pairwise ranking.
To this end, we propose Soft Pairwise Accuracy (SPA), a new meta-metric which takes into account statistical significance of both the metric scores and the human judgments when evaluating the extent to which the metric in question agrees with the human judgments. We show that soft pairwise accuracy, as its name implies, can be viewed as a soft (i.e. non-binarized) version of PA, and present analysis that demonstrates SPA has several distinct advantages over PA. First, we find SPA is more stable with respect to the exact choice of MT systems and segments used. Second, we show that due to the binarization in its formulation, PA can only assign a small set of distinct output values to metrics, and in practice this results in many metrics being artificially assigned the exact same PA score. We demonstrate that SPA fixes this issue. Finally, we argue that PA is effectively equivalent to SPA with added noise due to binarization. We show that removing this noise (i.e. switching to SPA) results in substantially more statistically significant comparisons between metrics, making SPA a more discriminative and therefore more useful meta-metric. Our findings resulted in SPA being selected as the official system-level meta-metric for the 2024 WMT Metrics Shared Task Freitag et al. (2024).
2 Method
We propose a simple meta-metric for evaluating automatic metrics given human judgments, which we denote Soft Pairwise Accuracy:
| (1) |
where is the number of systems for which we have human judgements and metric scores, is the -value for hypothesis that system is better than system given the human judgments, and is the -value for hypothesis that system is better than system given the metric scores. The term normalizes the summation by the total number of pairs of systems being compared.
For each pairwise system comparison, we use a permutation test Fisher (1935) to estimate statistical significance of the difference in the means of the segment-level scores from a particular metric (or the human judgements) for the two systems. We first randomly split the segment-level scores (ignoring the labels, i.e. which MT system produced each segment) into two parts and compute the difference in metric score mean. Repeating this process many times provides a set of mean differences we can reasonably expect under the null hypothesis that the two systems are of the same quality. We compute a one-tailed -value by calculating the fraction of the time that the random splits produce differences greater than or equal to the mean difference we observe for the two systems.
Permutation tests are appealing because they don’t require any assumptions about the underlying distribution of the data. This fits our use case well because we cannot assume anything about the distribution of segment-level scores of a metric.111Metric and human annotation distributions are both highly variable Lo et al. (2023b); Knowles and Lo (2024). Permutation tests instead have the assumption of exchangeability Pitman (1937); Draper et al. (1993); Good (2002)—that is, under the null hypothesis (in our case, that the two MT systems are of equal quality) the joint distribution of the observations is invariant under permutations of the data labels. To help ensure exchangeability, we perform permutations such that each split has exactly one translation of each test set sentence, commonly referred to as a paired permutation test Good (2013).
Here we present some concrete examples for the sake of intuition. Suppose a metric reports a point difference between system and system , and that the random permutations only produce a metric difference points of the time. Thus and we conclude that the metric has high confidence that system is better than system . Likewise, if the metric reports the systems have a point difference, we might find that the random permutations produce a metric difference points of the time. Thus and we conclude the metric has high confidence that system is worse than system . If the systems have the same metric score, we would expect about half of the random permutations to produce a metric difference and thus , indicating the metric finds the two systems indistinguishable from each other.
2.1 Relationship to Pairwise Accuracy
PA is defined as
| (2) |
where is 1 when the metric scores and human judgments prefer the same system and 0 otherwise. PA is equivalent to the Kendall rank correlation coefficient Kendall (1938), modulo a linear scaling and shifting (see § 5.1).
A -value will be less than 0.5 when the human raters (or automatic metric) prefer system over system , and greater than 0.5 when the human raters (or automatic metric) prefer system over system . This allows us to define PA in terms of binarized -values:
| (3) |
Where binarization is denoted as:
Comparing Equation 1 and Equation 3 illustrates that SPA can be viewed as a ‘soft’ extension to PA that incorporates uncertainty in both the human and metric scores. A visualization of this is provided in Figure 1.
In cases where both the MT metric and the human evaluation both have high statistical significance (regardless of whether the metric agrees with the human judgments or not, i.e. or ), the contribution of that system pair to SPA and PA is approximately identical. However, there are two important cases where our meta-metric differs from PA:
-
1.
The human evaluation has high statistical significance (i.e. or ), but the metric has low statistical significance (i.e. ): Even if the metric happens to choose the correct winner, we partially penalize the metric for not having high statistical significance.
-
2.
The human evaluation finds the systems are approximately tied (i.e. ): In this case, we partially penalize the metric if has high statistical significance (i.e. or ) even if it happens to pick the same winner as the human evaluation, and to get full credit the metric must match the human evaluation statistical significance (i.e. )
2.2 Addressing Metric Ties in PA
The fact that PA considers only binary wins/losses (i.e. the binarization in Equation 3) results in an interesting shortcoming in PA. There are pairs of systems, and thus distinct values that PA can take on (, , …, ). For example, in WMT 2022 En-De, there are MT systems and thus .
However, metrics tend to perform better than a random baseline, so only the upper half of the range is actually useful (e.g. this leaves 46 distinct values for systems). We find that this results in PA reporting the same scores for several sets of metrics (see § 4.3). By removing this binarization, SPA has no such issues.
3 Experimental Setup
3.1 Data
We conduct experiments on the data from the 2022 and 2023 WMT Metrics Shared Tasks Freitag et al. (2022, 2023). In particular, we use the primary language pairs where MQM judgments were collected. We use the MT Metrics Eval V2 toolkit222https://github.com/google-research/mt-metrics-eval to retrieve official shared task scores.
We make the somewhat arbitrary decision to compare all metrics, including non-primary metrics but excluding QE metrics (i.e. reference-free metrics) which provide segment-level scores.
In order to compute the statistical significance of comparisons between metrics, we make the simplifying assumption that all system-level metrics are the average of their segment-level metric. This is not true for some metrics, including BLEU Papineni et al. (2002) and chrF Popović (2015). While it would be possible to re-compute BLEU and chrF for each subset, we average the sentence-level versions of these metrics for simplicity. To the best of our knowledge, this approach is also taken in recent WMT metrics shared tasks.


3.2 -value Speed Optimization
We estimate each -value from 1000 random permutations.333Note that due to the randomness inherent in the -value estimation process, the exact value of SPA can vary slightly from run to run. A naive implementation of the paired permutation test is not computationally prohibitive when computing -values for all systems/metrics a single time, but it becomes problematic when we want to compute these values many times in order to estimate statistical significance of metric comparisons.
Experimentally, we find the main speed bottleneck to be generating the random permutations, so when estimating statistical significance of metric comparisons we cache a batch of permutations and use it for each pair of systems, on a per test-set basis. Additionally, by sharing permutations across system pairs, this allows us to pre-compute the contribution of each system to means of the random permutations, allowing computations to be linear instead of square in the number of systems. See our code444https://github.com/thompsonb/mt-metrics-eval/blob/main/mt_metrics_eval/pairwise_paired_permutation_test.py for full implementation details. This results in a speedup of over 1000x compared to the implementation in Scipy Virtanen et al. (2020).555Using the ‘permutation_test’ function from scipy, ‘permutation_type’ set to ‘samples’ and the ‘n_resamples’ set to 1000, each -value takes around 40 milliseconds to compute on a laptop. Our speed optimization does not change the computation of a -value for a single system-level comparison, but it does mean that the -value for one pair of systems is no longer computed independent from the -value for any other pair of systems. Given that we are using these -values as an approximate level of confidence for the system-level comparisons in the SPA meta-metric formulation, as opposed to making any claims about the actual statistical significance of the system-level comparisons, we believe this lack of independence should be inconsequential.


4 Analysis
Meta-metric evaluation is challenging because there is no ground truth (i.e., we don’t know the true ranking of the metrics). Instead, we conduct analysis to compare SPA and PA. First, we study how sensitive the meta-metric results are when ablating the number of MT systems and number of segments per MT system, with the assumption that lower sensitivity to the exact systems/segments used indicates a better meta-metric. Second, we examine whether PA indeed has the problem of ties that we hypothesized in § 2.2, and whether SPA fixes this issue. Finally, we test our hypothesis that the binarization in PA is effectively acting as additive random noise, and that SPA is effectively the same underlying meta-metric with the noise term removed.
4.1 Ablation: Number of Systems
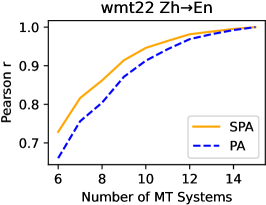
Each year, WMT and the associated metrics task collect and score many online and submitted MT systems. For an ideal meta-metric, the exact choice of MT systems would have minimal impact on the metric rankings. We perform an ablation on the number of MT systems being scored, keeping the number of annotations per system fixed. We then compute the correlation (as measured by Pearson’s ) between the meta-metric’s ranking of the ablations compared to that same meta-metric’s full ranking. This allows us to evaluate how sensitive the metric is to the exact selection of MT systems.
When ablating the number of MT systems (and keeping the number of annotations per system fixed), we find (see Figure 2) that SPA is more stable than PA across all MQM language pairs in the last two years of WMT Metrics Shared Tasks.
4.2 Ablation: Sample Size
Since SPA relies on the pairwise -values between MT systems, it is also natural to ask how SPA behaves when the number of available segments used for evaluating systems is small since it is harder to find statistical differences between systems with a smaller sample size. To answer this question, we calculate 95% confidence intervals for both PA and SPA values of two highly performant metrics—in particular, we considered xCOMET (Guerreiro et al., 2023) and MetricX-23 (Juraska et al., 2023)—on WMT 2023 using bootstrapping for various numbers of segments, thereby simulating scenarios with less human annotations but a fixed number of MT systems.
When ablating the number of segments per MT system (and keeping the number of MT systems fixed), we find (see Figure 3) that SPA has tighter 95% confidence intervals than PA (shown on Metric-X and xCOMET), and that the confidence interval converges to its final value with smaller sample sizes than PA.
4.3 Ties
As discussed in § 2.2, the binarization in PA limits the number of distinct values it can assign to metrics. to . In practice, we find it tends to take on far fewer values. For example for WMT 2022 EnDe, PA could theoretically take on 92 distinct values, but because the metrics fall in a fairly narrow range (PA is for the worst metric and for the best), the 21 metrics have only 11 distinct PA scores, with one 5-way PA tie and several 2- and 3-way PA ties (see Figure 4). Since SPA does not binarize each system comparison, it is able to assign any value to each metric, and is therefore potentially better able to distinguish between metrics.
Results for all language pairs are in Table 1. We find that on average, PA produces about half as many distinct values as there are metrics while SPA produces one unique value per unique metric.
4.4 Statistical Significance of Metric Comparisons
We hypothesize that the binarization in PA is essentially acting as additive random noise on top of the underlying SPA meta-metric. If this is true (and the magnitude of the noise does not dominate the underlying signal), we would expect SPA to produce a similar metric ranking to PA, but with increased statistical significance. To test this, we compute statistical significance of the comparisons between each metric using the PERM-INPUTS Deutsch et al. (2021) method. We follow recent shared tasks in greedily computing significance clusters, by starting with the highest scoring metric and assigning rank 1 to all metrics until we encounter the first metric that is statistically significantly different from any previous metric so far. That metric is assigned rank 2, and the process repeats until all metrics have been assigned a rank. We echo the shared task organizers’ warning that this method can place two metrics that are statistically indistinguishable in different significance clusters (and in the case of PA, we observe this multiple times).
 |
 |
On average, SPA increases the number of statistically significant pairwise comparisons by 31% and the number of significance clusters by 40% compared to PA, while producing similar scores for each metric (see Figure 4 for a visualization for WMT 2022 EnDe results and Table 1 for results summary). This is consistent with our hypothesis that PA is effectively SPA with added noise due to binarization. This means that SPA is a more discriminative, and therefore more useful, meta-metric than PA.
| Distinct Metric | Significant | Significant | ||||||||||
|---|---|---|---|---|---|---|---|---|---|---|---|---|
| Testset | Language | # MT | # MT | Values () | Comparisons () | Clusters () | ||||||
| Pairs | Systems | Metrics | PA | SPA | Max | PA | SPA | Max | PA | SPA | Max | |
| wmt22 | EnDe | 14 | 21 | 11 | 21 | 21 | 108 | 163 | 210 | 5 | 8 | 21 |
| wmt22 | ZhEn | 15 | 21 | 12 | 21 | 21 | 150 | 177 | 210 | 6 | 9 | 21 |
| wmt22 | EnRu | 15 | 20 | 10 | 20 | 20 | 88 | 133 | 190 | 4 | 6 | 20 |
| wmt23 | EnDe | 12 | 25† | 12† | 24† | 24† | 171 | 206 | 276† | 5 | 6 | 24† |
| wmt23 | HeEn | 13 | 25 | 11 | 25 | 25 | 180 | 224 | 300 | 5 | 8 | 25 |
| wmt23 | ZhEn | 14 | 25 | 12 | 25 | 25 | 186 | 229 | 300 | 7 | 7 | 25 |
5 Historical Context and Related Work
WMT has run a machine translation evaluation since 2006 Koehn and Monz (2006). Since 2007 Callison-Burch et al. (2007), there has also been meta-evaluation of automatic metrics on the submitted translation systems. Here we summarize the rich 17 year history of system-level meta-evaluation at the WMT Metrics Shared Tasks666The WMT Shared Tasks have typically evaluated at both the system- and segment-level, but we focus on system-level meta-evaluation as it is most relevant to our work. and work related to and directly impacting the shared tasks, in order to demonstrate how our work fits into the historical context.
In the WMT 2007-2013 metrics evaluations Callison-Burch et al. (2007, 2008, 2009, 2010, 2011, 2012); Macháček and Bojar (2013) Spearman’s rank correlation coefficient was used for meta-evaluation of metrics. This was motivated by the fact that Spearman’s makes fewer assumptions about the data than the Pearson correlation coefficient.
The WMT 2013 Translation Shared Task Bojar et al. (2013) introduced system clusters (groups of systems that cannot be distinguished given the human judgments), and the 2013 metrics task Macháček and Bojar (2013) introduced empirical confidence of Spearman’s using bootstrap resampling. Since they were not able to resample on the submitted metrics, they only re-sampled human judgments. This iteration also discussed the fact that Spearman’s does not give partial credit. The penalty is equal for all wrong judgments, regardless of if the systems are close or far in quality. To compensate they present additional methods of analysis: Pearson’s, and correlation with systems’ clusters from the translation task Bojar et al. (2013). Those clusters were treated as ‘ranks with ties,’ and then correlation computed against Pearson’s and Pearson’s correlation against ‘fuzzy ranks’ (the average over ranks of all systems that are not significantly different in human quality).
In 2014, the metrics task Macháček and Bojar (2014) fully switched to Pearson’s from Spearman’s . They also did bootstrap resampling to get empirical confidence intervals of system level correlations. This change to Pearson’s was due to the concerns pointed out in the previous year’s shared task, which had explored other meta-metrics.
The 2015 metrics task Stanojević et al. (2015) continued with Pearson’s , and also presented analysis of Pearson’s vs Spearman’s , and highlighted the instability of Spearman’s when MT systems are similar.
The 2016 metrics task Bojar et al. (2016) stuck with Pearson’s , but changed the confidence to be the Williams test Williams (1959), as Graham and Baldwin (2014) had noted that this test is appropriate for dependent correlations.
The 2017 metrics task Bojar et al. (2017) kept Pearson’s , and Williams test. They also added a pairwise significance test using Williams test. This continued in 2018 and 2019 Ma et al. (2018, 2019)
The 2020 metrics task Mathur et al. (2020b) continued to use Pearson’s, but also includes Kendall’s Tau for analysis. Kendall’s Tau is a closer match for the system ranking use case, since it is evaluating whether the ordering of a pair of systems is the same as the human ordering. However, it does not take into account the magnitude difference.
In 2021, the metrics task Freitag et al. (2021) adopted pairwise accuracy Kocmi et al. (2021), motivated in part by the fact that MT system outliers had an outsized impact on Pearson correlation when it is used to rank MT Metrics Mathur et al. (2020a). Pairwise accuracy produces the same system-level ranking as Kendall’s Tau, as they are equivalent modulo a linear scaling and shifting (see § 5.1). The PERM-BOTH hypothesis test of Deutsch et al. (2021) was used to determine significance. 2021 and 2022 Freitag et al. (2022, 2023) follow.
In summary, the historical context of the WMT metric evaluations demonstrates that meta-evaluation is very challenging due to the numerous issues that must be simultaneously addressed, and underscores the pitfalls of making changes to meta-evaluation without considering the full set of ramifications. Most relevant to our work, it appears that the switch to pairwise accuracy in 2021 reduced the influence of outliers Mathur et al. (2020a) and (somewhat) aligned meta-evaluation with the standard use of comparing two systems with a metric, but it also reintroduced a problem that was first pointed out by Macháček and Bojar (2013) and more fully addressed by the change to Pearson’s from Spearman by Macháček and Bojar (2014): a disregard for the magnitude of differences. We address this issue by considering empirical confidence, which was first added by Macháček and Bojar (2013), and in the process we also better align meta-evaluation to the (more correct) usage of comparing two systems with a metric while also considering the statistical significance of the results.
5.1 Relationship to Kendall’s Tau
Our work builds on pairwise accuracy, typically attributed to Kocmi et al. (2021). Pairwise accuracy is equivalent to the the widely used Kendall rank correlation coefficient Kendall (1938), modulo a linear scaling and shifting. Kocmi et al. (2021) present pairwise accuracy as simply “accuracy” and make no mention of its relation to Kendall, which was already in use for MT meta-evaluation Mathur et al. (2020b). The term “pairwise accuracy” appears to have been coined by Freitag et al. (2021) to distinguish it from other types of accuracy.
Kendall’s Tau is defined in terms of concordance (equivalent to our previously defined ) and discordance , defined to be 1 when the metric and human judgments disagree and 0 otherwise:
| (4) |
Any system pair which is not concordant is discordant,777We ignore tie handling, as ties are extremely unlikely in system-level evaluation. Ties in segment-level evaluation are an entirely different matter Deutsch et al. (2023a). and thus . Given this and the definition of PA from Equation 2, we have:
| (5) | ||||
5.2 Additional Connections to Prior Work
Graham and Liu (2016) proposed a method of sampling translations from every pair of competing MT systems, creating synthetic systems for scoring. Our work has clear similarities in that we create and score synthetic permutations, but differs in how those synthetic systems are used in the meta-metric formulation.
Mathur et al. (2020a) showed that MT system outliers had an outsized impact on Pearson correlation. In SPA, outliers impact is limited because -values saturate at 0 or 1.
Knowles (2021) highlights that as WMT annotation protocols have shifted the original statistical assumptions, and questions the validity of the resulting protocols. Similarly, we show that shifts over the years have caused problems in meta-evaluation.
Lo et al. (2023a) investigated what magnitude of metric changes tend to be statistically significant. SPA uses statistical significance measures (-values) directly, as opposed to the magnitude of metric differences (e.g. as in Pearson correlation).
Deutsch et al. (2023a) demonstrated that principled tie handling is crucial when comparing MT metrics at the segment level, because some metrics produce quantized scores that often result in ties. SPA is system level (i.e. sentence level scores averaged over the entire test set), so exact ties are very unlikely. However, SPA can be seen as giving full credit for (statistical) ties, which is similar in spirit.
We show that quantization (specifically binarization) is problematic in PA. Quantization in evaluation has proved problematic in other spaces as well—for example, Schaeffer et al. (2024) attributes the widely repeated claim that LLMs have emergent properties to quantization in evaluation.
6 Conclusions
We introduce a new meta-metric which we denote soft pairwise accuracy, and show that it improves on pairwise accuracy in a number of ways, most notably that it is more stable than pairwise accuracy when ablating the number of systems and annotations per system, it fixes an issue of metric ties observed in pairwise accuracy, and it produces more statistically significant comparisons between metrics than pairwise accuracy. We also discuss how soft pairwise accuracy fits into and builds upon the nearly two decade history of meta-evaluation at the WMT Metric Shared Tasks.
Acknowledgments
This work would not have been possible without the WMT shared tasks and metrics tasks releasing their data. We are appreciative of helpful discussions with the WMT metrics task organizers as well as Sweta Agrawal and Rebecca Knowles.
Limitations
When computing -values, we assume that system-level metric scores are the average of segment-level metrics scores. There is a line of recent work that seeks to incorporate contextual information into automatic metrics. Many such works still produce scores at the segment level (e.g. Vernikos et al., 2022; Hu et al., 2023; Agrawal et al., 2024) but others produce one score per window of a few sentences Raunak et al. (2024) or one score per paragraph Deutsch et al. (2023b). Our method should still be applicable in such cases, but would require permuting windows or paragraphs instead of segments. Additionally, as previously noted, some metrics—notably BLEU Papineni et al. (2002) and chrF Popović (2015)—compute statistics at the segment level and combine them to create document-level scores. Again, permutations would still work but would require some modification. To the best of our knowledge, this issue is not limited to our work—the same assumption is made in prior work computing statistical significance of metrics, including the WMT shared tasks Freitag et al. (2021, 2022, 2023) and Deutsch et al. (2021).
It is worth noting that the permutations in this work (as in prior works) are done on a single test set, and do not necessarily reflect variations in performance that could result from using the metrics in another domain. Prior work has shown that trained metrics are sensitive to a shift in domain relative to the data domain they were trained on Zouhar et al. (2024).
References
- Agrawal et al. (2024) Sweta Agrawal, Amin Farajian, Patrick Fernandes, Ricardo Rei, and André F. T. Martins. 2024. Is context helpful for chat translation evaluation? Preprint, arXiv:2403.08314.
- Bojar et al. (2013) Ondřej Bojar, Christian Buck, Chris Callison-Burch, Christian Federmann, Barry Haddow, Philipp Koehn, Christof Monz, Matt Post, Radu Soricut, and Lucia Specia. 2013. Findings of the 2013 Workshop on Statistical Machine Translation. In Proceedings of the Eighth Workshop on Statistical Machine Translation, pages 1–44, Sofia, Bulgaria. Association for Computational Linguistics.
- Bojar et al. (2017) Ondřej Bojar, Yvette Graham, and Amir Kamran. 2017. Results of the WMT17 metrics shared task. In Proceedings of the Second Conference on Machine Translation, pages 489–513, Copenhagen, Denmark. Association for Computational Linguistics.
- Bojar et al. (2016) Ondřej Bojar, Yvette Graham, Amir Kamran, and Miloš Stanojević. 2016. Results of the WMT16 metrics shared task. In Proceedings of the First Conference on Machine Translation: Volume 2, Shared Task Papers, pages 199–231, Berlin, Germany. Association for Computational Linguistics.
- Callison-Burch et al. (2007) Chris Callison-Burch, Cameron Fordyce, Philipp Koehn, Christof Monz, and Josh Schroeder. 2007. (meta-) evaluation of machine translation. In Proceedings of the Second Workshop on Statistical Machine Translation, pages 136–158, Prague, Czech Republic. Association for Computational Linguistics.
- Callison-Burch et al. (2008) Chris Callison-Burch, Cameron Fordyce, Philipp Koehn, Christof Monz, and Josh Schroeder. 2008. Further meta-evaluation of machine translation. In Proceedings of the Third Workshop on Statistical Machine Translation, pages 70–106, Columbus, Ohio. Association for Computational Linguistics.
- Callison-Burch et al. (2010) Chris Callison-Burch, Philipp Koehn, Christof Monz, Kay Peterson, Mark Przybocki, and Omar Zaidan. 2010. Findings of the 2010 joint workshop on statistical machine translation and metrics for machine translation. In Proceedings of the Joint Fifth Workshop on Statistical Machine Translation and MetricsMATR, pages 17–53, Uppsala, Sweden. Association for Computational Linguistics.
- Callison-Burch et al. (2012) Chris Callison-Burch, Philipp Koehn, Christof Monz, Matt Post, Radu Soricut, and Lucia Specia. 2012. Findings of the 2012 workshop on statistical machine translation. In Proceedings of the Seventh Workshop on Statistical Machine Translation, pages 10–51, Montréal, Canada. Association for Computational Linguistics.
- Callison-Burch et al. (2009) Chris Callison-Burch, Philipp Koehn, Christof Monz, and Josh Schroeder. 2009. Findings of the 2009 Workshop on Statistical Machine Translation. In Proceedings of the Fourth Workshop on Statistical Machine Translation, pages 1–28, Athens, Greece. Association for Computational Linguistics.
- Callison-Burch et al. (2011) Chris Callison-Burch, Philipp Koehn, Christof Monz, and Omar Zaidan. 2011. Findings of the 2011 workshop on statistical machine translation. In Proceedings of the Sixth Workshop on Statistical Machine Translation, pages 22–64, Edinburgh, Scotland. Association for Computational Linguistics.
- Deutsch et al. (2021) Daniel Deutsch, Rotem Dror, and Dan Roth. 2021. A statistical analysis of summarization evaluation metrics using resampling methods. Transactions of the Association for Computational Linguistics, 9:1132–1146.
- Deutsch et al. (2023a) Daniel Deutsch, George Foster, and Markus Freitag. 2023a. Ties matter: Meta-evaluating modern metrics with pairwise accuracy and tie calibration. In Proceedings of the 2023 Conference on Empirical Methods in Natural Language Processing, pages 12914–12929, Singapore. Association for Computational Linguistics.
- Deutsch et al. (2023b) Daniel Deutsch, Juraj Juraska, Mara Finkelstein, and Markus Freitag. 2023b. Training and meta-evaluating machine translation evaluation metrics at the paragraph level. In Proceedings of the Eighth Conference on Machine Translation, pages 996–1013, Singapore. Association for Computational Linguistics.
- Draper et al. (1993) David Draper, James S Hodges, Colin L Mallows, and Daryl Pregibon. 1993. Exchangeability and data analysis. Journal of the Royal Statistical Society Series A: Statistics in Society, 156(1):9–28.
- Fisher (1935) RA Fisher. 1935. The design of experiments. Oliver & Boyd.
- Freitag et al. (2024) Markus Freitag, Nitika Mathur, Daniel Deutsch, Chi-kiu Lo, Eleftherios Avramidis, Ricardo Rei, Brian Thompson, Frederic Blain, Tom Kocmi, Jiayi Wang, David Ifeoluwa Adelani, Marianna Buchicchio, Chrysoula Zerva, and Alon Lavie. 2024. Are LLMs breaking MT metrics? Results of the WMT24 metrics shared task. In Proceedings of the Ninth Conference on Machine Translation, Miami, USA. Association for Computational Linguistics.
- Freitag et al. (2023) Markus Freitag, Nitika Mathur, Chi-kiu Lo, Eleftherios Avramidis, Ricardo Rei, Brian Thompson, Tom Kocmi, Frederic Blain, Daniel Deutsch, Craig Stewart, Chrysoula Zerva, Sheila Castilho, Alon Lavie, and George Foster. 2023. Results of WMT23 metrics shared task: Metrics might be guilty but references are not innocent. In Proceedings of the Eighth Conference on Machine Translation, pages 578–628, Singapore. Association for Computational Linguistics.
- Freitag et al. (2022) Markus Freitag, Ricardo Rei, Nitika Mathur, Chi-kiu Lo, Craig Stewart, Eleftherios Avramidis, Tom Kocmi, George Foster, Alon Lavie, and André F. T. Martins. 2022. Results of WMT22 metrics shared task: Stop using BLEU – neural metrics are better and more robust. In Proceedings of the Seventh Conference on Machine Translation (WMT), pages 46–68, Abu Dhabi, United Arab Emirates (Hybrid). Association for Computational Linguistics.
- Freitag et al. (2021) Markus Freitag, Ricardo Rei, Nitika Mathur, Chi-kiu Lo, Craig Stewart, George Foster, Alon Lavie, and Ondřej Bojar. 2021. Results of the WMT21 metrics shared task: Evaluating metrics with expert-based human evaluations on TED and news domain. In Proceedings of the Sixth Conference on Machine Translation, pages 733–774, Online. Association for Computational Linguistics.
- Good (2002) Phillip Good. 2002. Extensions of the concept of exchangeability and their applications. Journal of Modern Applied Statistical Methods, 1:243–247.
- Good (2013) Phillip Good. 2013. Permutation tests: a practical guide to resampling methods for testing hypotheses. Springer Science & Business Media.
- Graham and Baldwin (2014) Yvette Graham and Timothy Baldwin. 2014. Testing for significance of increased correlation with human judgment. In Proceedings of the 2014 Conference on Empirical Methods in Natural Language Processing (EMNLP), pages 172–176, Doha, Qatar. Association for Computational Linguistics.
- Graham and Liu (2016) Yvette Graham and Qun Liu. 2016. Achieving accurate conclusions in evaluation of automatic machine translation metrics. In Proceedings of the 2016 Conference of the North American Chapter of the Association for Computational Linguistics: Human Language Technologies, pages 1–10, San Diego, California. Association for Computational Linguistics.
- Guerreiro et al. (2023) Nuno M. Guerreiro, Ricardo Rei, Daan van Stigt, Luisa Coheur, Pierre Colombo, and André F. T. Martins. 2023. XCOMET: Transparent Machine Translation Evaluation through Fine-grained Error Detection. Preprint, arXiv:2310.10482.
- Hu et al. (2023) Xinyu Hu, Xunjian Yin, and Xiaojun Wan. 2023. Exploring context-aware evaluation metrics for machine translation. In Findings of the Association for Computational Linguistics: EMNLP 2023, pages 15291–15298, Singapore. Association for Computational Linguistics.
- Juraska et al. (2023) Juraj Juraska, Mara Finkelstein, Daniel Deutsch, Aditya Siddhant, Mehdi Mirzazadeh, and Markus Freitag. 2023. MetricX-23: The Google submission to the WMT 2023 metrics shared task. In Proceedings of the Eighth Conference on Machine Translation, pages 756–767, Singapore. Association for Computational Linguistics.
- Kendall (1938) M. G. Kendall. 1938. A NEW MEASURE OF RANK CORRELATION. Biometrika, 30(1-2):81–93.
- Knowles (2021) Rebecca Knowles. 2021. On the stability of system rankings at WMT. In Proceedings of the Sixth Conference on Machine Translation, pages 464–477, Online. Association for Computational Linguistics.
- Knowles and Lo (2024) Rebecca Knowles and Chi-kiu Lo. 2024. Calibration and context in human evaluation of machine translation. Natural Language Processing, page 1–25.
- Kocmi et al. (2021) Tom Kocmi, Christian Federmann, Roman Grundkiewicz, Marcin Junczys-Dowmunt, Hitokazu Matsushita, and Arul Menezes. 2021. To ship or not to ship: An extensive evaluation of automatic metrics for machine translation. In Proceedings of the Sixth Conference on Machine Translation, pages 478–494, Online. Association for Computational Linguistics.
- Koehn (2004) Philipp Koehn. 2004. Statistical significance tests for machine translation evaluation. In Proceedings of the 2004 Conference on Empirical Methods in Natural Language Processing, pages 388–395, Barcelona, Spain. Association for Computational Linguistics.
- Koehn and Monz (2006) Philipp Koehn and Christof Monz. 2006. Manual and automatic evaluation of machine translation between European languages. In Proceedings on the Workshop on Statistical Machine Translation, pages 102–121, New York City. Association for Computational Linguistics.
- Lo et al. (2023a) Chi-kiu Lo, Rebecca Knowles, and Cyril Goutte. 2023a. Beyond correlation: Making sense of the score differences of new MT evaluation metrics. In Proceedings of Machine Translation Summit XIX, Vol. 1: Research Track, pages 186–199, Macau SAR, China. Asia-Pacific Association for Machine Translation.
- Lo et al. (2023b) Chi-kiu Lo, Samuel Larkin, and Rebecca Knowles. 2023b. Metric score landscape challenge (MSLC23): Understanding metrics’ performance on a wider landscape of translation quality. In Proceedings of the Eighth Conference on Machine Translation, pages 776–799, Singapore. Association for Computational Linguistics.
- Ma et al. (2018) Qingsong Ma, Ondřej Bojar, and Yvette Graham. 2018. Results of the WMT18 metrics shared task: Both characters and embeddings achieve good performance. In Proceedings of the Third Conference on Machine Translation: Shared Task Papers, pages 671–688, Belgium, Brussels. Association for Computational Linguistics.
- Ma et al. (2019) Qingsong Ma, Johnny Wei, Ondřej Bojar, and Yvette Graham. 2019. Results of the WMT19 metrics shared task: Segment-level and strong MT systems pose big challenges. In Proceedings of the Fourth Conference on Machine Translation (Volume 2: Shared Task Papers, Day 1), pages 62–90, Florence, Italy. Association for Computational Linguistics.
- Macháček and Bojar (2013) Matouš Macháček and Ondřej Bojar. 2013. Results of the WMT13 metrics shared task. In Proceedings of the Eighth Workshop on Statistical Machine Translation, pages 45–51, Sofia, Bulgaria. Association for Computational Linguistics.
- Macháček and Bojar (2014) Matouš Macháček and Ondřej Bojar. 2014. Results of the WMT14 metrics shared task. In Proceedings of the Ninth Workshop on Statistical Machine Translation, pages 293–301, Baltimore, Maryland, USA. Association for Computational Linguistics.
- Mathur et al. (2020a) Nitika Mathur, Timothy Baldwin, and Trevor Cohn. 2020a. Tangled up in BLEU: Reevaluating the evaluation of automatic machine translation evaluation metrics. In Proceedings of the 58th Annual Meeting of the Association for Computational Linguistics, pages 4984–4997, Online. Association for Computational Linguistics.
- Mathur et al. (2020b) Nitika Mathur, Johnny Wei, Markus Freitag, Qingsong Ma, and Ondřej Bojar. 2020b. Results of the WMT20 metrics shared task. In Proceedings of the Fifth Conference on Machine Translation, pages 688–725, Online. Association for Computational Linguistics.
- Papineni et al. (2002) Kishore Papineni, Salim Roukos, Todd Ward, and Wei-Jing Zhu. 2002. Bleu: a method for automatic evaluation of machine translation. In Proceedings of the 40th Annual Meeting of the Association for Computational Linguistics, pages 311–318, Philadelphia, Pennsylvania, USA. Association for Computational Linguistics.
- Pitman (1937) Edwin James George Pitman. 1937. Significance tests which may be applied to samples from any populations. ii. the correlation coefficient test. Supplement to the Journal of the Royal Statistical Society, 4(2):225–232.
- Popović (2015) Maja Popović. 2015. chrF: character n-gram F-score for automatic MT evaluation. In Proceedings of the Tenth Workshop on Statistical Machine Translation, pages 392–395, Lisbon, Portugal. Association for Computational Linguistics.
- Raunak et al. (2024) Vikas Raunak, Tom Kocmi, and Matt Post. 2024. SLIDE: Reference-free evaluation for machine translation using a sliding document window. In Proceedings of the 2024 Conference of the North American Chapter of the Association for Computational Linguistics: Human Language Technologies (Volume 2: Short Papers), pages 205–211, Mexico City, Mexico. Association for Computational Linguistics.
- Schaeffer et al. (2024) Rylan Schaeffer, Brando Miranda, and Sanmi Koyejo. 2024. Are emergent abilities of large language models a mirage? In Proceedings of the 37th International Conference on Neural Information Processing Systems, NIPS ’23, Red Hook, NY, USA. Curran Associates Inc.
- Stanojević et al. (2015) Miloš Stanojević, Amir Kamran, Philipp Koehn, and Ondřej Bojar. 2015. Results of the WMT15 metrics shared task. In Proceedings of the Tenth Workshop on Statistical Machine Translation, pages 256–273, Lisbon, Portugal. Association for Computational Linguistics.
- Thompson and Post (2020a) Brian Thompson and Matt Post. 2020a. Automatic machine translation evaluation in many languages via zero-shot paraphrasing. In Proceedings of the 2020 Conference on Empirical Methods in Natural Language Processing (EMNLP), pages 90–121, Online. Association for Computational Linguistics.
- Thompson and Post (2020b) Brian Thompson and Matt Post. 2020b. Paraphrase generation as zero-shot multilingual translation: Disentangling semantic similarity from lexical and syntactic diversity. In Proceedings of the Fifth Conference on Machine Translation, pages 561–570, Online. Association for Computational Linguistics.
- Vernikos et al. (2022) Giorgos Vernikos, Brian Thompson, Prashant Mathur, and Marcello Federico. 2022. Embarrassingly easy document-level MT metrics: How to convert any pretrained metric into a document-level metric. In Proceedings of the Seventh Conference on Machine Translation (WMT), pages 118–128, Abu Dhabi, United Arab Emirates (Hybrid). Association for Computational Linguistics.
- Virtanen et al. (2020) Pauli Virtanen, Ralf Gommers, Travis E Oliphant, Matt Haberland, Tyler Reddy, David Cournapeau, Evgeni Burovski, Pearu Peterson, Warren Weckesser, Jonathan Bright, et al. 2020. Scipy 1.0: fundamental algorithms for scientific computing in python. Nature methods, 17(3):261–272.
- Williams (1959) Evan James Williams. 1959. Regression Analysis, volume 14 of WILEY SERIES in PROBABILITY and STATISTICS: APPLIED PROBABILITY and STATIST ICS SECTION Series. Wiley.
- Zouhar et al. (2024) Vilém Zouhar, Shuoyang Ding, Anna Currey, Tatyana Badeka, Jenyuan Wang, and Brian Thompson. 2024. Fine-tuned machine translation metrics struggle in unseen domains. In Proceedings of the 62nd Annual Meeting of the Association for Computational Linguistics (Volume 2: Short Papers), pages 488–500, Bangkok, Thailand. Association for Computational Linguistics.