Hot subdwarfs from the surviving companions of the white dwarf + main-sequence channel of Type Ia supernovae
Abstract
Some surviving companions of type Ia supernovae (SNe Ia) from the white-dwarf + main-sequence (WD + MS) channel may evolve to hot subdwarfs. In this paper, we preformed stellar evolution calculations for surviving companions of close WD + MS systems in the spin-up/spin-down model and the canonical non-rotating model to map out the initial parameter spaces in the orbital period - secondary mass plane in which the surviving companions can evolve to hot subdwarfs. Based on these results, we carried out a series of binary population synthesis calculation to obtain the Galactic birth rate of the hot subdwarfs from the WD + MS channel, which is for the spin-up/spin-down model and for the canonical non-rotating model. We also show the distributions of some integral properties of the hot subdwarfs, e.g. the mass and the space velocity, for different models. In addition, comparing our results with the observations of the intermediate helium-rich (iHe-rich) hot subdwarfs, the hot subdwarfs from the WD + MS channel may explain some observational features of the iHe-rich hot subdwarfs, especially for those from the spin-up/spin-down model. Although we expect that the SN Ia channel can only contribute a small fraction of the iHe-rich hot subdwarf population, some of these may help to explain cases with unusual kinematics.
keywords:
stars: supernovae: general - stars: chemically peculiar - stars: kinematics and dynamics - subdwarfs1 INTRODUCTION
As one of the best distance indicators because of their remarkable uniformity and high luminosity, Type Ia supernovae (SNe Ia) were used to measure the cosmological parameters, which led to the discovery of an accelerating expansion of the Universe and a mysterious dark energy (Riess et al. 1998; Perlmutter et al. 1999). SNe Ia are used to be cosmological probes for testing the equation-of-state of the dark energy (EOSDE) and its evolution with time (Howell 2011; Sullivan et al. 2011). SNe Ia are also very important to understand galactic chemical evolution owing to their major contribution of iron to their host galaxies (Greggio & Renzini 1983; Matteucci & Greggio 1986).
Although SNe Ia are so important in modern astrophysical fields, some basic problems with SNe Ia are still under debate, especially on their progenitor systems (Hillebrandt & Niemeyer 2000; Leibundgut 2000). It is now widely believed that a SN Ia is derived from a binary system with at least one carbon oxygen white dwarf (CO WD, Hillebrandt & Niemeyer 2000; Nugent et al. 2011). The CO WD accretes material from its companion to increase its mass until its mass reaches a maximum stable value to trigger a thermonuclear runaway in the WD. The released nuclear energy unbinds the WD and then a SN Ia is produced (Branch 2004; Hillebrandt et al. 2013). The companion of the CO WD may be a main-sequence or a slightly evolved star (WD+MS), a red giant star (WD+RG) or a helium star (WD + He star). This is the single degenerate (SD) model (Whelan & Iben 1973; Nomoto, Thielemann & Yokoi 1984). Or it may be another CO WD involving the merging of two CO WDs. This is the double degenerate (DD) model (Iben & Tutukov 1984; Webbink 1984). At present, both models obtain some support on both observational and theoretical sides (Ruiz-Lapuente 2019; Jha et al. 2019).
A basic way to distinguish between the SD and the DD models is to search for surviving companions in supernova remnants (SNRs) because the SD model predicts the existence of surviving companions in SNRs but not from the DD model. It shows the power of the method for the discovery of some potential surviving companions in some SNRs (Ruiz-Lapuente et al. 2004; Li et al. 2017). However, many teams also reports that they did not find any candidate of the surviving companions in other SNRs. This seems to favour the DD model (González Hernández et al. 2012; Schaefer & Pagnotta 2012; Ruiz-Lapuente et al. 2018; Kerzendorf et al. 2018). A possible solution for this embarrassment of the SD model is the so-called spin-up/spin-down model. The WDs may experience a long spin-down phase before supernova explosion and then the companions become too dim to be detected (Justham 2011; Di Stefano & Kilic 2012). Before supernova explosion, some companions are proposed to become low-mass helium WDs (Justham 2011; Di Stefano & Kilic 2012), but such a suggestion has not been confirmed by searching for the surviving WD companion in SN 1006 (Kerzendorf et al. 2018). One possible reason is the huge uncertainty of the spin-down timescale (Di Stefano et al. 2011; Meng & Podsiadlowski 2013). Recently, Meng & Li (2019) noticed that some surviving companions from the WD + MS channel are hot subdwarfs at the supernova moment (see also the discussion by Justham 2011), and then they suggested that the surviving companions of SN 1006 and Kepler’s supernova could be hot subdwarf B (sdB) stars111The surviving companions of SNe Ia from the WD + He star channel are single hyper-velocity hot subdwarfs (Justham et al. 2009; Wang & Han 2009), but because of mass transfer and tight orbit before supernova explosion, such hot subdwarfs are more likely to be extremely helium-rich ones with rapidly rotational velocity, as observed in US 708 and J2050 (Geier et al. 2015; Ziegerer et al. 2017). In this paper, we do not want to study those high-velocity runaway hot subdwarfs from SNe Ia with helium-rich donors in short-period orbits (Wang & Han 2009).. Hot subdwarfs are generally helium-core-burning stars with extremely thin hydrogen-rich envelopes (Heber 2009, 2016).
In addition, a surviving companion may not always associate with a SNR because its life is much longer than the typical life time of a SNR (a few yr, Sarbadhicary et al. 2017). For example, Pietrukowicz et al. (2017) discovered a new kind pulsator, the blue large-amplitude pulsators (BLAPs) which are probably single stars. Based on the common envelope wind (CEW) model developed by Meng & Podsiadlowski (2017), Meng et al. (2020) found that all the properties of BLAPs can be reproduced by the surviving companions of SNe Ia from the WD + MS channel, and they are also core-helium-burning stars, similar to hot subdwarfs. Moreover, Meng et al. (2020) also noticed that some surviving companions of SNe Ia from the WD + MS channel may evolve to hot subdwarfs if their hydrogen-rich envelope is thin enough at the moment of the supernova explosion. The surface helium abundance and the effective temperature of the hot subdwarfs from the WD + MS channel are consistent with the intermediate He-rich (iHe-rich) stars. However, Meng et al. (2020) did not consider the effect of the spin-up/spin-down model. In particular, they did not show the initial parameter space, and then the birth rate of the hot subdwarfs from the WD + MS channel. Following Meng & Li (2019) and Meng et al. (2020), we want to study the production of the hot subdwarfs from the WD + MS channel in details, especially their birth rate. In addition, we also try to constrain the contribution of the hot subdwarfs from the WD + MS channel to the iHe-rich population by a large sample from the survey of the Large Sky Area Multi-Object Fiber Spectroscopic Telescope (LAMOST).
In Sec. 2, we describe our methods and then present the calculation results in Sec. 3 and Sec. 4. In Sec. 5, we summarize the properties of the hot subdwarfs from the WD + MS channel and compare our results with observations. We discuss the uncertainties of our results and the other possible contributors to the iHe-rich hot subdwarf stars in Sec. 6 and summarize our main conclusions in Sec. 7.
2 METHODS
Following Meng et al. (2020), we use the CEW model to calculate the binary evolution of the WD + MS systems, where the mass transfer from the companions to the WDs may begin when the companions are on the MS or in the Hertzsprung gap (HG). The basic prescriptions of binary evolution for the WD + MS systems are the same to those used by Meng & Podsiadlowski (2017), and so we do not give the repetitious details here. As far as the properties of the surviving companion after the supernova explosion are concerned, the difference for most cases between the CEW and the optically thick wind (OTW) models is not very significant (Hachisu et al. 1996). In particular, the distributions of the initial binary parameters, i.e. initial WD masses, initial companion mass and initial orbital period, between the CEW and the OTW models are also similar because of similar initial parameter space for SNe Ia. However, as shown by Meng & Podsiadlowski (2017), some systems that cannot produce SNe Ia in the OTW model do so in the CEW model.
In theory, the accreting WD may spin up by gaining the angular momentum of the accreted materials and a rapidly rotating WD may even increase its mass to exceed 1.378 rather than explode immediately (Yoon, Langer & Scheithauer 2004; Yoon & Langer 2005). The rotating super-Chandrasekhar WDs will experience a spin-down phase before they explode as SNe Ia (Justham 2011; Di Stefano & Kilic 2012; Hachisu et al. 2012). The spin-down phase is also required by the observations of some SNe Ia (Soker 2018, 2019). However, at present, there are still many uncertainties on the spin-up/spin-down model, e.g. the spin-down timescale although a few yr is favoured (Meng & Podsiadlowski 2018; Soker 2019), the exact time of the onset of the spin-down phase (Meng & Podsiadlowski 2013) and WD growth pattern after . So, following Meng & Li (2019), we define a pseudo spin-down timescale, , that is the time interval from when to the time of supernova explosion. Here, we set yr for the spin-up/spin-down model222Based on the definition of the pseudo spin-down timescale here, a real spin-down timescale for the cases considered here is shorter than the pseudo spin-down timescale of yr (Meng & Li 2019).. During the pseudo spin-down phase, we simply assume the same WD growth pattern as for (Meng & Podsiadlowski 2017; Meng & Li 2019). As a comparison, we also consider a case with , which corresponds to the canonical non-rotating model as in Meng et al. (2020). Then, in the following part of the paper, the cases with yr and yr refer to those from the spin-up/spin-down model and the canonical non-rotating model, respectively.
After the supernovae, we continue to evolve the surviving companions as single stars with a Reimers’s wind with (Reimers 1975; Fusi-Pecci & Renzini 1976). To study the birth rate of the hot subdwarfs from the WD + MS channel, we calculated a dense model grid with different initial WD masses, different initial secondary masses and different initial orbital periods to check the parameter space in which the surviving companions can evolve to hot subdwarfs. The initial masses of the companions, , range from 2.2 to 4.0 with a step of 0.1 . Because hybrid carbon-oxygen-neon WDs (CONe WDs) could produce some special SNe Ia, e.g. SN 2002cx-like or SN Ia-CSM objects, we assume that a WD with a mass as massive as 1.3 can lead to a SN Ia (Chen et al. 2014; Meng & Podsiadlowski 2014, 2018). Then, the initial masses of the WDs, , range from 0.8 to 1.30 with a step of 0.1 . The initial orbital periods of binary systems, , from 1 day, at which the companions fill their Roche lobes at MS, to about day, at which the companions fill their Roche lobes at the end of the HG, with a step of 0.1 in . We so obtain the parameter space for the hot subdwarfs from the WD + MS channel.
Based on this parameter space, we made a series of binary population synthesis (BPS) calculations using the rapid binary evolution code developed by Hurley, Pols & Tout (2000) and Hurley, Tout & Pols (2002). If a binary system in the simulations evolves to the WD+MS stage and is at the onset of Roche-lobe overflow (RLOF) and is located in the (, ) plane for a SN Ia whose surviving companion can evolve to a hot subdwarf, we assume that the supernova explosion leads to the formation of a hot subdwarf. We followed the evolution of sample binaries, where the primordial binary samples are generated in a Monte Carlo way. For the Monte Carlo simulations, we use (1) a constant star formation rate of 5 (Willems & Kolb 2004), or a single starburst of , (2) the initial mass function (IMF) of Miller & Scalo (1979), (3) a uniform mass-ratio distribution, (4) a uniform distribution of separations in for binaries, where is the orbital separation, (5) circular orbits for all binaries, and (6) For BPS simulations, the common-envelope ejection efficiency, , is the key parameter to affect the birth rate of hot subdwarf stars. Following Meng & Podsiadlowski (2017), we take or (see Meng, Chen & Han 2009 and Meng & Podsiadlowski 2017 for details).
3 BINARY EVOLUTIONARY RESULTS
Whether or not the surviving companion of a SN Ia may evolve to a hot subdwarf depends on the initial parameters of a WD + MS system. In this section, we present how theses parameters affect the evolution of surviving companions, and summarize our stellar evolutionary outcomes.

3.1 Dependence on the initial binary parameters
3.1.1 Dependence on the initial WD mass
In Fig. 1, we show the evolution of the companions in the Hertzsprung–Russell (HR) diagram from the systems with different initial WD masses and , where the initial companion mass and the initial orbital period are [=[, 0.7]. For these cases, the companions fill their Roche lobes in the HG and then mass transfer begins. In Fig. 1, the surviving companions from the systems with and can become hot subdwarfs. However, for the case with , the following evolution of the surviving companion, after supernova explosion, is quite similar to that of a single star. The star consecutively experiences the RG, horizontal branch (HB) and AGB phases. Interestingly, there is a transitional case when . For this case, when the star evolves into the HB phase, its hydrogen-rich envelope is not very thick. With the consumption of the envelope by shell hydrogen burning, the envelope becomes thinner and thinner, and then the effective temperature may become as high as 20000 K. Such different evolutions of the companions after supernova explosion are derived from the different hydrogen-rich envelope masses at the moment of the supernova explosion, i.e. the thicker the envelope, the more similar is the evolution of the surviving companion to a single star. For a system with a given initial companion mass and a given initial orbital period, a less massive initial WD means more accreted material from its companion before it explodes as a SN Ia and a less massive companion with a thinner envelope.
Once the helium in the centre of the surviving companion is exhausted, some hot subdwarfs evolve to a helium RG phase and finally become WDs, while the others become WDs directly, without a helium RG phase333As shown in Fig. 1, in our calculations, some companions experience a series of hydrogen flashes after their helium RG phases. For such cases, we stop our calculation after several hydrogen flashes because this does not affect our discussion on hot subdwarfs.. Such different evolutions are mainly caused by the different helium envelope masses when the helium is exhausted in the centre. Generally, if the helium envelope is more massive than 0.3 , the hot subdwarfs experience a RG phase (Justham et al. 2011). In addition, in Fig. 1, we also plot the proposed companion to SN 2012Z (McCully et al. 2014), whose position in the HR diagram is consistent with a helium RG star as discussed by Wang et al. (2014) and Liu et al. (2015).

3.1.2 Dependence on the initial orbital period
In Fig. 2, we show the evolution of the companions in the HR diagram from the systems with different initial orbital periods and yr, where the initial WD mass and the initial secondary mass are 1.2 and 3.5 , respectively. Fig. 2 shows that, for the cases in which mass transfer begins when the companions are in the HG, the companions are hot subdwarfs at the moment of supernova explosion because of a long spin-down timescale. After the exhaustion of the central helium, the hot subdwarfs evolve to the WD branch directly owing to their low mass.
However, for the system with , mass transfer begins when the companion is on the MS, and then the companion is still a MS star at the moment of the supernova explosion. However, the surviving companion still can evolve to the hot subdwarf stage after the MS, RG and a short-life HB phase. The luminosity of the hot subdwarf is significantly higher than those of the other cases. After helium is exhausted in the centre of the hot subdwarf, it experiences a helium RG phase before it enters the WD branch for a relatively large mass. Therefore, the surviving companion consecutively experiences the MS, HG, RG, HB, sdB, helium RG and WD phase within about 350 Myr.

3.1.3 Dependence on the initial companion mass
Similarly, in Fig. 3, we show the evolutionary tracks of the companions in the HR diagram, where the initial binary systems with [ = [, 0.5] have different initial companion masses. The basic evolutionary tracks are similar to those shown in Fig. 2. For the system with , the supernova occurs when the companion is a RG star (see also Meng & Li 2019), and then there is still a relatively thick hydrogen-rich envelope at the moment of the supernova explosion. This is main reason why it has a lower effective temperature.


3.2 The properties of the companions at supernova moment
According to above discussions, whether a surviving companion may or not become a hot subdwarf is heavily dependent on the envelope mass and the core mass of the companion at the moment of the supernova explosion, i.e. the thinner the envelope of the companion, the more likely is the star to evolve to the hot subdwarf phase. In Fig. 4, we show the correlation between the core to companion mass ratio () and the envelope mass () at the moment of the supernova explosion (left panel), and the surface helium abundance of the companion vs. the envelope mass (right panel). All the systems discussed in Sec. 3.1 are included in Fig. 4. The figure clearly shows that the more massive the envelope, the lower the ratio of the core mass to the companion mass, and the lower the surface helium abundance. There are boundaries for the stars that can evolve to hot subdwarfs, , , and . Moreover, because the lifetimes of the transitional cases (green squares in Fig. 4) with a high effective temperature is short, we exclude them from the hot subdwarfs in our remaining discussion. Nonetheless, Meng et al. (2020) verified that the properties of the BLAPs are consistent with core-helium-burning stars, and then in this paper, we do not discriminate the BLAPs from the hot subdwarfs.

3.3 Parameter space for hot subdwarfs
All the surviving companions from the WD + He star channel show the properties of hot subdwarf or helium RG stars (Wang et al. 2014; Liu et al. 2015), but not all the surviving companions from the WD + MS channel may evolve to the hot subdwarfs. In Fig. 5, we show the parameter space leading to the hot subdwarfs in the initial orbital period – secondary mass () plane with and yr. The figure shows that no matter how long is the spin-down timescale, some binary systems always produce hot subdwarfs. Compared with the initial parameter space for SNe Ia, the parameter space for the hot subdwarfs locates at the upper–right region in the plane. The parameter space leading to hot subdwarfs for the spin-up/spin-down model is larger than that for the canonical non-rotating model. This is easy to understand because a longer spin-down timescale means a thinner envelope of the companion at the moment of supernova explosion and then the companion is more likely to evolve to the hot subdwarf phase. So, we expect that the spin-up/spin-down model leads to a higher birth rate of the hot subdwarfs than the canonical non-rotating model. In addition, for the models with , many systems for which mass transfer begins at the end of the MS may produce hot subdwarfs, while for the models with yr, only the system for which mass transfer begins at the HG stage can produce hot subdwarfs. In particular, if , no surviving companion can evolve to the hot subdwarf phase. This does not depend on the spin-down timescale. Therefore, the majority of SNe Ia cannot produce the hot subdwarfs because the distribution of the initial WD mass for SNe Ia peaks at (Meng, Chen & Han 2009).

3.4 The outcomes of the evolution of the surviving companions
In Fig. 6, we show the outcomes of the evolution of the surviving companions for different initial WD masses in the HR diagram, in which the dots represent the times for which the surviving companions have the lowest luminosity during the hot subdwarf phase, while the crosses represent the times for which helium is exhausted in the centres of the surviving companions. Because the initial parameter space for yr covers that for yr, we here only show the results from the cases with yr. Fig. 6 shows that the hot subdwarfs from the WD + MS channel are divided into two groups. The first group, with relatively higher luminosity, is from the systems for which mass transfer begins on the MS, and the second one, with relatively lower luminosity, is from the systems for which mass transfer starts in the HG. The higher luminosity for the first group are from their larger masses than the second group.
4 BINARY POPULATION SYNTHESIS RESULTS
Based on the parameter space for hot subdwarfs in Fig. 5, we carry out a series of BPS calculations. In this section, we show our BPS results.


4.1 Birth rate
Fig. 7 shows the Galactic birth rates of the hot subdwarfs from the surviving companions of SNe Ia from the WD + MS channel for different spin-down timescales and different . As expected in Sec. 3.3, the birth rates from the cases with yr are always higher than those from the cases with yr, no matter what is. The Galactic rate of the hot subdwarfs from the SN Ia channel is for the cases with yr and for the cases with yr. As expected, the birth rate of the hot subdwarfs is significantly lower than the Galactic birth rate of the SNe Ia from the SD channel, i.e. 7% to 46% of SNe Ia may lead to hot subdwarfs, depending on different assumptions.
The evolution444Here, we neglected the time interval from the supernova explosion to the formation of a hot subdwarf because it is much shorter than the timescale from the formation of a primordial binary to supernova explosion. of the birth rate of the hot subdwarfs from the SN Ia channel for a single starburst is presented in Fig. 8. Comparing the evolution with those for SNe Ia, the evolution of the birth rate of the hot subdwarfs has a lower peak and a shorter delay time. The delay time is shorter than 1 Gyr, and then such hot subdwarfs belong to young population. In addition, the hot subdwarfs from the cases with yr have a longer delay time than those from yr for their less massive initial companions (see Fig. 5).


4.2 The mass and orbital velocity of the companions at supernova moment
At the moment of the supernova explosion, the supernova ejecta may impact the companion and strip off a part of its envelope and the companion may also get a kick velocity (Marietta et al. 2000; Meng et al. 2007). However, the amount of the stripped-off material is relatively small compared to the companion mass and the kick velocity is also relatively small compared to the orbital velocity of the binary at the moment of the supernova explosion, especially for the cases in which the companions are hot subdwarfs at the supernova (Meng & Li 2019). After the supernova explosion, we evolve the surviving companions as single stars, where the Reimers’s wind cannot significantly change its mass. So, to great extent, the companion mass and the orbital velocity at the moment of the supernova explosion may represent the mass and space velocity of a surviving companion.
In Fig. 9, we show the distributions of the companion mass and the orbital velocity at the moment of the supernova explosion for the cases of yr and yr, respectively. Here, we only show the cases with because the cases with are similar. For the case with yr, the companion mass (orbital velocity) almost uniformly distributes between 0.65 and 1.05 (between 100 and 200 ). However, for the case with yr, the companion mass is between 0.35 and 1.0 , but focuses on 0.4 . The orbital velocity is between 50 and 200 , but focuses on 150 . In addition, there is a significant group in the right panel of Fig. 9 around and , where the companions are the hot subdwarfs at the supernova. The MS surviving companions generally have a mass between 0.6 and 1.0 and an orbital velocity between 150 and 200 at the moment of the supernova explosion (see Meng & Li 2019). Roughly, there is a correlation between the companion mass and the orbital velocity, i.e. the higher the companion mass, the higher the orbital velocity. This can be easily explained by binary evolution. For a given initial WD + MS binary system, the mass ratio of the companion to the WD may be reversed because of the mass transfer between the WD and its companion (Han & Podsiadlowski 2004; Meng & Yang 2010a). For the case of yr, the mass ratio for all the systems is reversed at the supernova, and the smaller the mass ratio (the less massive the companion), the longer the orbital period and the smaller the orbital velocity.

Measuring the radial velocity of stars is an important way to search for the surviving companion of a SN Ia (Ruiz-Lapuente et al. 2004) and the radial velocity may be obtained by spectral observations, such as in the LAMOST survey (Luo et al. 2019). In Fig. 10, we show the distributions of the radial velocities of the hot subdwarfs for different , where their orbital inclinations are uniformly generated in . Here, we only show the cases with yr, because a spin-down time scale of a few yr may be necessary for SNe Ia (Soker 2018; Meng & Podsiadlowski 2018; Meng & Han 2018). The distributions of the radial velocities for different are similar, i.e. a peak around 120 with a sharp cutoff at 180 and a long tail to 0, because of the similar distribution of the orbital velocities for different .


5 COMPARISON WITH OBSERVATIONS
5.1 Comparison with observations
Surface helium abundance is a very important factor to differentiate different sub-classes of hot subdwarfs. Observationally, hot subdwarfs are divided into several groups according to their surface helium abundance and effective temperature (Németh et al. 2012). For example, about 10 to 20 percent of hot subdwarfs have a helium-rich atmosphere and such hot subdwarfs may be further divided into two sub-classes, extremely helium-rich stars with and iHe-rich stars with , where and are the surface number densities of helium and hydrogen, respectively (Luo et al. 2016, 2019)555We notice that different authors (Drilling et al. 2013; Martin et al. 2017; Luo et al. 2016, 2019) applied different abundance calibrations for iHe-rich stars but these calibrations only slightly affect the relative fraction of iHe-rich stars in the whole subdwarf population.. The iHe-rich stars were first discovered by Németh et al. (2012), but definitely confirmed to be an independent sub-group by a sample from the survey of LAMOST, which clearly showed a new group of hot subdwarfs with and K in plane (Luo et al. 2016, 2019).
Here, we collected the atmospheric parameters of some hot subdwarfs from the GALEX and LAMOST surveys (Németh et al. 2012, Luo et al. 2016, 2019; Lei et al. 2019, 2020), and plotted them into a plane (Fig. 11), where the stars with significant binary signals are excluded. The four BLAPs (Pietrukowicz et al. 2017) with spectral observations and two iHe-rich pulsators (Green 2011; Latour et al. 2019) are also included in the figure. The figure clearly shows four groups noticed by Németh et al. (2012) and Luo et al. (2016), where group 4 represents the iHe-rich ones. Nonetheless, the figure also shows some new features: 1) the position of the BLAPs in the plane is quite close to the group 4, with a slightly lower effective temperature, showing a connection between the BLAPs and iHe-rich hot subdwarfs; 2) there seems to exist a sub-group at the bottom of group 3 [] connecting with group 4.
By analyzing the kinematic properties of some iHe-rich hot subdwarfs, Martin et al. (2017) suggested that the iHe-rich stars with halo orbits could be the surviving companion of SNe Ia. Meng et al. (2020) also showed that the surface helium abundance of the hot subdwarfs from the WD + MS channel may be consistent with the iHe-rich ones. As an example, Fig. 12 shows the evolution of the core mass and surface helium abundance of the surviving companion from the system with initial parameters of [=[] and yr after supernova explosion. The definition of the core mass is the same as that used by Han et al. (1994) and Meng et al. (2008) and the difference between and may roughly represent the hydrogen-rich envelope mass of the surviving companion. After the supernova explosion, the companion ascends the red giant branch (RGB), where its surface helium abundance increases significantly with large-scale convection in its envelope. After helium is ignited in the centre of the star at the tip of the RGB, the companion becomes a horizontal branch (HB) star and stays on the HB for a while. On the HB, large-scale convection ceases in the envelope, and the surface helium abundance no longer changes until the star becomes a helium red giant, where a large-scale convective envelope develops again, leading to a second phase of increasing surface helium abundance. During the HB phase, shell hydrogen burning above the helium-burning core continues to consume the hydrogen-rich envelope. When the hydrogen-rich envelope is so thin that the shell hydrogen burning ceases, the star becomes a hot subdwarf with an iHe-rich atmosphere, as shown in Meng et al. (2020).
However, in this paper we do not consider the effects of radiative levitation and gravitational settling because it is still quite uncertain in how these effects affect the surface helium abundance of hot subdwarfs (see the discussion by Heber 2016). If these effects are not significant, the hot subdwarfs formed from this channel would show the atmospheric properties of iHe-rich ones for as long as about yr. Nonetheless, the real time spent in iHe-rich phase is probably much shorter than that in our models, because our models omit some of the physics. In the following parts of the paper, we adopt the most optimistic assumption that the hot subdwarfs from the SN Ia channel are iHe-rich.

Since we can not directly compare our results with observations in the plane for omitting some of the physics, we want to check whether or not the hot subdwarfs from the WD + MS channel may reproduce the position of iHe-rich hot subdwarfs in diagram. In Fig. 13, we show the evolution of the companions in a diagram, where the systems are the same to those in Fig. 1. In the figure, we also plot some hot subdwarfs belonging to group 4 and as shown in Fig. 11. Although the evolutionary tracks covers some iHe-rich hot subdwarfs with relatively lower gravities, they cannot cover most of the iHe-rich ones. In addition, the transitional case shown in Fig. 1 does not appear as the hot subdwarfs.


Similarly, in Fig. 14, we show the evolution of the companions in a diagram from systems with yr and () = (, ), but with different initial orbital periods (left panel), and with [ = [, 0.5] but with different initial companion masses (right panel). The evolutionary tracks of the surviving companions cover the iHe-rich hot subdwarfs in the diagram well, i.e. the hot subdwarfs from the SN Ia channel present the properties of group 4 stars during their central helium burning phase, and appear as those with when the central helium is almost exhausted. This indicates that there could be an evolutionary connection between the stars in group 4 and those with .


In Fig. 15, we show the outcomes of the evolution of the surviving companions for all the models with yr (left panel) and yr (right panel) in the diagram, and make a comparison with the hot subdwarfs belonging to group 4 and as shown in Fig. 11. The dots in the figures represent the times for which the surviving companions have the lowest luminosity during the hot subdwarf phase, while the crosses represent the times for which helium is exhausted in the centres. Generally, for the cases with yr, the hot subdwarfs from the SN Ia channel have a lower gravity than those belonging to group 4 and with , as shown in Fig. 13. However, for the cases with yr, the outcomes may well cover the regions of the hot subdwarfs belonging to group 4 and those with . Again, the results here also indicate that there could be an evolutionary connection between group 4 and stars with .
Comparing the results in Fig 15, there are two groups of hot subdwarfs in the right panel, as shown in Fig. 6, while only one group in the left panel. For the group in the left panel, the initial binary systems begin mass transfer when the companions are in the HG (see also Fig. 5). However, in the right panel of Fig. 15, the first group, with relatively higher surface gravity, are from the systems for which mass transfer starts in the HG, while the second one, with relatively lower surface gravity (i.e. the declining sequence in the right panel), are from the systems for which transfer starts on the MS. In particular, the group in the left panel and the second group in the right panel cover a similar region in plane. The difference between the two panels is because that a longer spin-down timescale leads to a hot subdwarf with a thinner hydrogen-rich envelope. The envelope thickness of a hot subdwarf can significantly affect its observational properties (see Xiong et al. 2017). In addition, there is a tail for the first group in the right panel. This comprises the systems for which the supernova explosion occurs when the companions are RG stars (see also Fig. 3).
In Fig. 15, we also compare our results with the BLAPs and high-gravity BLAPs (hgBLAPs) (Pietrukowicz et al. 2017; Kupfer et al. 2019). Our model may reproduce the positions of the BLAPs in the plane, no matter how long the spin-down timescale. However, for the cases with yr, the BLAPs are from the systems for which mass transfer starts in the HG (see also Meng et al. 2020), while they are from the systems for which mass transfer starts on the MS for the cases with yr. Based on their positions in Fig. 15, we may conclude that the BLAPs are in the middle and late helium-burning phase, consistent with previous studies (Wu & Li 2018; Meng et al. 2020). The hgBLAPs have similar properties to the BLAPs except for their high surface gravity and low surface helium abundance (Kupfer et al. 2019). Our model may also reproduce their positions in the plane. Assuming a fundamental mode for hgBLAPs, Kupfer et al. (2019) deduced that hgBLAPs have masses ranging from 0.25 to 0.35 and then they suggested that the hgBLAPs and the BLAPs could belong to the same class of pulsators, composed of young helium core pre-white dwarfs. However, if the hgBLAPs and BLAPs were the young helium core pre-white dwarfs, there would be a substantial pulsation period drift of , which is one magnitude larger than what is observed for the BLAPs (Pietrukowicz et al. 2017; Calcaferro et al. 2021). Meanwhile, if the pulsation modes of the hgBLAPs were the first overtone, their masses range from 0.45 to 1.1 , consistent with the mass range of the hot subdwarfs in this paper (see Fig. 9).
5.2 The properties of the hot subdwarfs from the WD + MS channel
Compared to the standard binary evolutionary origin of the hot subdwarfs (Han et al. 2002, 2003; Zhang et al. 2017), the hot subdwarfs from the WD + MS channel may show some special properties.
I) Depending on different models, the Galactic birth rate of the hot subdwarfs from the SN Ia channel is between and , which means that the SN Ia channel may contribute to 2.1 to 3.7 percent of single hot subdwarfs (Han et al. 2003). The hot subdwarfs from the channel may contribute to some iHe-rich ones, but we can not give the exact contribution to the iHe-rich population based on the results here, because many mechanisms are neglected, such as gravitational settling, radiative levitation, radiation-driven winds, surface rotation and magnetic fields, etc, which are quite uncertain in theory (see the discussion in Heber 2009, 2016).
II) The hot subdwarfs from the SN Ia channel are single stars, which inherit the orbital velocity of the binary systems at the moment of the supernova explosion (Canal et al. 2001; Hansen 2003; Han 2008a). Because the velocity direction is random, some hot subdwarfs from SNe Ia could show some special Galactic kinematical properties, such as a disk orbit with a high eccentricity and a retrograde velocity (Randall et al. 2015; Martin et al. 2017).
III) The hot subdwarfs from the SN Ia channel belong to a young population with a delay time of less than 1 Gyr, but they do not always associate with young populations because they may leave their birth place due to their inherited orbital velocities. Some surviving companions are unusual MS stars at the supernova moment (see, e.g., the solid line in Fig. 2), and may leave their birth places by as much as tens of kpc before they become hot subdwarfs (see also Sec. 3.1.2). The association of a surviving hot subdwarf with a supernova remnant means that the surviving companion were a hot subdwarf at the time of supernova explosion, such as those of Kepler’s supernova and SN 1006 (Meng & Li 2019).
IV) After the impact of the supernova ejecta on the surviving companions, their atmosphere may be polluted by the supernova ejecta. Therefore, some hot subdwarfs from the SN Ia channel could show an enhancement of the iron-peak elements. However, it could be difficult to distinguish the enhancement from that derived from radiative levitation.
5.3 Constraints from Galactic kinematical observations
The hot subdwarfs from the SN Ia channel may show some special Galactic kinematical properties (Hansen 2003 and Justham et al. 2009). Martin et al. (2017) studied the kinematics of 88 hot subdwarfs and suggested that the iHe-rich ones with extreme halo orbits could originate from the surviving companions of SNe Ia, which reveals a clue on the contribution of the SN Ia channel to the iHe-rich hot subdwarfs, i.e. 2 or 3 in 27 iHe-rich hot subdwarfs are possible from SN Ia channel. In this section, we replicate a similar analysis to Martin et al. (2017) by using a large sample of 747 hot subdwarfs from the LAMOST survey in Luo et al. (2019) to constrain the potential contribution of the hot subdwarfs from the SN Ia channel to the iHe-rich one. The volume completeness of the sample is more than 92% (Luo et al. 2020). Luo et al. (2019) divided the sample into four subclasses based on the surface helium abundance , where and are the number densities of helium and hydrogen, respectively. Based on the classifications by Luo et al. (2019), we named the groups with as He-rich, as iHe-rich, as He-deficient and as extremely helium deficient (eHe-deficient). In the sample, the completeness of the He-deficient group is relatively better than the others and the He-deficient group has the standard binary evolutionary origin (Luo et al. 2019). So, we here only compare the Galactic kinematical properties of the iHe-rich group with the He-deficient group.
If the SN Ia channel partly contribute to the iHe-rich hot subdwarfs, due to the random direction of the inherited orbital velocity, it is expected that the iHe-rich hot subdwarfs have a similar average space velocity to that of the He-deficient ones but with a larger standard deviation, and the fraction of the iHe-rich stars with a high/low space velocity would be larger than that of the He-deficient group. For the same reason, the distributions of the Galactic kinematical properties of the iHe-rich hot subdwarfs, e.g. the orbital eccentricity, the orbital maximum vertical amplitude (), -component of the orbital angular momentum (), the apocentre radius () and the pericentre radius () of the orbit in the Galaxy, would be different from those of the He-deficient ones.


Actually, both Martin et al. (2017) and Luo et al. (2019) noticed that iHe-rich hot subdwarfs show a more diverse kinematic distribution than He-deficient ones, and suggested that the higher dispersion are from the pollution by halo population. In Fig. 16, we show the distributions of the space velocities of the He-deficient and iHe-rich stars, where , and , and are the Cartesian Galactic velocities, directed toward the Galactic centre, the Galactic rotation and North Galactic Pole, respectively. The left panel is for the total sample and the right one is for the thin disk sample. As expected, the distribution of the space velocities between the He-deficient and the iHe-rich groups are similar, e.g. a similar mean space velocity. The Kolmogorov–Smirnov (K–S) tests give a -value of 0.578 and 0.396 for the total and thin disk samples, respectively, where -value represents the probability that two distributions are chosen from the same underlying population. In addition, the distributions for the iHe-rich group show a higher standard deviation, as noticed by Martin et al. (2017) and Luo et al. (2019). In particular, the iHe-rich group have a higher fraction of high/low space velocities than those for the He-deficient sample and the fraction of the iHe-rich stars with a high space velocity for the thin disk sample is even higher than that from the sample with the halo population (see Table 1). So, it seems difficult to explain the differences of the distributions of the space velocities between the He-deficient and the iHe-rich stars solely by a pollution mechanism from halo stars, while the inherited orbital velocity from the binary system at the supernova moment could partly contribute to the difference.
| subsample | number | fraction () | fraction () | ||
|---|---|---|---|---|---|
| () | () | (%) | (%) | ||
| iHe-rich (total) | 43 | 216 | 52 | 20.9 | 20.9 |
| He-deficient (total) | 216 | 218 | 44 | 10.1 | 15.7 |
| iHe-rich (thin) | 22 | 241 | 34 | 27.3 | 4.5 |
| He-deficient (thin) | 122 | 232 | 27 | 12.3 | 0.0 |

In Fig. 17, we show the distributions of the orbital eccentricity in the Galaxy for the He-deficient and iHe-rich groups, respectively. The two distributions are similar and a K–S test gives a -value of 0.239. Similarly, the distributions of , , and and of the orbit in the Galaxy look similar. For simplicity, we do not show the distributions. 2D K–S tests for and and for and gives a -value of 0.359 and 0.307, respectively. So, the distributions of the Galactic kinematical properties between the iHe-rich and He-deficient subgroup are indistinguishable, which indicate that the SN Ia channel cannot be the dominant contributor to the iHe-rich hot subdwarfs.
At present, we still cannot give a definitive conclusion on how large the contribution from the SN Ia channel to the iHe-rich popoulation is . Meng et al. (2020) suggested that BLAPs are helium-core-burning stars from SN Ia channel and live in the iHe-rich phase for a few yr (Pietrukowicz et al. 2017). If the hot subdwarfs from the SN Ia channel also stay in the iHe-rich phase for a few yr, the channel could contribute to the whole population of iHe-rich hot subdwarfs by a few percent. This is roughly consistent with the fraction difference between the iHe-rich stars and the He-deficient ones with high/low space velocities, and also consistent with the hint in Martin et al. (2017), i.e. 2 or 3 candidates in 27 iHe-rich hot subdwarfs are from SN Ia channel.
6 DISCUSSIONS
In this paper, following Meng et al. (2020), we study the hot subdwarfs from the surviving companions of SNe Ia in details, and give the birth rate of the hot subdwarfs from the WD + MS channel. Such hot subdwarfs may present some properties of the iHe-rich ones. In this section, we discuss the uncertainties of this work and the other possible origin of the iHe-rich subdwarfs.

6.1 Uncertainties
In this paper, we only choose two limiting cases for spin-down timescale. Here, we choose a system with initial parameters of []=[, 0.7] as an example to check the effect of on the following evolution of the surviving companion in the HR diagram, as shown in Fig. 18. For this binary, the donor star fills its Roche lobe in the HG, and then the WD accretes hydrogen-rich material from the donor increasing its mass. After about yr, the WD mass reaches at which mass it would explode (Nomoto, Thielemann & Yokoi 1984). Then, the WD enters into the pseudo spin-down phase, where is set to be yr, yr, yr and yr. yr after , the WD stops mass-increasing phase although the mass-transfer rate is still as high as , at which []=[, 0.1350]. Then, yr after , the mass transfer ceases. This case clearly shows that the exact time of the onset of the spin-down phase is quite unclear and depends on different assumptions (see the discussions in Meng & Podsiadlowski 2013 in details).
In Fig. 18, no matter how long is , the surviving companion from this initial binary system may evolve to a hot subdwarf. However, a longer leads to a lower luminosity of the hot subdwarf. This is because a longer means a longer mass-loss phase and then a less massive surviving companion. The masses of the surviving companions for , , and yr are 0.8349, 0.7182, 0.6100 and 0.5342 , respectively. So, for a given initial binary system, different will mainly affect the mass and then the luminosity of the hot subdwarf.
At the moment of supernova explosion, the supernova ejecta may impact on the companion and strip off some of their envelope, and at the same time, the companion may get a kick velocity (Marietta et al. 2000; Meng et al. 2007). We neglected the stripped-off effect and the kick velocity in this paper because they are not significant. If the interaction between supernova ejecta and the companion is considered, the upper limit to the masses (space velocities) of the surviving companions is slightly lower (higher) than those shown in Fig. 9. In addition, the stripping can slightly change the initial parameter space for the hot subdwarfs, and then the Galactic birth rates of the hot subdwarfs from the SN Ia channel is slightly higher than those shown in Fig. 7.
In this paper, we have not considered the WD + RG channel. After a supernova explosion, almost all the envelope of the companion from the WD + RG channel has been stripped off and the surviving companion consists of a helium core and a thin hydrogen-rich envelope (Marietta et al. 2000). If the core mass of the surviving companion at the moment of the supernova explosion is lower than the lower limit to ignite helium, the surviving companion becomes a single low-mass WD (Justham et al. 2009; Meng & Yang 2010b). Nevertheless, some surviving companions from the WD + RG channel may have helium cores as massive as 0.45 , and then they may become hot subdwarfs after ignition of helium (Justham 2011; Meng & Podsiadlowski 2013). So, the WD + RG channel may also produce single hot subdwarfs. However, detailed BPS results always give a quite low rate of SNe Ia from the WD + RG channel, although some arguments exist for the exact birth rate from the WD + RG channel (Hachisu et al. 1999; Han & Podsiadlowski 2004; Chen et al. 2011).
Although the hot subdwarfs from the WD + MS channel may reproduce some properties of iHe-rich ones and then the WD + MS channel could contribute some iHe-rich subdwarfs, we can not give the exact contribution from the SN Ia channel to the iHe-rich population because many mechanisms are neglected here, such as gravitational settling, radiative levitation, radiation-driven winds, surface rotation and magnetic fields, etc. The life time of a hot subdwarf star at the iHe-rich phase is heavily dependent on how these mechanisms play any kind of role, but this is quite uncertain in theory (see the discussion in Heber 2009, 2016). For example, some iHe-rich hot subdwarf stars show a strong enrichment of heavy elements, but some more helium-rich ones do not. This indicates that radiative levitation plays a key role in forming their atmospheric chemical pattern, but radiative levitation could be affected by the helium abundance (Dorsch et al. 2019; Naslim et al. 2020).
6.2 The other possible channel contributing to the iHe-rich hot subdwarf stars
Although there are still some puzzles with the formation of hot subdwarfs (Heber 2009, 2016), it is believed that binary interaction via one or two common-envelope (CE) ejection phases plays a key role to their formation (Han et al. 2002, 2003; Heber 2009). The merging of two helium white dwarfs which experience two common-envelope ejection phases may well explain the properties and the formation of the extremely helium-rich subdwarfs (Han et al. 2003; Zhang & Jeffery 2012). However, it is still unclear about the formation of iHe-rich ones, although several evolutionary scenarios are suggested, such as the late hot-flasher scenario (D’Cruz et al. 1996; Moehler et al. 2004; Miller Bertolami 2008), a post-common-envelope system in which the stratification of its atmosphere is incomplete (Naslim et al. 2012) and the merging of a He WD with a low-mass main-sequence star (Zhang et al. 2017).
As discussed in Section. 5.3, the SN Ia scenario may only contribute to a small fraction of the iHe-rich hot subdwarfs and other channels or mechanisms would contribute the special hot subdwarfs. For example, at least one iHe-rich subdwarf, CD-20∘1123, is in a close binary (Naslim et al. 2012; Martin et al. 2017), and this means that the standard binary evolution channels contribute to a few iHe-rich hot subdwarfs. Zhang et al. (2017) suggested a merging channel of a He WD and a low mass MS star to explain the formation of iHe-rich hot subdwarfs. According to the BPS results of Zhang et al. (2017), the Galactic birth rate of the iHe-rich hot subdwarfs from the merging channel of a helium WD + low-mass MS star is and the Galactic birth rate of the hot subdwarfs from the merging channel of two helium WDs is about . Because the typical lifetime of a hot subdwarf is yr and the typical lifetime of the iHe-rich hot subdwarfs from the merging channel of a helium WD + low-mass MS star is yr (see Fig. 5 in Zhang et al. 2017), the typical number ratio of the iHe-rich to the He-rich ones is , which is too low to compare with the observed ratio (0.347, Luo et al. 2019). The late hot-flasher scenario could also produce the iHe-rich hot subdwarfs, but a detailed comparison between the iHe-rich hot subdwarfs in Cen with the late-flasher evolutionary tracks shows that the late-flasher scenario has difficulty to explain the position of the iHe-rich hot subdwarfs in Cen in the – plane (Latour et al. 2014; Heber 2016). Naslim et al. (2011) suggested that the iHe-rich hot subdwarfs could be from merging double WDs as He-rich ones, and then their special atmosphere represents a snapshot of an evolving surface chemistry (see Naslim et al. 2012, 2013). This suggestion gets support from some observational facts and some theoretical hints. First, in the sample of Luo et al. (2019), about 22 percent of the hot subdwarfs have a helium abundance of , consistent with the BPS results that 11 to 24 percent of the hot subdwarf stars are from merged double WDs (Han et al. 2003). Second, both He-rich and iHe-rich samples have similar Galactic kinematics (Martin et al. 2017; Luo et al. 2019). More evidence comes from observation of the globular cluster Cen, in which there is a remarkable group significantly separated from other hot subdwarfs in the plane, with helium abundances of , and no obvious gap exists between the He-rich and iHe-rich hot subdwarfs (see Fig. 23 of Heber 2016). In addition, considering that Cen is a globular cluster or the core of a dwarf galaxy, its high fraction of the hot subdwarfs from merged double WDs is also consistent with theoretical expectations (Han 2008b). Moreover, the merging channel could produce rapid rotating stars and the rapid rotation could play a kind of role for the special surface chemistry of the hot subdwarfs in Cen (Tailo et al. 2015).
Martin et al. (2017) argued that if the atmospheres of the iHe-rich hot subdwarfs represent a snapshot of an evolving surface chemistry, the iHe-rich subdwarfs should share the kinematical properties of the helium-deficient ones, as we shown in Sec. 5.3. In addition, Martin et al. (2017) suggested that analyzing the population of the iHe-rich hot subdwarfs may provide constraint on their origin. However, for the relatively small size of their sample, Martin et al. (2017) did not get a statistically significant conclusion. The hot subdwarf sample in Luo et al. (2019) is much larger than that in Martin et al. (2017). We try to make a similar analysis to Martin et al. (2017) by this sample. Roughly, we may assume a constant star formation rate and a single star burst to represent the star formation history of the Galactic disk and halo, respectively. So, if most of the iHe-rich ones were to represent a snapshot of an evolving surface chemistry of merged double WDs, the number ratio of the iHe-rich to He-deficient hot subdwarf stars in the Galactic halo would be larger than that in the thin disk and/or the thick disk (Han et al. 2003; Han 2008b; Luo et al. 2019). In Fig. 19, we show the number ratio of the iHe-rich to He-deficient hot subdwarfs in the thin disk, the thick disk and the halo. The number ratio in the thin disk and the thick disk is similar, consistent with the assumption of a constant star formation rate in the Galactic disk, but the number ratio in the halo is larger than those in the thin and thick disks. However, the error bar of the number ratio in the halo is still large because of the statistics ()666If the sample in Luo et al. (2020) is combined, the number ratio of the iHe-rich to He-deficient hot subdwarfs in the halo is , which is significantly higher than those in the thin and thick disks, but with a smaller error bar..

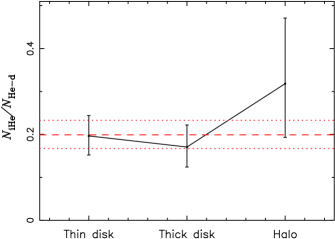
Moreover, to some extent, the fraction of halo stars in each subsample may represent the age of the subsample, because the larger the number ratio, the older the subsample (Martin et al. 2017). Because the iHe-rich hot subdwarfs from the SN Ia channel belong to a relatively young population, if majority of the iHe-rich ones are from the merging channel of two He WDs, the age of the iHe-rich hot subdwarfs could be younger than the He-rich ones, but older than the He-deficient ones. Therefore, it is expected that the fraction of halo stars in the iHe-rich subsample is smaller than in the He-rich one, but larger than in the He-deficient and eHe-deficient ones. Fig. 20 shows the fraction of halo stars in different subsamples, where the fraction for the He-rich subsample is the largest. As expected, the fraction for the iHe-rich subsample is lower than that for the He-rich one, but significantly larger than those for the He-deficient and eHe-deficient ones777The fraction of eHe-deficient subdwarfs seems slightly larger than that of He-deficient ones. This is mainly due to a selection effect in the sample of Luo et al. (2019), which overestimates the fraction of halo stars in the eHe-deficient group (see the detailed discussion of Luo et al. 2019).. So, the results in Figs 19 and 20 are consistent with the expectation that the iHe-rich ones are mainly from the merged double WDs and SN Ia channel contributes some of them.
7 CONCLUSIONS
Some of the surviving companions of SNe Ia from the WD + MS channel may evolve to hot subdwarfs. In this paper, we preform detailed stellar evolutionary calculation of the surviving companions from close WD + MS systems with different initial parameters for the spin-up/spin-down model and the canonical non-rotating model, and obtain the initial parameter space in which the surviving companion can evolve to hot subdwarfs. The parameter space for the spin-up/spin-down model is larger than that for the canonical non-rotating model. Based on the parameter space, we carry out a series of BPS calculation, and obtain the Galactic birth rate of the hot subdwarfs from the SN Ia channel, which is for the spin-up/spin-down model and for the canonical non-rotating model. We also show the distribution of some integral properties of the hot subdwarfs, e.g. the mass, the space velocity and the radial velocity. The hot subdwarfs from the SN Ia channel have a delay time of less than 1 Gyr, and then belong to relatively young population. However, some such hot subdwarfs may leave their birth place by as far as tens of kpc because of an inherited orbital velocity. The hot subdwarfs from the WD + MS channel can reproduce some observational properties of the iHe-rich hot subdwarfs, e.g. and , especially for our spin-up/spin-down model. So, the WD + MS channel is possible to contribute some iHe-rich hot subdwarfs. We also discuss the possible origins of the iHe-rich hot subdwarfs. An analysis of the population of a large LAMOST sample in Luo et al. (2019) is consistent with the previous suggestion that most of the iHe-rich hot subdwarfs are more possible from merged double WDs.
ACKNOWLEDGMENTS
We are grateful to both the onymous referee, Christopher Tout, the anonymous referee, and Zhengwei Liu for their detailed comments and suggestions which help us to improve the manuscript greatly. This work was supported by the NSFC (Nos. 11973080, 11733008 and U173111). We acknowledge the science research grants from the China Manned Space Project with NO. CMS-CSST-2021-B07. X.M. acknowledges the support by the Yunnan Ten Thousand Talents Plan - Young & Elite Talents Project, and CAS ‘Light of West China’ Program.
DATA AVAILABILITY
No new data were generated in support of this research, and all the data used in this article will be shared on request to the corresponding author.
References
- Branch (2004) Branch D., 2004, Nature, 431, 1044
- Calcaferro et al. (2021) Calcaferro, L. M., Córsico, A.H., Althaus, L.G., Bell, K.J., 2021, A&A, 647, A140
- Cameron (2011) Cameron, E. 2011, PASA, 28, 128
- Canal et al. (2001) Canal, R., Méndez, J., Ruiz-Lapuente, R. 2001, ApJ, 550, L53
- Chen et al. (2014) Chen, M. C., Herwig, F., Denissenkov, P. A. & Paxton, B. 2014, MNRAS, 440, 1274
- Chen et al. (2011) Chen X., Han, Z., Tout, C. A., 2011, ApJL, 735, L31
- D’Cruz et al. (1996) D’Cruz, N.L., Dorman, B., Rood, R.T., & O’Connell, R. W. 1996, ApJ, 466, 359
- Di Stefano et al. (2011) Di Stefano R., Voss R., & Claeys J.S.W., 2011, ApJL, 738, L1
- Di Stefano & Kilic (2012) Di Stefano R., & Kilic M. 2012, ApJ, 759, 56
- Dorsch et al. (2019) Dorsch, M., Latour, M., & Heber, U., 2019, A&A, 630, A130
- Drilling et al. (2013) Drilling, J.S., Jeffery, C.S., Heber, U., Moehler, S., Napiwotzki, R., 2013, A&A, 551, A31
- Fusi-Pecci & Renzini (1976) Fusi-Pecci F. & Renzini A., 1976, A&A, 46, 447
- Geier et al. (2015) Geier, S. et al., 2015, Science, 347, 1126
- González Hernández et al. (2012) González Hernández, J. I., Ruiz-Lapuente, P., Tabernero, H. M. et al., 2012, Nature, 489, 533
- Greggio & Renzini (1983) Greggio, L., Renzini, A., 1983, A&A, 118, 217
- Green (2011) Green, E.M., Guvenen, B., O’Malley, C.J. et al., 2011, ApJ, 734, 59
- Hachisu et al. (1996) Hachisu, I., Kato, M., Nomoto, K., ApJ, 1996, 470, L97
- Hachisu et al. (1999) Hachisu, I., Kato, M., Nomoto, K., 1999, ApJ, 522, 487
- Hachisu et al. (2012) Hachisu, I., Kato, M., Saio, H., Nomoto, K., 2012, ApJ, 744, 69
- Han et al. (1994) Han Z., Podsiadlowski P., Eggleton P.P., 1994, MNRAS, 270, 121
- Han et al. (2002) Han, Z., Podsiadlowski, Ph., Maxted, P. F. L., Marsh, T. R., Ivanova, N., 2002, MNRAS, 336, 449
- Han et al. (2003) Han, Z., Podsiadlowski, Ph., Maxted, P. F. L., Marsh, T. R., 2003, MNRAS, 341, 669
- Han & Podsiadlowski (2004) Han, Z., Podsiadlowski, Ph., 2004, MNRAS, 350, 1301
- Han (2008a) Han, Z., 2008a, ApJ, 677, L109
- Han (2008b) Han, Z., 2008b, A&A, 484, L31
- Hansen (2003) Hansen, B. M.S., 2003, ApJ, 582, 915
- Heber (2009) Heber, U., 2009, ARA&A, 47, 211
- Heber (2016) Heber, U., 2016, PASP, 128, 082001
- Hillebrandt & Niemeyer (2000) Hillebrandt, W., Niemeyer, J.C., 2000, ARA&A, 38, 191
- Hillebrandt et al. (2013) Hillebrandt, W., Kromer, M., Röpke, F.K., Ruiter, A.J. 2013, FrPhy, 8, 116
- Howell (2011) Howell, D. A., 2011, Nat. Commun., 2E, 350
- Hurley, Pols & Tout (2000) Hurley, J.R., Pols, O.R., Tout, C.A., 2000, MNRAS, 315, 543
- Hurley, Tout & Pols (2002) Hurley, J.R., Tout, C.A., Pols, O.R., 2002, MNRAS, 329, 897
- Iben & Tutukov (1984) Iben, I., Tutukov, A.V., 1984, ApJS, 54, 335
- Jha et al. (2019) Jha S.W., Maguire K., Sullivan M., 2019, NatAs, 3, 706
- Justham et al. (2009) Justham, S., Wolf, C., Podsiadlowski, P., & Han, Z. 2009, A&A, 493, 1081
- Justham (2011) Justham S., 2011, ApJL, 730, L34
- Justham et al. (2011) Justham, S., Podsiadlowski, Ph., Han, Z., 2011, MNRAS, 410, 984
- Kerzendorf et al. (2018) Kerzendorf, W.E., Strampelli, G., Shen, K. J. et al. 2018, MNRAS, 479, 192
- Kupfer et al. (2019) Kupfer, Th., Bauer, E.B., Burdge, K.B. et al., 2019, ApJ, 878, L35
- Latour et al. (2014) Latour, M., Randall, S. K., Fontaine, G., et al. 2014, ApJ, 795, 106
- Latour et al. (2019) Latour, M., Green, E. M., Fontaine, G.,2019, A&A, 623, L12
- Leibundgut (2000) Leibundgut, B., 2000, A&ARv, 10, 179
- Lei et al. (2019) Lei, Z., Zhao, J., Németh, P., Zhao, G., 2019, ApJ, 881, 135
- Lei et al. (2020) Lei, Z., Zhao, J., Németh, P., Zhao, G., 2020, ApJ, 889, 117
- Li et al. (2017) Li, C., Chu, Y., Gruendl, R. A. et al., 2017, ApJ, 836, 85
- Liu et al. (2015) Liu, Z.W., Stancliffe, R.J., Abate, C., Wang, B., 2015, ApJ, 808, 138
- Luo et al. (2016) Luo, Y., Németh, P., Liu, C., Deng, L., Han, Z., 2016, ApJ, 818, 202
- Luo et al. (2019) Luo, Y., Németh, P., Deng, L., Han, Z., 2019, ApJ, 881, 7
- Luo et al. (2020) Luo, Y., Németh, P., Li, Q., 2020, ApJ, 898, 64
- Marietta et al. (2000) Marietta E., Burrows A., Fryxell B., 2000, ApJS, 128, 615
- Martin et al. (2017) Martin, P., Jeffery, C.S., Naslim, N., & Woolf, V.M., 2017, MNRAS, 467, 68
- Matteucci & Greggio (1986) Matteucci, F., Greggio, L., 1986, A&A, 154, 279
- McCully et al. (2014) McCully, C., Jha, S. W., Foley, R. J. et al., 2014, Nature, 512, 54
- Meng et al. (2007) Meng X., Chen X., Han Z., 2007, PASJ, 59, 835
- Meng et al. (2008) Meng X., Chen X., Han Z., 2008, A&A, 487, 625
- Meng, Chen & Han (2009) Meng, X., Chen, X., Han, Z., 2009, MNRAS, 395, 2103
- Meng & Yang (2010a) Meng, X., Yang, W., 2010a, ApJ, 710, 1310
- Meng & Yang (2010b) Meng, X., Yang, W., 2010b, A&A, 516, A47
- Meng & Podsiadlowski (2013) Meng, X. & Ph. Podsiadlowski, 2013, ApJL, 778, L35
- Meng & Podsiadlowski (2014) Meng, X. & Ph. Podsiadlowski, 2014, ApJL, 789, L45
- Meng & Podsiadlowski (2017) Meng, X. & Podsiadlowski, Ph. 2017, MNRAS, 469, 4763
- Meng & Podsiadlowski (2018) Meng, X. & Podsiadlowski, Ph. 2018, ApJ, 861, 127
- Meng & Han (2018) Meng,X. & Han, Z. 2018, ApJL, 855, L18
- Meng & Li (2019) Meng, X. & Li, J., 2019, MNRAS, 482, 5651
- Meng et al. (2020) Meng, X., Han, Z., Ph. Podsiadlowski, Li, J., 2020, ApJ, 903, 100, arXiv: 2009.11059
- Miller & Scalo (1979) Miller G.E., Scalo J.M., 1979, ApJS, 41, 513
- Miller Bertolami (2008) Miller Bertolami, M.M., Althaus, L.G., Unglaub, K., & Weiss, A. 2008, A&A, 491, 253
- Moehler et al. (2004) Moehler, S., Sweigart, A.V., Landsman, W.B., Hammer, N.J., & Dreizler, S. 2004, A&A, 415, 313
- Naslim et al. (2011) Naslim N., Jeffery, C.S., Behara N.T., Hibbert, A., 2011, MNRAS, 412, 363
- Naslim et al. (2012) Naslim, N., Geier, S., Jeffery, C.S., Behara, N.T., Woolf, V.M., Classen, L., 2012, MNRAS, 423, 3031
- Naslim et al. (2013) Naslim, N., Jeffery, C.S., Hibbert, A., Behara, N.T., 2013, MNRAS, 434, 1920
- Naslim et al. (2020) Naslim, N., Jeffery, C.S., & Woolf, V.M., 2020, MNRAS, 491, 874
- Németh et al. (2012) Németh, P., Kawka, A., Vennes, S. 2012, MNRAS, 427, 2180
- Nomoto, Thielemann & Yokoi (1984) Nomoto, K., Thielemann, F-K., Yokoi, K., 1984, ApJ, 286, 644
- Nugent et al. (2011) Nugent, P. E., Sullivan, M., Cenko, S.B., et al., 2011, Nature, 480, 344
- Perlmutter et al. (1999) Perlmutter, S., Aldering, G., Goldhaber, G., et al. 1999, ApJ, 517, 565
- Pietrukowicz et al. (2017) Pietrukowicz, P., Dziembowski, W. A., Latour, M. et al., NatAs, 2017, 1E, 166
- Randall et al. (2015) Randall, S.K., Bagnulo, S., Ziegerer, E., Geier, S., Fontaine, G., 2015, A&A, 576, A65
- Riess et al. (1998) Riess, A., Filippenko, A. V., Challis, P., et al. 1998, AJ, 116, 1009
- Reimers (1975) Reimers D., 1975, Mem. R. Soc. liège, 6ième Serie, 8, 369
- Ruiz-Lapuente et al. (2004) Ruiz-Lapuente P. et al., 2004, Nature, 431, 1069
- Ruiz-Lapuente et al. (2018) Ruiz-Lapuente P., Damiani, F., Bedin, L., et al. 2018, ApJ, 862, 124
- Ruiz-Lapuente (2019) Ruiz-Lapuente P., 2019, NewAR, 850, 1523
- Sarbadhicary et al. (2017) Sarbadhicary S. K.,Badenes C.,Chomiuk L. et al., 2017, MNRAS, 464, 2326
- Schaefer & Pagnotta (2012) Schaefer, B. E. & Pagnotta, A., 2012, Nature, 481, 164
- Soker (2018) Soker, N., 2018, SCPMA, 61, 49502
- Soker (2019) Soker, N., 2019, MNRAS, 490, 2430
- Sullivan et al. (2011) Sullivan, M., Guy, J., Conley, A., et al., 2011, ApJ, 737, 102
- Tailo et al. (2015) Tailo, M., D’Antona, F., Vesperini, E., et al. 2015, Natur, 523, 318
- Wang & Han (2009) Wang, B., Han, Z., 2009, A&A, 508, L27
- Wang et al. (2014) Wang, B., Meng, X., Liu, D., Liu, Z., Han, Z., 2014, ApJL, 794, L28
- Webbink (1984) Webbink, R.F., 1984, ApJ, 277, 355
- Whelan & Iben (1973) Whelan, J., Iben, I., 1973, ApJ, 186, 1007
- Willems & Kolb (2004) Willems, B., Kolb, U., 2004, A&A, 419, 1057
- Wu & Li (2018) Wu, T., Li, Y., 2018, MNRAS, 478, 3871
- Xiong et al. (2017) Xiong, H., Chen, X., Podsiadlowski, Ph., Li, Y. and Han, Z., 2017, A&A, 599, A54
- Yoon, Langer & Scheithauer (2004) Yoon, S.-C., Langer, N., Scheithauer, S., 2004, A&A, 425, 217
- Yoon & Langer (2005) Yoon, S.-C., Langer N., 2005, A&A, 435, 967
- Zhang & Jeffery (2012) Zhang, X., Jeffery, C. S., 2012, MNRAS, 419, 452
- Zhang et al. (2017) Zhang, X., Hall, P.D., Jeffery, C.S., & Bi, S. 2017, ApJ, 835, 242
- Ziegerer et al. (2017) Ziegerer E., Heber U., Geier S. et al., 2017, A&A, 601, A58