Highly r-process enhanced stars in ultra-faint dwarf galaxies
Abstract
Highly r-process enhanced metal-poor stars (MP r-II, and ) have been observed in ultra-faint dwarf (UFD) galaxy, specifically in Reticulum II (Ret II). The fact that only a few UFDs contain such stars implies that the r-process site may reflect very rare, but individually prolific events, such as neutron star mergers (NSMs). Considering the relatively short star formation history (SFH) of UFDs, it is puzzling how they could experience such a rare phenomenon. In this work, we show the results of cosmological hydrodynamic zoom-in simulations of isolated UFDs ( and at ) to explain the formation of MP r-II stars in UFDs. We employ a simple toy model for NSM events, adopting parameters consistent with observations, such as the NSM rate (1 per ) and europium (Eu) mass (). We identify only one simulated galaxy (, at ) with abundances similar to Ret II in a simulation volume that hosts UFD analogs, indicating that such abundances are possible but rare. By exploring a range of key parameters, we demonstrate that the most important factor in determining the formation of MP r-II stars in UFDs is how quickly subsequent stars can be formed out of r-process enriched gas. We find that it takes between 10 to 100 Myr to form the first and second burst of MP r-II stars. Over this period, Eu-polluted gas maintains the required high abundance ratios of .
keywords:
cosmology: theory – galaxies: formation – galaxies: high-redshift – HII regions – hydrodynamics – intergalactic medium – supernovae: physics.1 Introduction
Studying the formation and evolution of low-mass dwarf galaxies is essential to a comprehensive understanding of galaxy formation in CDM cosmology (Bullock & Boylan-Kolchin, 2017; Strigari, 2018; Bromm & Yoshida, 2011). Over the preceding decade, surveys of ever increasing size have assembled an array of observational constraints to understand such small systems, including the extreme end of the mass spectrum, ultra-faint dwarfs (UFDs), defined as galaxies with absolute magnitudes fainter than ; reviewed in Simon 2019; see also Tolstoy et al., 2009; Willman, 2010; McConnachie, 2012; Frebel & Norris, 2015). Given their faintness, together with the paucity of metals in stellar components, it is inferred that they had experienced a relatively short star formation history (SFH) in the early Universe. Furthermore, it appears that select Milky Way (MW) UFDs had formed more than 70% of stars prior to reionization, and then experienced quenching both by supernovae (SNe) and the global heating during reionization (e.g. Brown et al., 2014; Weisz et al., 2014).
A hint about the short SFHs of the MW UFDs is also imprinted in the abundance patterns of their member stars. For instance, the position of the knee in the - relation indicates how long star formation might last in UFDs, given that the -to-Fe ratio decreases as the amount of iron released over time by Type Ia SNe increases (Tinsley, 1979). For UFDs, the location of the knee where begins to decline tends to be at a lower metallicity, , indicating a shorter SFH (Frebel & Bromm, 2012). Moreover, the unique chemical signature in carbon-enhanced metal poor (CEMP) stars (, ) implies that star formation in UFDs might predominantly take place in the early Universe (see, e.g. Nomoto et al., 2013 for a review; see also Yoon et al., 2019; Jeon et al., 2021). The reason is that one of the promising pathways of producing the CEMP signature is connected to nucleosynthesis in the first generation of so-called Population III (Pop III) stars (e.g. Bromm, 2013; Jeon et al., 2019).
Considering their short SFHs, one of the challenges is to understand how UFDs with (abundant) neutron-capture elements, such as europium (Eu) and barium (Ba), can exist, given the rare occurrence of their production sites. Furthermore, stars with unusually high abundances of elements arising in the rapid neutron capture process ("r-process") are observed in select UFDs, specifically the Reticulum II (Ret II) galaxy (Ji et al., 2016a, b; Roederer et al., 2016) with MP r-II stars (), and the Tucana III (Tuc III) system (Hansen et al., 2017; Marshall et al., 2019), which contains stars with a lower level of r-process enhancement (r-I, ) (Beers & Christlieb, 2005).
The origin of r-process elements in UFDs is still uncertain (e.g. Argast et al., 2004; Beniamini et al., 2018). A plausible pathway of producing r-process elements is via nucleosynthesis in neutrino-driven winds from core-collapse SN (CCSN) explosions (e.g. Takahashi et al., 1994; Woosley et al., 1994; Arcones & Thielemann, 2013 for a review), a magneto-rotationally driven SN (e.g. Nishimura et al., 2015), or neutron star merger (NSM) events (e.g. Freiburghaus et al., 1999; Wanajo et al., 2014). Among them, the NSM site is the only one that is empirically confirmed, based on the recent multi-messenger observations of the GW170817 gravitational wave event (e.g. Abbott et al., 2017; Chornock et al., 2017; Pian et al., 2017), including the detection of a short-duration -ray burst (SGRB) electromagnetic counterpart (e.g. Goldstein et al., 2017; Savchenko et al., 2017). Also, it is suggested that all r-process nuclides can be synthesized during NSM events (e.g. Wanajo et al., 2014; Tsujimoto & Shigeyama, 2014; Wu et al., 2016), making them the most favored site of producing r-process elements.
Provided that only about 10% of the observed UFDs appear to contain highly r-process enhanced stars (e.g. Ji et al., 2016a), it seems evident that the responsible event is rare but individually prolific, such as NSMs. Thus assuming that such a merger is the most promising site for their r-process elements, the question arises whether it is possible for UFDs to have experienced such rare events within their short SFHs (1 Gyr). It is still unclear how often NSM events take place. Applying a maximum likelihood analysis to the observed dwarf spheroidal galaxies (dSphs) and UFDs, Beniamini et al. (2016a) have suggested that the expected NSM rate is per CCSN, which corresponds to a single NSM event per CCSNe. Adopting a typical stellar initial mass function (IMF), about CCSNe can be hosted in a galaxy with a stellar mass of (Tsujimoto et al., 2015). Given that the stellar masses of Ret II and Tuc III are (Bechtol et al., 2015) and (Drlica-Wagner et al., 2015), respectively, such UFDs are less likely to host even a single NSM event during their SFHs.
Another challenge is that some stars in select UFDs show significantly high r-process element ratios (). In general, depending on the ratio, r-process enhanced metal-poor (MP) stars are conventionally divided into two subclasses, MP r-I () and MP r-II () (Beers & Christlieb, 2005). In particular, in Ret II, seven out of nine stars show extremely high levels of r-process element ratios, (e.g. Ji et al., 2016b). This implies that once r-process elements are released, subsequent star formation should occur promptly out of the r-process enriched gas clouds. Otherwise, the ejected r-process elements might be diluted as they mix with the surrounding medium, giving rise to a low ratio. By understanding how such high [Eu/Fe] ratios can be achieved, one can infer the physical mechanisms of the r-process. For instance, assuming that the NSM pathway is the most compelling site for synthesizing the observed r-process elements, we can infer how frequently such mergers might occur or how efficiently the r-process elements can mix into the interstellar medium (ISM). In this work, we specifically consider the r-process from NSM events to explain the observed r-process elements in select UFDs.
Here we present a new suite of hydrodynamic zoom-in simulations, where a few tens of UFD analogs with (at ) form. We will investigate whether the simulations can reproduce the significant Eu enhancement found in the MP r-II stars in Ret II. To do so, we employ two approaches. First, we study if r-process enhanced stars can self-consistently be formed, when using the NSM rate and metal yields constrained by observations. Secondly, we explore the conditions under which MP r-II stars can be created by changing the relevant parameters in an idealized setting. Note that, in this work, we consider only europium, treating it as a representative r-process element. This paper is organized as follows. In Section 2, we explain the numerical methodology, followed by a presentation of the detailed simulation results in Section 3, with a focus on the formation of r-II stars in the context of galaxy assembly. We conclude in Section 4 with a summary. For consistency, all distances are given in physical (proper) units unless noted otherwise.
| Name | Number of UFDs | Run name | NSM rate | Eu yield [ | r II stars |
| LV1 | 8 | - | 1 per | No | |
| LV2 | 32 | - | 1 per | Yes | |
| Single galaxy | 1 | fiducial | 1 per | No | |
| 1 | fiducial-2x | 1 per | Yes | ||
| 1 | fiducial-2x-half | 1 per | Yes | ||
| 1 | fiducial-3x | 1 per | No |
2 Numerical methodology
2.1 Simulation Setup
The simulations have been carried out using a modified version of the N-body Smoothed Particle Hydrodynamics (SPH) code GADGET (Springel et al., 2001; Springel, 2005) implemented with well-tested modules for baryon physics, mainly taken and modified from the OWLS simulations (Schaye
et al., 2010). We generate cosmological initial conditions using MUSIC (Hahn &
Abel, 2011). As mentioned above, we have performed a suite of simulations in two settings.
-
•
LV1, LV2: we employ a simulation set-up such that a single NSM event might occur per a few tens of UFDs, as inferred from observations (Ji et al., 2016a). We have chosen two relatively large volumes with a box size of (LV1) and (LV2), respectively, to contain multiple UFD analogs with haloes in the mass range of at . The goal of the setting is to see whether MP r II stars can self-consistently be formed under conditions similar to observations.
-
•
Single galaxy: we focus on a single fiducial galaxy ( at ) to explore parameters associated with the NSM model, such as the merger rate and europium yield. Here, we aim to study the necessary conditions for the formation of MP r II stars by changing the involved parameters in an idealized setting.
Four consecutive refinements are conducted in all volumes, resulting in an effective resolution of , giving rise to mass resolutions of and , respectively, for dark matter and gas in the most refined region. The basic physics in these simulations is described in Jeon et al. (2021), and thus we refer the reader to this paper for details, but briefly summarize key aspects here.
2.2 Baryon physics
We include all relevant primordial cooling processes and metal cooling to trace the evolution of atomic and molecular species (, and HD) by solving the coupled, non-equilibrium rate equations. Once the gas density exceeds a density threshold of , a gas particle is converted into a collisionless star particle. Stars arise from gas clouds according to Schmidt’s Law (Schmidt, 1959), with a star formation efficiency per free fall time for both Pop III and Pop II stars of . We implement the two stellar populations differently. Since first generation stars are likely to be massive and thus can be resolved in this work, they are randomly sampled as individual star from an assumed top-heavy IMF (Chabrier, 2003; Wise et al., 2012). Meanwhile, owing to their small masses, Pop II stars are described as a stellar cluster, composed of a single stellar population, with a mass of , following a Salpeter IMF. The transition from Pop III to Pop II star formation mode is achieved when the gas metallicity is larger than the critical metallicity of (e.g. Omukai, 2000; Bromm et al., 2001).
When a star dies, it undergoes a SN explosion with properties that depend on the mass of the star. For Pop III stars, we consider conventional CCSNe and powerful pair-instability SNe (PISNe), and Type II and Type Ia SNe for Pop II stars. The resulting SN energy is released as thermal energy into the surrounding medium. Metal yields and total ejected masses for Pop III stars are drawn from Heger & Woosley (2010) for CCSNe, arising from Pop III progenitors in the mass range of , and from Heger & Woosley (2002) for PISNe, which are expected for massive stars of . For Pop II stars, metals from asymptotic giant branch (AGB) enrichment (Marigo, 2001), Type II (Portinari et al., 1998, and Type Ia SNe (Thielemann et al., 2003) are included.
Initially, the metals are released onto the neighboring gas particles, , and then they mix with the surrounding ISM via a diffusion process (Greif et al., 2009). Details can be found in Jeon et al. (2017), but for the convenience of the reader, we here summarize the key elements of our numerical approach to treat the transport of metals. Specifically, the transport process is modelled by solving the diffusion equation
| (1) |
where is the concentration of a quantity of interest. In this work, it corresponds to the total gas metallicity or an individual metal species. How efficiently metals can be diluted is determined by the diffusion coefficient (Klessen & Lin, 2003), defined as , where is the characteristic scale for turbulent driving, the gas density, and the velocity dispersion in the surrounding medium.
In addition to SN feedback, we impose heating from a global UV background (UVB) (Haardt & Madau, 2011), starting at and gradually increasing to the maximum strength at , corresponding to the era where reionization is complete (e.g. Gunn & Peterson, 1965; Fan et al., 2006). Also, we account for the photodissociation of molecular hydrogen, , by soft UV radiation in the Lyman-Werner (LW) band (11.2 eV13.6 eV) (e.g. Abel et al., 1997). We, however, should note that the photoionization heating from individual Pop III stars or Pop II clusters is not considered, which could suppress star formation in the simulated galaxies. We will discuss the impact of the photoionization heating on the SFHs of UFD analogs in an upcoming paper.

2.3 Neutron-star mergers
2.3.1 Merger rate
In the runs LV1 and LV2, we model NSM events with a fiducial rate of one merger per in stars, consistent with the average expected rate for such mergers (e.g. Tsujimoto et al., 2015). Assuming an empirical stellar IMF, one NSM is expected per 1000-2000 CCSNe, corresponding to a stellar mass of . This estimate is consistent with the rate inferred from the observed UFDs (Ji et al., 2016a), where it is suggested that a single NSM event might occur in the sample of ten UFDs. Such tens of UFDs would host 2000 SNe in total. We note, however, that the canonical NSM rate can be boosted by up to a factor of 10, due to uncertainties in the underlying population synthesis modeling (Dominik et al., 2012).
For the fiducial single galaxy run (fiducial), we adopt a rate of one NSM per , an order of magnitude larger than the canonical value, to ensure that at least one NSM event happens in the SFH of our simulated galaxies, in line with the stellar mass of Ret II of only . To assess the impact of model uncertainty, we carry out comparison simulations:
-
•
fiducial: we adopt a rate of one NSM per and the europium yield of .
-
•
fiducial-2x: we decrease the NSM rate by a factor of 2, such that one NSM event takes place per .
-
•
fiducial-3x: we decrease the NSM rate by a factor of 3, such that one NSM event takes place per .
-
•
fiducial-2x-half: we decrease the NSM rate by a factor of 2 and reduce the Eu yield by half, .
The parameter ranges for those simulations are summarized in Table 1. We assume that the final merger occurs about 5 Myr after the binary neutron star system forms. Such delay time of Myr adopted here corresponds to a fast-merging channel (e.g. Belczyński & Kalogera, 2001; De Donder & Vanbeveren, 2004; Dominik et al., 2012). In addition, we ignore natal kicks and the explosion energy of the NSM event, which means that the estimated r-process element abundances in this work should be considered as upper limits.
2.3.2 Nucleosynthetic yield
We choose a fiducial value for the europium yield of for each NS merger event, adopted by Naiman et al. (2018), as inferred by the chemical evolution of europium in MW-sized galaxies in the IllustrisTNG simulation. This value, however, is three times higher than the upper limit based on the NS-NS merger detected by LIGO/Virgo for the GW170817 event (Cowperthwaite et al., 2017; Côté et al., 2018). We use this high europium yield from Naiman et al. (2018) in order to assess whether the high europium abundance observed in Ret II can be reproduced through simulations. In addition, we have conducted another simulation (Fiducial-2x-half), where the Eu yield is reduced by half, more consistent with the value inferred from GW170817. We treat the ejection and transport of europium in the same way as other metal species from SN explosions. Once europium nuclei are ejected, they are initially distributed among the neighboring gas particles, followed by the subsequent diffusive transport according to our numerical scheme (see above for details).
3 Simulation results
In this section, we present the results for the simulated galaxies. First, we show the global properties to see if the simulated UFD analogs are in reasonable agreement with observational data. Second, we discuss the probability of forming a Ret II-like system within the LV1 and LV2 runs. We then assess under which conditions extremely r-process enhanced stars can be formed using the "Single Galaxy" simulation suite and the variations in NSM rate and Eu yield described in section 2.3. Finally, we compare our results with other theoretical work regarding r-process elements in UFDs.


3.1 Global properties
In Figure 1, we show the physical properties of the simulated galaxies at in LV2. The panels (clockwise from upper left) present the half-stellar mass radius (), average line of sight velocity dispersion (), and average stellar metallicity (<[Fe/H]>) as a function of stellar mass (), as well as the stellar-halo mass relation. To compare the resulting quantities with observations, we display measurements for the MW UFDs (blue triangles) and dSphs (black triangles) (e.g. McConnachie, 2012; Kirby et al., 2013; Simon, 2019). Also, we include results of simulated galaxies (denoted as pink squares) from Jeon et al. (2017), exploring systems an order of magnitude more massive than the UFD analogs in this work. We point out that the size () and the average metallicity (<[Fe/H>) of the simulated galaxies in the present work (red circles) agree well with those of the observed MW UFDs (e.g. McConnachie, 2012).
We compute the stellar velocity dispersion of the simulated galaxies, , by averaging over the values along the 1000 random lines of sight. Note that we only consider the stars within the half-stellar mass radius to derive . The error bars arise from the variation of the velocity dispersion of 1000 random lines of sight. We find that most of the simulated galaxies below tend to exhibit velocity dispersions of less than 4 km , while the inferred values from observations range from 4 km to 8 km for the MW UFDs. Although the error bars encompass the observational data, we plan to conduct a follow-up study to understand such systematic discrepancy in future studies.
The halo-stellar mass relation is shown in comparison with other theoretical results, derived from high resolution zoom-in hydrodynamic simulations (Munshi et al., 2013; Simpson et al., 2013; Shen et al., 2014; Oñorbe et al., 2015; Wheeler et al., 2015; Jeon et al., 2017; Wheeler et al., 2019), and large-box simulations in which best-fits are provided (Brook et al., 2014 (solid line), Garrison-Kimmel et al., 2016 (dotted line)). Our - relation, in particular, appears to be in line with the fit suggested by Behroozi et al. (2013) (dashed line), whose result is based on the abundance matching approach. We should, however, caution that the effect of photoionization heating from local sources such as individual Pop III stars and Pop II clusters is not considered in this work. The impact of radiative feedback by local sources is still under debate. A recent study by Hopkins et al. (2020) has shown that the stellar mass of small galaxies () is predominantly determined by the external UVB, but that the effect of local sources is insignificant. Agertz et al. (2020), on the other hand, have demonstrated that the photoionization heating by stars could lower the stellar mass by a factor of for dwarf galaxies with a mass of . This discrepancy is likely due to the difference in the detailed prescription for sub-grid models and resolution.


As shown in the bottom right panel of Figure 1, the resulting average metallicities (<[Fe/H]>) of the simulated galaxies tend to show a good agreement with those observed in UFDs, except one outlier having metallicity as high as . We attribute such high metallicity system to Pop III PISNe, which typically eject significantly more metals than CCSNe (e.g. Karlsson et al., 2013; Heger & Woosley, 2010). We find that the high metallicity stars are formed at , and about 80-90% of their metals come from Pop III stars. The metals, in particular, originate from a Pop III PISN that explodes at within the progenitor halo.
3.2 UFD analogs: r-process enhanced stars
3.2.1 Large volume runs: LV1 and LV2
As a first step, we consider whether any of the simulated UFDs in LV1, in which 8 UFD analogs () emerge, could host MP r-II stars by adopting the empirical NSM rate (Ji et al., 2016a), where one NSM event is expected per . We further use the fiducial value for the europium yield, . However, none of the simulated galaxies has stars with and , despite the occurrence of the NSM event in LV1. We find that the simulated galaxies in LV1 continue to form stars after the NSM event, but the NSM ejecta is too diluted due to the long time delay between the NSM event and the subsequent star formation, resulting in the lack of MP r-II stars.
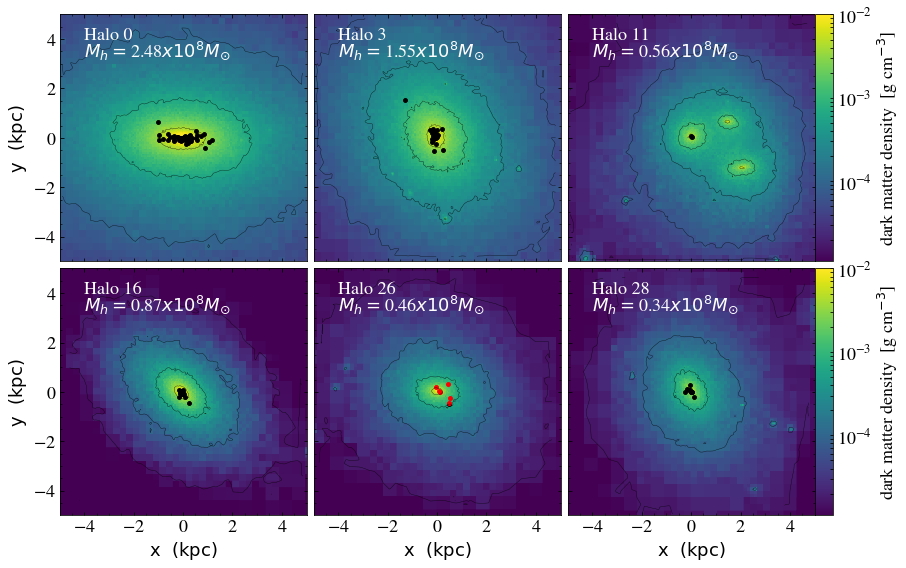
Using the same empirical parameters used in LV1, on the other hand, out of a total of 32 UFD analogs in LV2, we identify a single galaxy (Halo 26), containing MP r-II stars. The corresponding halo has virial and stellar masses of and , respectively, at . For illustrative purposes, in Figure 2, we show the projected dark matter profile of the representative UFD analogs at in LV2. Pop II stellar components are denoted as filled circles, with color indicating the ratio such that MP r-II stars are shown in red. For further analysis, we only focus on Halo 26, displayed in the bottom-middle panel of Figure 2, as it is the only simulated galaxy with abundances similar to Ret II.
In Figure 3, we present stellar abundances (C, Si, Mg, and Eu), calculated from stars hosted in Halo 26, by comparing with the observed values111The original references for the abundance ratios of the observed UFDs are as follows: Norris et al., 2010; Lai et al., 2011 (Bootes I); Ji et al., 2016b; Roederer et al., 2016 (Reticulum II); Norris et al., 2010; Frebel et al., 2014 (Segue I); Ji et al., 2016c; Chiti et al., 2018b; Chiti et al., 2018a (Tucana II); Frebel et al., 2010 (Ursa Minor II); Simon et al., 2010 (Leo IV); Frebel et al., 2010 (Coma Berenices). The first point to note here is that there are no CEMP stars (, ) in this galaxy. We compute the ratio based on the metals separately released by Pop III (pink circles in the top left panel of Fig. 3) and Pop II (blue color), respectively (e.g. Jeon et al., 2021). There are three CEMP stars in Ret II (Ji et al., 2016b), accounting for 40% of stars at . In general, Pop III SNe are one of the favoured pathways of forming CEMPs (e.g. Iwamoto et al., 2005; Heger & Woosley, 2010; Ishigaki et al., 2014). Although we include Pop III stars, giving rise to a number of CEMP stars in the overall sample of UFD analogs in LV2, no CEMP stars are found in Halo 26. This deficiency can simply be understood as a stochastic effect (e.g. Jeon et al., 2021). Meanwhile, as shown in the upper-right panel of Figure 3, -element abundances of stars in Halo 26 are in good agreement with those of Ret II.
The estimated europium abundances, and , of the Pop II clusters are presented in the bottom panels of Figure 3. Out of 7 Pop II clusters, 6 (red inverse triangles) show extremely high europium abundances (), comparable to MP r-II stars in Ret II. Despite the same assumptions for the NSM model in both LV1 and LV2, Ret II-like systems are produced only in LV2. To better understand the formation of MP r-II stars in the context of overall galaxy assembly, in Figure 4, we illustrate star formation rates (top panel) and cumulative SFH (bottom panel) for Pop III (black solid lines) and Pop II (red solid lines) stars in Halo26, as a function of cosmic time. We find that in Halo26 Pop III star formation begins at , and the transition from Pop III to Pop II star formation mode occurs after 30 Myr. The heavier the halo, the earlier the star formation occurs, and the onset of star formation in the all simulated galaxies ranges from to . Halo26 experiences self-quenching even before reionization, implying that the gas evaporated by SN feedback could not recollapse onto the halo prior to reionization (Jeon et al., 2014). Note that the SFH of Halo 26 is not unusual, as about of the simulated galaxies tend to exhibit the self-quenching feature.
At , a binary neutron star system forms, and after a time delay of 5 Myr we assume that the final merger takes place, ejecting r-process elements into the surrounding medium, out of which r-process enhanced Pop II stars are formed. We will further discuss such a fast-merging channel below (see Section 3.3). It takes Myr to form MP r-II stars with () since the release of r-process elements. Subsequently, a second burst of star formation occurs at Myr, creating MP r-II stars with (). To examine the gas conditions, when the MP r-II stars are formed, we show the hydrogen number density (top) and europium abundance (bottom) in Figure 5, as a function of distance from the NSM site at Myr (left) and Myr (right), corresponding to the first and second burst of star formation.

The NSM occurs at towards the center of Halo26, when the virial mass and radius of the progenitor are and pc, respectively. During the first period of suppressing star formation, lasting Myr, a gas mass of within the halo is polluted by europium up to . Out of the Eu-enriched density peak, located at pc from the NSM site, as illustrated in the left-top panel of Figure 5, MP r-II stars are formed. The gas density inside the halo decreases mainly due to SN feedback, and the europium is diluted beyond the virial radius. However, we find that the density peak at 550 pc still maintains a high europium abundances of , resulting in the formation of another MP r-II stars at Myr.
To assess how quickly the r-process elements are diluted, we calculate the diffusion coefficient, , assuming a Gaussian distribution function for the transport of metals, with a standard deviation of (e.g. Tarumi et al., 2020). By fitting the relation, , the derived diffusion coefficient within Halo 26 is at Myr. This value agrees within a factor of with the estimates in Tarumi et al. (2020), where is suggested inside a halo at . The impact of turbulent mixing on the r-process elements is also stressed in the work by Dvorkin et al. (2020), where they reveal that metal mixing is essential to account for the large scatter in the [Eu/Fe] ratio, especially for low , observed in the MW stars. Recently, Beniamini & Hotokezaka (2020) propose a new constraint on the diffusion coefficient, , assuming an r-process rate of , based on MW stars using a Monte Carlo simulation and analytic approach.


3.2.2 Single galaxy comparison runs
As a second approach, we perform several comparison simulations of a single UFD, varying key NSM model parameters. To increase the frequency of NSMs, we allow one NSM event to take place per . Although this frequency is higher than the empirical estimate by an order of magnitude, it assures the simulated UFD to experience at least one NSM event during its SFH. We carry out additional simulations by extending the period (or decreasing the frequency) of NSM events by a factor of 2 and 3, compared to the fiducial value, such that a single NSM occurs per or in stars, respectively. We also study the effect of reducing the europium yield by half, , to achieve a value similar to the one inferred from GW170817.
We note that, for the purpose of the r-process study, in "Single galaxy" runs we terminate the simulations immediately after reionization due to computational cost. Any derived r-process abundances presented here may thus not reflect the final sample for a given UFD analog at . In Figure 6, we compare the resulting europium abundances for the simulated UFDs with the values observed in Ret II. Although we set up the four simulations so that all should experience a NSM event, only two runs (fiducial-2x and fiducial-2x-half) contain stars with highly enhanced europium abundances. In the runs where we double the NSM period, or additionally reduce the Eu yield by half, the resulting [Eu/H] and [Eu/Fe] values at [Fe/H] are lower than what is observed for the stars in Ret II. The high values in fiducal-2x-half for [Eu/Fe] at [Fe/H], where no counterparts are observed, are mainly due to the small amount of Fe, resulting in high [Eu/Fe].
To investigate how far the r-process elements, ejected from the NSM, could reach and pollute the surrounding gas, we display in Figure 7 the europium abundances (encoded in color) of the simulated stars as a function of the time elapsed after the NSM event (for the same runs as in Fig. 6). We distinguish these histories for different distances between the NSM site and the location of the newly formed stars. The open circles indicate the stars showing a lack of europium abundance because they are far away from the NSM site. It is evident that stars with relatively high europium values, [Eu/H] or [Eu/Fe], formed close to the NSM site, within 300 pc. Both panels demonstrate that the Eu abundances decrease with increasing distance from the NSM site. However, the gas close to the NSM site can maintain such high europium values for a long period of time, Myr, giving rise to r-process enhanced stars. Considering that the Eu-enhanced stars still emerge in the run with the yield reduced by half (right panels), it appears that the most important determining factor in forming such highly Eu-enhanced stars is how quickly new stars can form around the merger site, rather than the Eu yield. Put differently, the key here is how quickly the gas, altered by stellar feedback, could recombine and recollapse, reaching the high density required to form subsequent stars.
To further study this, in Figure 8 we show the hydrogen number density (top panels) and europium abundance (bottom panels) of the gas as a function of distance from the NSM site about 10 (left), 50 (middle), and 100 (right) Myr after the NSM event for the fiducial-2x-half run (same as the right panels of Fig. 6). As can be seen, about 10 Myr after the NSM (left panels), the surrounding gas begins to be contaminated by the ejected europium. Even though the gas density in the inner region, 50 pc, is lowered by stellar feedback, the density peaks at 300 pc are high enough to form stars with [Eu/H]. Until 100 Myr after the onset of the NSM event, the evacuated gas continues to fall back to the central region, so that next generation stars can form out of this highly enriched dense gas cloud. The [Eu/H] ratios of those high density peaks decline from [Eu/H] at Myr to [Eu/H] (10 pc) and [Eu/H] ( 40 pc) at Myr. As illustrated in Figure 8, multiple gas density peaks could exist in close proximity to the NSM site, such that a number of r-process enhanced stars could form within those high-density clouds.
One of the main obstacles for producing r-process enhanced stars in the UFD analogs is the short duration of their star formation histories. We find that all the simulated UFDs stop forming stars at the epoch of reionization. Consequently, if a NSM takes place just before the onset of reionization, with insufficient time for the enriched gas to reach high density, no r-process enhanced stars will form. When we double the interval between NSM events, such that one NSM event occurs per , stars with high europium abundance can still form. However, in the run with three times longer intervals (fiducial-3x), no high europium stars are found, because the NSM happens right before reionization. As explained previously, the amount of europium produced does not seem to be the main factor, because Eu-enhanced stars can still form, even if the europium yield decreases by a half. Therefore, the decisive factor in forming r-process enhanced stars is whether or not the stars can form in the close spatial and temporal vicinity of the NSM event.


3.3 Comparison with other work
Numerous theoretical arguments have been made to account for the observed r-process enhanced stars within the assembly process of the MW halo (e.g. van de Voort et al., 2015; Shen et al., 2015; Naiman et al., 2018; Safarzadeh et al., 2019; van de Voort et al., 2020; Dvorkin et al., 2020; Tarumi et al., 2021), dSphs (e.g. Hirai et al., 2015), or UFD galaxies (e.g. Safarzadeh & Scannapieco, 2017; Beniamini et al., 2016b; Beniamini et al., 2018; Brauer et al., 2019; Tarumi et al., 2020), thus constraining the r-process site. Note that in the case of the MW halo, the main focus of including r-process sites is to explain the global features, i.e. the relation of , observed in the disk stars, rather than examining the existence of highly r-process enhanced stars.
Regarding r-enhanced stars in UFDs, Safarzadeh & Scannapieco (2017) have reached similar conclusions to our work, in that the emergence of the highly r-enhanced stars in Ret II is strongly subject to galactic environment, i.e. where the NSM event happens: if the event occurs in the center of a UFD-like galaxy, as opposed to off-center, Ret II-like stars can be produced, as r-process ejecta are less dispersed. The importance of the local environment of the NSM site, combined with a prolonged SFH over a few 100 Myr, is also emphasized in the recent work by Tarumi et al. (2020), suggesting that the r-process abundance patterns in Ret II and Tuc III could be reproduced by a NSM emerging inside or around the virial radius of a UFD progenitor.
The off-center NSMs, in particular, are realized by natal kicks to neutron stars due to the explosion of their progenitor stars (e.g. Tauris et al., 2017), which might place a NSM event at the outskirt of a galaxy, thus lowering the possibility of forming highly Eu-enhanced stars. We note that our derived stellar [Eu/H] values should be considered as upper limits, given that we did not consider natal NSM kicks. A weak natal kick might be a prerequisite for neutron stars to be bound in UFDs, and especially to explain Ret II-like systems. Beniamini et al. (2016b) have demonstrated that a significant population of neutron stars with weak natal kicks (Beniamini & Piran, 2016) could have a center of mass velocity less than 15 , comparable to the escape velocity of small galaxies such as UFDs.
One of the difficulties in creating r-process enhanced stars in UFDs is that the delay time between the formation of neutron stars and their final merger needs to be shorter than the duration of star formation activity in UFDs. However, for UFDs, their star formation activity lasts of order a few hundred million years, being ultimately truncated by reionization and stellar feedback (e.g. Jeon et al., 2017). Note that the duration of star formation of the simulated galaxies in this work is also a few 100 Myr. A precise delay time can be calculated from population synthesis models for binary systems, resulting in a delay time distribution (DTD), with a typical form of (e.g. Dominik et al., 2012; Mennekens & Vanbeveren, 2016), ranging from a minimum, , to a maximum time scale, . Our adopted delay time of Myr in this work corresponds to a fast merging channel (e.g. Belczyński & Kalogera, 2001; De Donder & Vanbeveren, 2004; Dominik et al., 2012). Such rapid merging might correspond to the extreme end of the DTD, given that the delay time, inferred from GW170817, exceeds 3-4 Gyr (e.g. Pan et al., 2017; Skúladóttir & Salvadori, 2020). Other theoretical studies seem to support rapid merging to reproduce Ret II-like systems. For instance, using the fiducial power-law DTD (), Safarzadeh et al. (2019) have shown that even for a minimum merging time of Myr, corresponding to a median timescale of a few 10 Myr, the resulting r-process abundances turn out to be an order of magnitude lower than what is observed both in the MW halo and Ret II.
Although a NSM event is a compelling r-process site for UFDs, given that r-process enhanced stars in UFDs might originate from a very rare and prolific event, rare SNe could be an alternative r-process site. Especially when considering r-process enhanced stars in the MW, there is an ongoing debate on their origin (e.g. van de Voort et al., 2020; Banerjee et al., 2020; Dvorkin et al., 2020). For example, Côté et al. (2019) have shown that NSMs alone may be insufficient to match observed Eu-abundances, in particular, the decreasing trend of at in MW disk stars, suggesting a rare class of SNe as the origin of r-process elements.
Lastly, it is worth discussing the relationship between reionization and the possibility of forming Ret II-like systems. The onset of reionization is an important factor in determining how long star formation can be sustained in dwarf galaxies (e.g. Simpson et al., 2013; Jeon et al., 2017). Although in this work the onset of reionization is designed to occur at the same time in all the simulated UFDs, in reality, satellite galaxies undergo different reionization processes depending on their distance from a host galaxy.
It has been suggested that Ret II could be a satellite of the Large Magellanic Cloud (LMC), in which case Ret II might have existed in a more isolated environment at the time of reionization (e.g. Sales et al., 2017; Kallivayalil et al., 2018; Garavito-Camargo et al., 2020; Patel et al., 2020). Particularly, Patel et al. (2020) reinforced the possibility of Ret II being a satellite of the LMC based on the derived orbital history using the recently measured proper motion data from the Gaia DR2 (e.g. Gaia Collaboration et al., 2018). If Ret II existed in an isolated environment, reionization might have been delayed, making the progenitor of Ret II sustain star formation longer and thus increasing the possibility of forming MP r-II stars.
Not only when reionization started, but also when it ended is important. Recent observations propose that reionization might last up to (e.g. Becker et al., 2015; Choudhury et al., 2015; McGreer et al., 2015; Puchwein et al., 2019). Such a late reionization scenario could increase the possibility of NSM events occurring in the progenitors of UFD systems, and thus the possibility of the Eu-polluted star formation as the quenching of stars could also be delayed.
4 Summary and Conclusions
We have investigated the conditions under which extremely r-process enhanced metal poor stars, the so-called MP r-II () stars, as observed in Ret II, can arise in UFDs. To do this, we have performed cosmological hydrodynamic zoom-in simulations of low-mass halos ( at ), which can be considered as direct analogs of UFDs in the local Universe. Given that most of the stars in observed UFDs are composed of ancient populations, it is expected that star formation is likely to be quenched in the early Universe, both by reionization and SN feedback (e.g. Brown et al., 2014; Weisz et al., 2014; Jeon et al., 2017), resulting in relatively short SFHs, a few hundred Myr.
In this regard, the existence of MP r-II stars in the MW UFDs, such as Ret II, has been puzzling because the NSM event, one of the most promising pathways of producing r-process elements, is necessarily rare in systems with such short SFHs. In this work, we scrutinize whether MP r-II stars can be self-consistently produced in cosmological zoom-in simulations that employ a simple toy model for NSM events. This model is described by two parameters: the NSM event rate and europium yield. First, we have conducted relatively large volume zoom-in simulations, LV1 and LV2, in which multiple UFDs emerge, to ascertain if any Ret II-like system could arise, when adopting parameters consistent with observations. We then have focused on a single galaxy to explore the environmental conditions for the generation of MP r-II stars, by changing the NSM parameters. The main findings from this study are as follows.
-
•
We confirm that the global properties of the simulated UFD analogs, such as half-stellar mass radius, average stellar metallicity, and stellar mass, show good agreement with observational data.
-
•
Large volume runs: LV1 and LV2
-
–
Adopting a simple toy model for NSMs, whose parameters are in line with those inferred from observations such as the NSM rate of a single NSM per and the europium yield of , we identify only one Ret II-like system (, at ) out of UFD analogs in LV2. Meanwhile, no Ret II-like system is found in LV1, where UFD analogs emerge. This frequency is largely consistent with the observation that only 1 in 10 UFDs (Ret II) contains highly r-process enhanced stars (e.g. Ji et al., 2016a).
-
–
The derived europium abundances of MP r-II stars in the simulated Ret II-like galaxy are and at , similar to the abundances observed in Ret II.
-
–
Unlike Ret II, in which three MP r-II stars are CEMP stars, no CEMP stars are found in the simulated Ret II-like system despite the inclusion of Pop III stars. Considering the occurrence of CEMP stars at the average rate of in the other 31 haloes in LV2, the lack of CEMP stars in the Ret-II like halo is simply due to a stochastic effect. The -element abundances, on the other hand, are consistent with what is observed in Ret II.
-
–
-
•
Single galaxy comparison runs
-
–
Building upon a fiducial single galaxy run, which adopts a rate of one NSM per and the europium yield of , we have conducted an additional 3 simulations to explore whether MP r II stars can be reproduced by decreasing the NSM rate by a factor of 2 and 3, and additionally reducing the Eu yield by half. We discover MP r II stars (, ) in the two runs, the case where the NSM rate is increased by a factor of 2 (Fiducial-2x) and where the Eu yield is reduced by half (Fiducial-2x-half).
-
–
We suggest that the most important factor in determining whether such highly r-enhanced stars can form is how quickly subsequent star formation can resume in gas clouds that experienced such NSM events. Although r-process elements are diluted with increasing distance from a NSM site, we find that the gas near the merger site can maintain europium values high enough to produce MP r-II stars for a prolonged period of 80-100 Myr.
-
–
We find that NSM events must occur long before (a few 10-100 Myr) the onset of reionization to create MP r-II stars in UFDs. Otherwise, the gas evacuated out of the host halo by stellar feedback might not have enough time to be replenished, to trigger subsequent star formation.
-
–
As discussed in the previous section, our NSM toy model is highly idealized, assuming fast merging and not taking into account natal kicks. Nevertheless, given the short SFH of low-mass UFDs (1 Gyr), it is evident that the time interval between the NSM event and subsequent star formation ought to be shorter than the SFH timescale of UFDs. This constraint, however, could be alleviated if relatively massive dwarf galaxies, experiencing NSM events during their long SFHs, subsequently lose mass as they undergo tidal stripping. Such scenario (e.g. Peñarrubia et al., 2008; Hansen et al., 2017) is one of the most promising pathways to account for the MP r-I stars in Tuc III, which seems to have lost most of its stellar mass, resulting in the extremely low (e.g. Drlica-Wagner et al., 2015).
Understanding the formation of r-process enhanced stars in the most ancient and least massive galaxies in the Universe addresses not only the NSM event itself, but also the complex interplay between early stellar populations, galaxy assembly, metal mixing, and nuclear physics. Additional discoveries in UFDs, exploring r-process elements, will be necessary to better understand the physics of the r-process sites. Future observations with greatly improved spectroscopic sensitivity, such as provided by the Giant Magellan Telescope (GMT), will elucidate the detailed chemical abundance patterns left behind by the r-process site, thus helping to distinguish between different r-process models (e.g. Ji & Frebel, 2018). Similar to the CEMP signature, the early Universe may provide an ideal laboratory to probe the elusive r-process as well.
acknowledgements
We are grateful to Volker Springel, Joop Schaye, and Claudio Dalla Vecchia for permission to use their versions of gadget. We thank the anonymous referee for the constructive comments which helped to improve the manuscript. G. B. acknowledges support from HST Grant 15030. The simulations were performed using the Nurion Super computer at the KISTI National Supercomputing Center through Grant No. KSC-2020-CRE-0175. We utilized yt for data visualization and analysis tools. M. J. is supported by a grant from Kyung Hee University in 2020 (KHU-20201115).
DATA AVAILABILITY
The simulation data and results of this paper may be available upon request.
References
- Abbott et al. (2017) Abbott B. P., LIGO Scientific Collaboration Virgo Collaboration 2017, Phys. Rev. Lett., 119, 161101
- Abel et al. (1997) Abel T., Anninos P., Zhang Y., Norman M. L., 1997, New Astron., 2, 181
- Agertz et al. (2020) Agertz O., et al., 2020, MNRAS, 491, 1656
- Arcones & Thielemann (2013) Arcones A., Thielemann F. K., 2013, Journal of Physics G Nuclear Physics, 40, 013201
- Argast et al. (2004) Argast D., Samland M., Thielemann F. K., Qian Y. Z., 2004, A&A, 416, 997
- Banerjee et al. (2020) Banerjee P., Wu M.-R., Yuan Z., 2020, ApJL, 902, L34
- Bechtol et al. (2015) Bechtol K., et al., 2015, ApJ, 807, 50
- Becker et al. (2015) Becker G. D., Bolton J. S., Madau P., Pettini M., Ryan-Weber E. V., Venemans B. P., 2015, MNRAS, 447, 3402
- Beers & Christlieb (2005) Beers T. C., Christlieb N., 2005, ARA&A, 43, 531
- Behroozi et al. (2013) Behroozi P. S., Wechsler R. H., Conroy C., 2013, ApJ, 770, 57
- Belczyński & Kalogera (2001) Belczyński K., Kalogera V., 2001, ApJL, 550, L183
- Beniamini & Hotokezaka (2020) Beniamini P., Hotokezaka K., 2020, MNRAS, 496, 1891
- Beniamini & Piran (2016) Beniamini P., Piran T., 2016, MNRAS, 456, 4089
- Beniamini et al. (2016a) Beniamini P., Hotokezaka K., Piran T., 2016a, ApJL, 829, L13
- Beniamini et al. (2016b) Beniamini P., Hotokezaka K., Piran T., 2016b, ApJ, 832, 149
- Beniamini et al. (2018) Beniamini P., Dvorkin I., Silk J., 2018, MNRAS, 478, 1994
- Brauer et al. (2019) Brauer K., Ji A. P., Frebel A., Dooley G. A., Gómez F. A., O’Shea B. W., 2019, ApJ, 871, 247
- Bromm (2013) Bromm V., 2013, Rep. Prog. Phys., 76, 112901
- Bromm & Yoshida (2011) Bromm V., Yoshida N., 2011, ARA&A, 49, 373
- Bromm et al. (2001) Bromm V., Kudritzki R. P., Loeb A., 2001, ApJ, 552, 464
- Brook et al. (2014) Brook C. B., Di Cintio A., Knebe A., Gottlöber S., Hoffman Y., Yepes G., Garrison-Kimmel S., 2014, ApJL, 784, L14
- Brown et al. (2014) Brown T. M., et al., 2014, ApJ, 796, 91
- Bullock & Boylan-Kolchin (2017) Bullock J. S., Boylan-Kolchin M., 2017, ARA&A, 55, 343
- Chabrier (2003) Chabrier G., 2003, Publ. Astron. Soc. Pac., 115, 763
- Chiti et al. (2018a) Chiti A., et al., 2018a, ApJ, 856, 142
- Chiti et al. (2018b) Chiti A., Frebel A., Ji A. P., Jerjen H., Kim D., Norris J. E., 2018b, ApJ, 857, 74
- Chornock et al. (2017) Chornock R., et al., 2017, ApJL, 848, L19
- Choudhury et al. (2015) Choudhury T. R., Puchwein E., Haehnelt M. G., Bolton J. S., 2015, MNRAS, 452, 261
- Côté et al. (2018) Côté B., et al., 2018, ApJ, 855, 99
- Côté et al. (2019) Côté B., et al., 2019, ApJ, 875, 106
- Cowperthwaite et al. (2017) Cowperthwaite P. S., et al., 2017, ApJL, 848, L17
- De Donder & Vanbeveren (2004) De Donder E., Vanbeveren D., 2004, New Astron. Rev., 48, 861
- Dominik et al. (2012) Dominik M., Belczynski K., Fryer C., Holz D. E., Berti E., Bulik T., Mand el I., O’Shaughnessy R., 2012, ApJ, 759, 52
- Drlica-Wagner et al. (2015) Drlica-Wagner A., et al., 2015, ApJ, 813, 109
- Dvorkin et al. (2020) Dvorkin I., Daigne F., Goriely S., Vangioni E., Silk J., 2020, arXiv:2010.00625, p. arXiv:2010.00625
- Fan et al. (2006) Fan X., et al., 2006, AJ, 132, 117
- Frebel & Bromm (2012) Frebel A., Bromm V., 2012, ApJ, 759, 115
- Frebel & Norris (2015) Frebel A., Norris J. E., 2015, ARA&A, 53, 631
- Frebel et al. (2010) Frebel A., Simon J. D., Geha M., Willman B., 2010, ApJ, 708, 560
- Frebel et al. (2014) Frebel A., Simon J. D., Kirby E. N., 2014, ApJ, 786, 74
- Freiburghaus et al. (1999) Freiburghaus C., Rosswog S., Thielemann F. K., 1999, ApJL, 525, L121
- Gaia Collaboration et al. (2018) Gaia Collaboration et al., 2018, A&A, 616, A1
- Garavito-Camargo et al. (2020) Garavito-Camargo N., Besla G., Laporte C. F. P., Price-Whelan A. M., Cunningham E. C., Johnston K. V., Weinberg M. D., Gomez F. A., 2020, arXiv:2010.00816, p. arXiv:2010.00816
- Garrison-Kimmel et al. (2016) Garrison-Kimmel S., Bullock J. S., Boylan-Kolchin M., Bardwell E., 2016, arXiv:1603.04855,
- Goldstein et al. (2017) Goldstein A., et al., 2017, ApJL, 848, L14
- Greif et al. (2009) Greif T. H., Johnson J. L., Klessen R. S., Bromm V., 2009, MNRAS, 399, 639
- Gunn & Peterson (1965) Gunn J. E., Peterson B. A., 1965, ApJ, 142, 1633
- Haardt & Madau (2011) Haardt F., Madau P., 2011, arXiv:1103.5226,
- Hahn & Abel (2011) Hahn O., Abel T., 2011, MNRAS, 415, 2101
- Hansen et al. (2017) Hansen T. T., et al., 2017, ApJ, 838, 44
- Heger & Woosley (2002) Heger A., Woosley S. E., 2002, ApJ, 567, 532
- Heger & Woosley (2010) Heger A., Woosley S. E., 2010, ApJ, 724, 341
- Hirai et al. (2015) Hirai Y., Ishimaru Y., Saitoh T. R., Fujii M. S., Hidaka J., Kajino T., 2015, ApJ, 814, 41
- Hopkins et al. (2020) Hopkins P. F., Grudić M. Y., Wetzel A., Kereš D., Faucher-Giguère C.-A., Ma X., Murray N., Butcher N., 2020, MNRAS, 491, 3702
- Ishigaki et al. (2014) Ishigaki M. N., Tominaga N., Kobayashi C., Nomoto K., 2014, ApJL, 792, L32
- Iwamoto et al. (2005) Iwamoto N., Umeda H., Tominaga N., Nomoto K., Maeda K., 2005, Science, 309, 451
- Jeon et al. (2014) Jeon M., Pawlik A. H., Bromm V., Milosavljević M., 2014, MNRAS, 444, 3288
- Jeon et al. (2017) Jeon M., Besla G., Bromm V., 2017, ApJ, 848, 85
- Jeon et al. (2019) Jeon M., Besla G., Bromm V., 2019, ApJ, 878, 98
- Jeon et al. (2021) Jeon M., Bromm V., Besla G., Yoon J., Choi Y., 2021, MNRAS, 502, 1
- Ji & Frebel (2018) Ji A. P., Frebel A., 2018, ApJ, 856, 138
- Ji et al. (2016a) Ji A. P., Frebel A., Chiti A., Simon J. D., 2016a, Nature, 531, 610
- Ji et al. (2016b) Ji A. P., Frebel A., Simon J. D., Chiti A., 2016b, ApJ, 830, 93
- Ji et al. (2016c) Ji A. P., Frebel A., Ezzeddine R., Casey A. R., 2016c, ApJL, 832, L3
- Kallivayalil et al. (2018) Kallivayalil N., et al., 2018, ApJ, 867, 19
- Karlsson et al. (2013) Karlsson T., Bromm V., Bland-Hawthorn J., 2013, Rev. Mod. Phys., 85, 809
- Kirby et al. (2013) Kirby E. N., Cohen J. G., Guhathakurta P., Cheng L., Bullock J. S., Gallazzi A., 2013, ApJ, 779, 102
- Klessen & Lin (2003) Klessen R. S., Lin D. N., 2003, Physical Review E, 67, 046311
- Lai et al. (2011) Lai D. K., Lee Y. S., Bolte M., Lucatello S., Beers T. C., Johnson J. A., Sivarani T., Rockosi C. M., 2011, ApJ, 738, 51
- Marigo (2001) Marigo P., 2001, A&A, 370, 194
- Marshall et al. (2019) Marshall J. L., et al., 2019, ApJ, 882, 177
- McConnachie (2012) McConnachie A. W., 2012, AJ, 144, 4
- McGreer et al. (2015) McGreer I. D., Mesinger A., D’Odorico V., 2015, MNRAS, 447, 499
- Mennekens & Vanbeveren (2016) Mennekens N., Vanbeveren D., 2016, A&A, 589, A64
- Munshi et al. (2013) Munshi F., et al., 2013, ApJ, 766, 56
- Naiman et al. (2018) Naiman J. P., et al., 2018, MNRAS, 477, 1206
- Nishimura et al. (2015) Nishimura N., Takiwaki T., Thielemann F.-K., 2015, ApJ, 810, 109
- Nomoto et al. (2013) Nomoto K., Kobayashi C., Tominaga N., 2013, ARA&A, 51, 457
- Norris et al. (2010) Norris J. E., Wyse R. F. G., Gilmore G., Yong D., Frebel A., Wilkinson M. I., Belokurov V., Zucker D. B., 2010, ApJ, 723, 1632
- Oñorbe et al. (2015) Oñorbe J., Boylan-Kolchin M., Bullock J. S., Hopkins P. F., Kereš D., Faucher-Giguère C.-A., Quataert E., Murray N., 2015, MNRAS, 454, 2092
- Omukai (2000) Omukai K., 2000, ApJ, 534, 809
- Pan et al. (2017) Pan Y. C., et al., 2017, ApJL, 848, L30
- Patel et al. (2020) Patel E., et al., 2020, ApJ, 893, 121
- Peñarrubia et al. (2008) Peñarrubia J., Navarro J. F., McConnachie A. W., 2008, ApJ, 673, 226
- Pian et al. (2017) Pian E., et al., 2017, Nature, 551, 67
- Portinari et al. (1998) Portinari L., Chiosi C., Bressan A., 1998, A&A, 334, 505
- Puchwein et al. (2019) Puchwein E., Haardt F., Haehnelt M. G., Madau P., 2019, MNRAS, 485, 47
- Roederer et al. (2016) Roederer I. U., et al., 2016, AJ, 151, 82
- Safarzadeh & Scannapieco (2017) Safarzadeh M., Scannapieco E., 2017, MNRAS, 471, 2088
- Safarzadeh et al. (2019) Safarzadeh M., Sarmento R., Scannapieco E., 2019, ApJ, 876, 28
- Sales et al. (2017) Sales L. V., Navarro J. F., Kallivayalil N., Frenk C. S., 2017, MNRAS, 465, 1879
- Savchenko et al. (2017) Savchenko V., et al., 2017, ApJL, 848, L15
- Schaye et al. (2010) Schaye J., et al., 2010, MNRAS, 402, 1536
- Schmidt (1959) Schmidt M., 1959, ApJ, 129, 243
- Shen et al. (2014) Shen S., Madau P., Conroy C., Governato F., Mayer L., 2014, ApJ, 792, 99
- Shen et al. (2015) Shen S., Cooke R. J., Ramirez-Ruiz E., Madau P., Mayer L., Guedes J., 2015, ApJ, 807, 115
- Simon (2019) Simon J. D., 2019, ARA&A, 57, 375
- Simon et al. (2010) Simon J. D., Frebel A., McWilliam A., Kirby E. N., Thompson I. B., 2010, ApJ, 716, 446
- Simpson et al. (2013) Simpson C. M., Bryan G. L., Johnston K. V., Smith B. D., Mac Low M.-M., Sharma S., Tumlinson J., 2013, MNRAS, 432, 1989
- Skúladóttir & Salvadori (2020) Skúladóttir Á., Salvadori S., 2020, A&A, 634, L2
- Springel (2005) Springel V., 2005, MNRAS, 364, 1105
- Springel et al. (2001) Springel V., White S. D. M., Tormen G., Kauffmann G., 2001, MNRAS, 328, 726
- Strigari (2018) Strigari L. E., 2018, Reports on Progress in Physics, 81, 056901
- Takahashi et al. (1994) Takahashi K., Witti J., Janka H. T., 1994, A&A, 286, 857
- Tarumi et al. (2020) Tarumi Y., Yoshida N., Inoue S., 2020, MNRAS, 494, 120
- Tarumi et al. (2021) Tarumi Y., Hotokezaka K., Beniamini P., 2021, arXiv:2102.03368, p. arXiv:2102.03368
- Tauris et al. (2017) Tauris T. M., et al., 2017, ApJ, 846, 170
- Thielemann et al. (2003) Thielemann F.-K., et al., 2003, in Hillebrandt W., Leibundgut B., eds, From Twilight to Highlight: The Physics of Supernovae. p. 331, doi:10.1007/10828549_46
- Tinsley (1979) Tinsley B. M., 1979, ApJ, 229, 1046
- Tolstoy et al. (2009) Tolstoy E., Hill V., Tosi M., 2009, ARA&A, 47, 371
- Tsujimoto & Shigeyama (2014) Tsujimoto T., Shigeyama T., 2014, A&A, 565, L5
- Tsujimoto et al. (2015) Tsujimoto T., Ishigaki M. N., Shigeyama T., Aoki W., 2015, PASJ, 67, L3
- Wanajo et al. (2014) Wanajo S., Sekiguchi Y., Nishimura N., Kiuchi K., Kyutoku K., Shibata M., 2014, ApJL, 789, L39
- Weisz et al. (2014) Weisz D. R., Dolphin A. E., Skillman E. D., Holtzman J., Gilbert K. M., Dalcanton J. J., Williams B. F., 2014, ApJ, 789, 148
- Wheeler et al. (2015) Wheeler C., Oñorbe J., Bullock J. S., Boylan-Kolchin M., Elbert O. D., Garrison-Kimmel S., Hopkins P. F., Kereš D., 2015, MNRAS, 453, 1305
- Wheeler et al. (2019) Wheeler C., et al., 2019, MNRAS, 490, 4447
- Willman (2010) Willman B., 2010, Advances in Astronomy, 2010, 285454
- Wise et al. (2012) Wise J. H., Turk M. J., Norman M. L., Abel T., 2012, ApJ, 745, 50
- Woosley et al. (1994) Woosley S. E., Wilson J. R., Mathews G. J., Hoffman R. D., Meyer B. S., 1994, ApJ, 433, 229
- Wu et al. (2016) Wu M.-R., Fernández R., Martínez-Pinedo G., Metzger B. D., 2016, MNRAS, 463, 2323
- Yoon et al. (2019) Yoon J., Beers T. C., Tian D., Whitten D. D., 2019, ApJ, 878, 97
- van de Voort et al. (2015) van de Voort F., Quataert E., Hopkins P. F., Kereš D., Faucher-Giguère C.-A., 2015, MNRAS, 447, 140
- van de Voort et al. (2020) van de Voort F., Pakmor R., Grand R. J. J., Springel V., Gómez F. A., Marinacci F., 2020, MNRAS, 494, 4867