High-performance Evolutionary Algorithms for Online Neuron Control
Abstract.
Recently, optimization has become an emerging tool for neuroscientists to study neural code. In the visual system, neurons respond to images with graded and noisy responses. Image patterns eliciting highest responses are diagnostic of the coding content of the neuron. To find these patterns, we have used black-box optimizers to search a 4096d image space, leading to the evolution of images that maximize neuronal responses. Although genetic algorithm (GA) has been commonly used, there haven’t been any systematic investigations to reveal the best performing optimizer or the underlying principles necessary to improve them.
Here111Code available at https://github.com/Animadversio/ActMax-Optimizer-Dev, we conducted a large scale in silico benchmark of optimizers for activation maximization and found that Covariance Matrix Adaptation (CMA) excelled in its achieved activation. We compared CMA against GA and found that CMA surpassed the maximal activation of GA by 66% in silico and 44% in vivo. We analyzed the structure of Evolution trajectories and found that the key to success was not covariance matrix adaptation, but local search towards informative dimensions and an effective step size decay. Guided by these principles and the geometry of the image manifold, we developed SphereCMA optimizer which competed well against CMA, proving the validity of the identified principles.

1. Introduction
An essential goal in sensory neuroscience is to define how the neurons respond to natural stimuli and extract useful information to guide behavior. To a first approximation, visual neurons emit high rates of electrical signals to stimuli with certain visual attributes, so their outputs can be interpreted as conveying the presence of such features (e.g. ”face neurons”(Hubel and Wiesel, 1962; Quiroga et al., 2005)). So to study the visual selectivity of neurons, it is crucial to choose highly activating stimuli.
Traditionally, researchers have used intuition(Gross, 1994) or limited theoretical frameworks to choose a fixed set of stimuli, i.e., simple images, such as circles and rings for studying lateral geniculate nucleus cells, oriented bars for V1 neurons, hyperbolic gratings for V2 neurons(Hegdé and Van Essen, 2000), curved shapes for V4 neurons(Pasupathy and Connor, 1999), or select categories such as faces for inferotemporal cortex neurons(Desimone et al., 1984). The desired property of these stimuli is their ability to drive neuronal activity. But as visual neurons become more selective along the posterior-anterior anatomical axis — responding to more complex visual attribute combinations — it becomes more difficult to choose highly activating stimuli.
To tackle this problem, an alternative approach is to use adaptive-search methods to find highly activating stimuli. The idea is to treat neuronal responses as a function of visual stimuli, and to iteratively search for variants that maximize this function. As images evolve under this search, they acquire visual attributes informative of the neuron’s intrinsic tuning, independent of bias in human intuition.
Problem Formulation
Formally, neurons can be conceptualized as noisy scalar functions over the image space . One common objective is to maximize the function —also known as activation maximization, commonly used for interpreting the coding content of neurons or CNN hidden units (Nguyen et al., 2016):
| (1) | |||
| (2) |
While this approach can be easily generalized to other objectives, we focus on activation maximization since making neurons fire strongly has been the most common goal in sensory neuroscience studies over the decades (Hubel and Wiesel, 1962).
In the context of in vivo experiments, the process amounts to recording a set of neuronal activations in response to a set of randomly sampled images (each image displayed for a short duration, e.g. 100 ms, Fig. 1A). In the next step, the optimizers update their state and propose a new set of images. By repeating this process for dozens of iterations, the images begin to acquire visual attributes that drives the neuron’s activity highly. Usually, in one of these so-called Evolution experiments, the number of image presentations is limited to 1000-3000, taking 20-40 min. This mandates a high sample efficiency of the optimizer.
For most optimization algorithms, stimuli need to be represented in and generated from a ”vector space”. We consider a smooth parametrization of images using a lower-dimensional vector space. In this implementation, the mapping from vector space to images is instantiated by an image generative neural network (DeePSim Generative Adversarial Network (GAN) (Dosovitskiy and Brox, 2016)), which maps 4096d latent vectors to images. Thus the problem is about searching for images in the latent space such that it maximizes the response of the neuron.
This optimization approach has been applied to neurons in visual areas V4 and inferotemporal cortex (IT) (Yamane et al., 2008; Rose et al., 2021; Carlson et al., 2011; Hung et al., 2012; Srinath et al., 2021; Ponce et al., 2019). Image search was effectuated by classic genetic algorithms (GAs), acting in the space of parametrized 3D shapes or GANs. Though the use of GAs was successful in this domain (Xiao and Kreiman, 2020), it has not been tested comprehensively against modern optimizers, which motivated us to determine if we could improve performance on this front.
This problem features a unique set of challenges, for example, search dimensionality is very high (e.g. in (Xiao and Kreiman, 2020; Ponce et al., 2019; Rose et al., 2021)), and the function must be evaluated with considerable noise in neuronal responses. Further, the total number of function evaluation is highly limited (), thus the dimensions could not be exhaustively explored.
In this project, we worked to improve the performance of optimizer in this domain and to extract the underlying principles for designing such optimizer. The main contributions are as follows:
-
•
We conducted two in silico benchmarks, establishing the better performance of CMA-type optimizers over other optimizers including commonly used genetic algorithms (GA).
-
•
We validated the performance increase of the CholeskyCMA algorithm, with a focused contrast to classic GA in vivo.
-
•
We found that the CMA search trajectories exhibited the spectral signature of high-dimensional guided random walks, preferentially traveling along the top eigen-dimensions of the underlying image manifold.
-
•
We found one reason that CMA succeeded was the decrease of angular step size, thanks to the spherical geometry of image space and the increased vector norms in Evolution.
-
•
Guided by image space geometry, we built in these mechanisms to develop a SphereCMA algorithm, which outperformed the original CMA in silico.
2. Survey of Black Box Optimizers
Because in vivo tests of optimizer performance can be costly and time-consuming, we began by screening a large set of algorithms in silico using convolutional neural network (CNN) units as proxies for visual neurons, then tested the top performing algorithms with actual neurons in a focused comparison.
2.1. Large Scale in silico Survey
To simulate neuronal tuning function that an optimizer might encounter in a biological setting, we used units from pre-trained CNNs as models of visual neurons (Xiao and Kreiman, 2020; Lindsay, 2020). For the in vivo Evolution experiments, we aimed for optimizers that performed well with neurons across visual areas (including V1, V4, IT) and across different levels of signal-to-noise and single-neuron isolation. Thus we designed the benchmark ”problem set” to include units from multiple CNN architectures, layers, and noise levels, testing the overall performance for each optimizer.
We chose AlexNet and a deeper, adversarially trained ResNet (ResNet50-robust) as models of ventral visual cortex. The latter was chosen because it exhibits visual representations similar to the brain (high rank on Brain-Score (Schrimpf et al., 2018)). For each network, we picked 5 layers of different depths. It has been noted that units from shallow-to-deep layers prefer features of increasing complexity (Nguyen et al., 2016), similar to that in the ventral stream cortical hierarchy (Rose et al., 2021). For detailed information about these networks and their layers, see Sec. A.1. In the context of in vivo recordings, single-presentation neuronal responses are highly noisy (Czanner et al., 2015). To simulate the Poisson-like noisy response , we added Gaussian noise with zero mean and standard deviation proportional to the raw response (ratio represented the noise level). We tested three noise levels for each objective function: no noise (), low noise (), and high noise ().
| (3) |
In the first round, we chose 12 gradient-free optimizers as implemented or interfaced by nevergrad(Rapin and Teytaud, 2018): NGOpt, DE, TwoPointsDE, ES, CMA(Hansen and Ostermeier, 2001), DiagonalCMA(Akimoto and Hansen, 2020), RescaledCMA, SQPCMA, PSO, OnePlusOne, TBPSA, and RandomSearch. Here we compared these algorithms by their default hyper-parameter settings. Note that RandomSearch just sampled random vectors from an isotropic Gaussian distribution, finding the vector with the highest score, which formed the naive baseline (for a short introduction to these algorithms, see (Rapin and Teytaud, 2018)). Each algorithm ran with a budget of 3000 function evaluations and three repetitions per condition.
Among the 12 optimizers, we found that Covariance Matrix Adaptation Evolution Strategy (CMA) and DiagonalCMA were the top two algorithms in achieving maximal activation (Fig. 2). Since the upper bound of the activation of a unit in CNN was arbitrary, we divided the raw activations by the empirical maximal activation achieved by that given unit, across all algorithms and repetitions. By this measure, when pooling all conditions, CMAES achieved , DiagonalCMA achieved , as a reference Random Search baseline achieved (mean sem, , Tab. A.2, Fig. 2. This difference of CMA-driven performance vs. any other optimizer was significant per a two-sample t-test: for all comparisons, except for CMA vs DiagonalCMA, where ). We found the same result held consistently for units across CNN models, layers and noise levels (see comparison in Tab. A.2). The optimization score traces and the most activating images found for an example ResNet unit are shown in Fig. A.1 and Fig. A.3.
As for time efficiency, we measured the total run time taken by optimizing the objective function with a budget of 3000 evaluations222These optimizers were tested on single core machine with V100 GPU without batch processing of images or activations.. With units from AlexNet as objective, CMA had a longer runtime of s (mean std); DiagonalCMA accelerated the runtime by roughly five-fold ( sec), although at a slightly compromised score (6.1%). As a reference, the baseline algorithm RandomSearch had an average runtime of sec. Same trends held for ResNet50 units, though the runtime values were generally longer because ResNet50 is deeper (Tab. A.2). In conclusion, we found CMA and DiagonalCMA algorithms were both well-suited for this domain, while DiagonalCMA achieved a good trade-off between speed and performance.

2.2. Comparison of CMA-type Algorithm with GA in silico
Given the general success of CMA and DiagonalCMA algorithm, we were motivated to test other types of CMA algorithms in the second round, comparing runtime values and achieved activations.
As described in (Hansen, 2016), the CMA algorithm maintains and updates a Gaussian distribution in the space, with the mean vector and step size initialized by the user; the covariance matrix is initialized as identity matrix . In each step, the algorithm samples a population of codes from this exploration distribution, . After evaluating these codes, it updates the mean vector by a weighted combination of the highest ranking codes. Note that controls both the spread of samples in a generation and the average step size of the mean vector update . This step size is adapted based on the accumulated path length in the last few steps. Moreover, CMA updates the covariance matrix by a few low-rank matrices to adapt the shape of the exploration distribution.
In the original CMAES algorithm, after each covariance update, the covariance matrix needed to be eigen-decomposed, in order to get . For a high dimensional space , it is costly to compute this decomposition at each update. Using the diagonal covariance matrix approximation, the inversion step could be simplified from a operation to operation, which makes the DiagonalCMA (Akimoto and Hansen, 2020) much faster (Fig. 2). This inspired us to use modified covariance update rules to accelerate the optimizer.
We found Cholesky-CMA-ES (Loshchilov, 2015) which was proposed as a large scale variant of CMAES. By storing the Cholesky factor and its inverse of the covariance matrix, it could update these factors directly, without factorizing the covariance matrix at each update. An additional parameter A_update_freq could be adjusted to tune the frequency of this update.
We implemented the -Cholesky-CMA-ES algorithm (CholeskyCMA) (Loshchilov, 2015) and compared it against the CMA and DiagonalCMA implemented in pycma library (Hansen and Auger, 2014; Akimoto and Hansen, 2020) and the Genetic Algorithm (GA), classically used in this domain (Ponce et al., 2019; Srinath et al., 2021). For CholeskyCMA, the hyper-parameters and update frequency of Cholesky factor were tuned and fixed , A_update_freq. For GA, we used the code and hyperparameters from (Ponce et al., 2019). We allowed for 3000 function evaluations per optimizer, which was 75 generations with a population size of 40.
We slightly modified the in silico benchmark: we chose 7 layers from AlexNet (conv2 to fc8), 10 units from each layer, with 3 noise levels (). Each optimizer were run with 5 repetitions in each condition, totaling 1050 runs. We evaluated the clean score, i.e. the highest noise-free activation of the given unit and the runtime for each optimizer. Here we also used the empirical maximal clean score achieved for each unit to get the normalized clean score and to calculate statistics.
The results were summarized in Table 1 and Figures A.4,A.5. We found that all CMA algorithms outperformed Genetic Algorithm by a large margin: if we pooled all conditions, the mean normalized score of CMA was 166.7% of that of GA optimizer. Noise deteriorated the score for all optimizers, and there the performance gap between GA and CMA type algorithm was narrowed but persisted: the mean normalized score for CMA was 196.2% of GA in noise free scenario; 151.9% for ; 146.4% for (Fig. A.4). The overall performance values of the three CMA-type optimizers were not statistically different, and all surpassed GA. (1-way ANOVA, ).
When we examined the performance per layer, we found the relative performance of optimizers had a significant interaction with the source layer of the unit. DiagonalCMA was more effective than Cholesky and original CMA in the earlier layers, but performed less well in deeper layers (Tab. 1, Fig. A.5). We tested this interaction with ANOVA on a linear model: activation optimizer + noiselevel + layer + layer * optimizer + noiselevel * optimizer; in which, ”optimizer” was modelled as a categorical variable (CholeskyCMA, CMA, DiagonalCMA), ”noiselevel” and ”layer” were continuous variable. All the factors except optimizer had statistically significant main effect; and interaction term layer * optimizer had (see Tab. A.1). This curious interaction would be interpreted below in the context of different covariance matrix adaption mechanisms (Sec. 3.1).
As for runtime333Here, latent codes were processed in batch of 40 by generator and CNN, thus the same optimizer ran faster than the previous experiment., DiagonalCMA was still the fastest, with average runtime sec (mean sem, same below.), while the second fastest optimizer was GA with runtime sec. In contrast, the classic CMA algorithm taking was the slowest among the four, while the CholeskyCMA took sec per run. Indeed, updating Cholesky factors made it run faster without reducing performance.
| layer | GA | Chol | CMA | Diag | Sp exp | Sp inv | |
| 0.0 | 0.525 | 0.838 | 0.770 | 0.823 | 0.901 | 0.822 | |
| 0.2 | 0.473 | 0.654 | 0.626 | 0.685 | 0.659 | 0.637 | |
| conv2 | 0.5 | 0.406 | 0.565 | 0.545 | 0.633 | 0.548 | 0.546 |
| 0.0 | 0.443 | 0.791 | 0.793 | 0.812 | 0.886 | 0.819 | |
| 0.2 | 0.398 | 0.618 | 0.607 | 0.663 | 0.603 | 0.598 | |
| conv3 | 0.5 | 0.345 | 0.524 | 0.492 | 0.526 | 0.495 | 0.486 |
| 0.0 | 0.378 | 0.758 | 0.723 | 0.728 | 0.859 | 0.754 | |
| 0.2 | 0.358 | 0.554 | 0.546 | 0.618 | 0.570 | 0.532 | |
| conv4 | 0.5 | 0.299 | 0.446 | 0.435 | 0.468 | 0.440 | 0.420 |
| 0.0 | 0.372 | 0.756 | 0.764 | 0.760 | 0.913 | 0.792 | |
| 0.2 | 0.354 | 0.547 | 0.539 | 0.598 | 0.542 | 0.523 | |
| conv5 | 0.5 | 0.298 | 0.456 | 0.429 | 0.464 | 0.433 | 0.409 |
| 0.0 | 0.244 | 0.571 | 0.577 | 0.519 | 0.766 | 0.613 | |
| 0.2 | 0.228 | 0.361 | 0.370 | 0.429 | 0.404 | 0.399 | |
| fc6 | 0.5 | 0.201 | 0.309 | 0.276 | 0.276 | 0.259 | 0.260 |
| 0.0 | 0.320 | 0.663 | 0.706 | 0.659 | 0.830 | 0.662 | |
| 0.2 | 0.295 | 0.444 | 0.435 | 0.457 | 0.438 | 0.404 | |
| fc7 | 0.5 | 0.249 | 0.338 | 0.344 | 0.345 | 0.310 | 0.318 |
| 0.0 | 0.308 | 0.703 | 0.733 | 0.600 | 0.865 | 0.712 | |
| 0.2 | 0.281 | 0.448 | 0.458 | 0.439 | 0.473 | 0.446 | |
| fc8 | 0.5 | 0.228 | 0.328 | 0.319 | 0.324 | 0.316 | 0.305 |
| Average | 0.333 | 0.556 | 0.547 | 0.563 | 0.596 | 0.546 | |
| runtime (s) | 16.6 | 42.4 | 97.0 | 6.6 | 25.4 | 25.9 | |
2.3. CMA outperformed GA in vivo
After the second round of in silico benchmarks, we were ready to compete the top candidates with previous state-of-the-art Genetic Algorithm in vivo. We chose CholeskyCMA algorithm and compared it against the classic GA, since its speed and performance were both good across noise level and visual hierarchy. For detailed methods of in vivo experiments, we refer readers to Sec. A.2, but briefly, we recorded electrophysiological activity in two animals using chronically implanted arrays, placed within V1, V4 and IT.
We conducted experiments. Two out of fourteen () experiments did not result in a significant increase in firing rate of the neuron for either optimizer (per criterion , for t-test between firing rates in first two and last two generation), which we excluded from the further analysis. From the experiments where at least one optimizer increased the firing rate, we normalized the firing rate of the neuron to the highest generation-averaged firing rate for the CholeskyCMA optimizer (Fig. 1 B). The normalized final generation activation for CholeskyCMA was comparing to for GA (paired t-test, . Raw firing rates for each experiments are shown in Fig. A.6). Thus, the maximal activation of CholeskyCMA surpassed GA by 44%, which was comparable to the activation gain in the high-noise condition (46.2%, ) in silico.
From this, we concluded that CholeskyCMA outperformed classic GA algorithm both in vivo and in silico, becoming the preferred algorithm for conducting activation maximization.
3. The Analysis of CMA Evolution
Why did CMA-type algorithms perform so well? Was it the covariance updates, adaptation of step size, or a fortuitous match between the geometric structure of the latent space and the algorithm? We were motivated to find which component contributed to its success. We reasoned the optimizers should work best when they conform to the geometry of the generative image manifold , and the geometry of neuronal tuning function on the manifold. So we focused on analyzing the geometry of the search trajectory with respect to the geometry of image space (Wang and Ponce, 2021). When available, we analyzed the in silico and in vivo evolutions back-to-back to validate the effect.
3.1. The ”Dysfunction” of Covariance Matrix Adaptation
First, we noticed that in a high-dimensional space, the covariance matrix updates were impaired in the original CMA or CholeskyCMA algorithm. In the default setting444See the default setting of in Tab. 2 of (Hansen and Auger, 2014)., the covariance learning rates , which were exceedingly small at . Thus, the covariance matrix was updated negligibly and could be well approximated by an identity matrix. Recently, this was also pointed out in (Akimoto and Hansen, 2020) (Sec.4,5) and the authors proposed to increase the learning rate in DiagonalCMA. We tested the effectiveness of this modification.
Empirically, we validated this for the original, Cholesky, and Diagonal CMAES algorithms. We quantified this by measuring the condition number of the covariance matrix and its relative distance to identity matrix .
| (4) |
We found that the final generation condition number of the CholeskyCMA was (mean std, , same below), while the relative distance to identity was . In comparison, condition number for the original CMAES was , and for the DiagonalCMA, . The relative distances to the identity matrix were and for original CMA and DiagonalCMA algorithms. Though as designed, DiagonalCMA updated the covariance matrix more effectively than the other two CMA algorithms, its final covariance was still quite isotropic. On the other hand, for the original and CholeskyCMA algorithm, we could safely approximate the exploration distribution by an isotropic Gaussian scaled by the step size
| (5) |
This isotropic exploration throughout the Evolution experiments simplified subsequent analyses of the algorithm.
How is this related to the performance of the algorithm? This relates to the interaction between the unit layer and optimizer, noted above (Sec. 2.2,Tab. 1,Tab. A.1): the DiagonalCMA outperformed original CMA in earlier layers of CNN but not in deeper layers. It seems the faster update of diagonal covariance matrix was only beneficial for units in earlier layers. The diagonal covariance was designed for a separable, ill-conditioned functional landscape. We noticed that although all units had highly ill-conditioned landscapes, the units in shallower layers had tuning for fewer dimensions than units in deeper layers (Sec. C). In other words, the units in earlier layers had a larger invariant space, and a diagonal covariance might suit these landscape better than the more complex ones for deeper units.
In short, we conclude that the effectiveness of CMA-type algorithm was not in its adaptation of the exploratory distribution shape, and we postulate that it could work with fixed covariance.
3.2. Evolution Trajectories Showed a Sinusoidal Structure, Characteristic of Random Walks
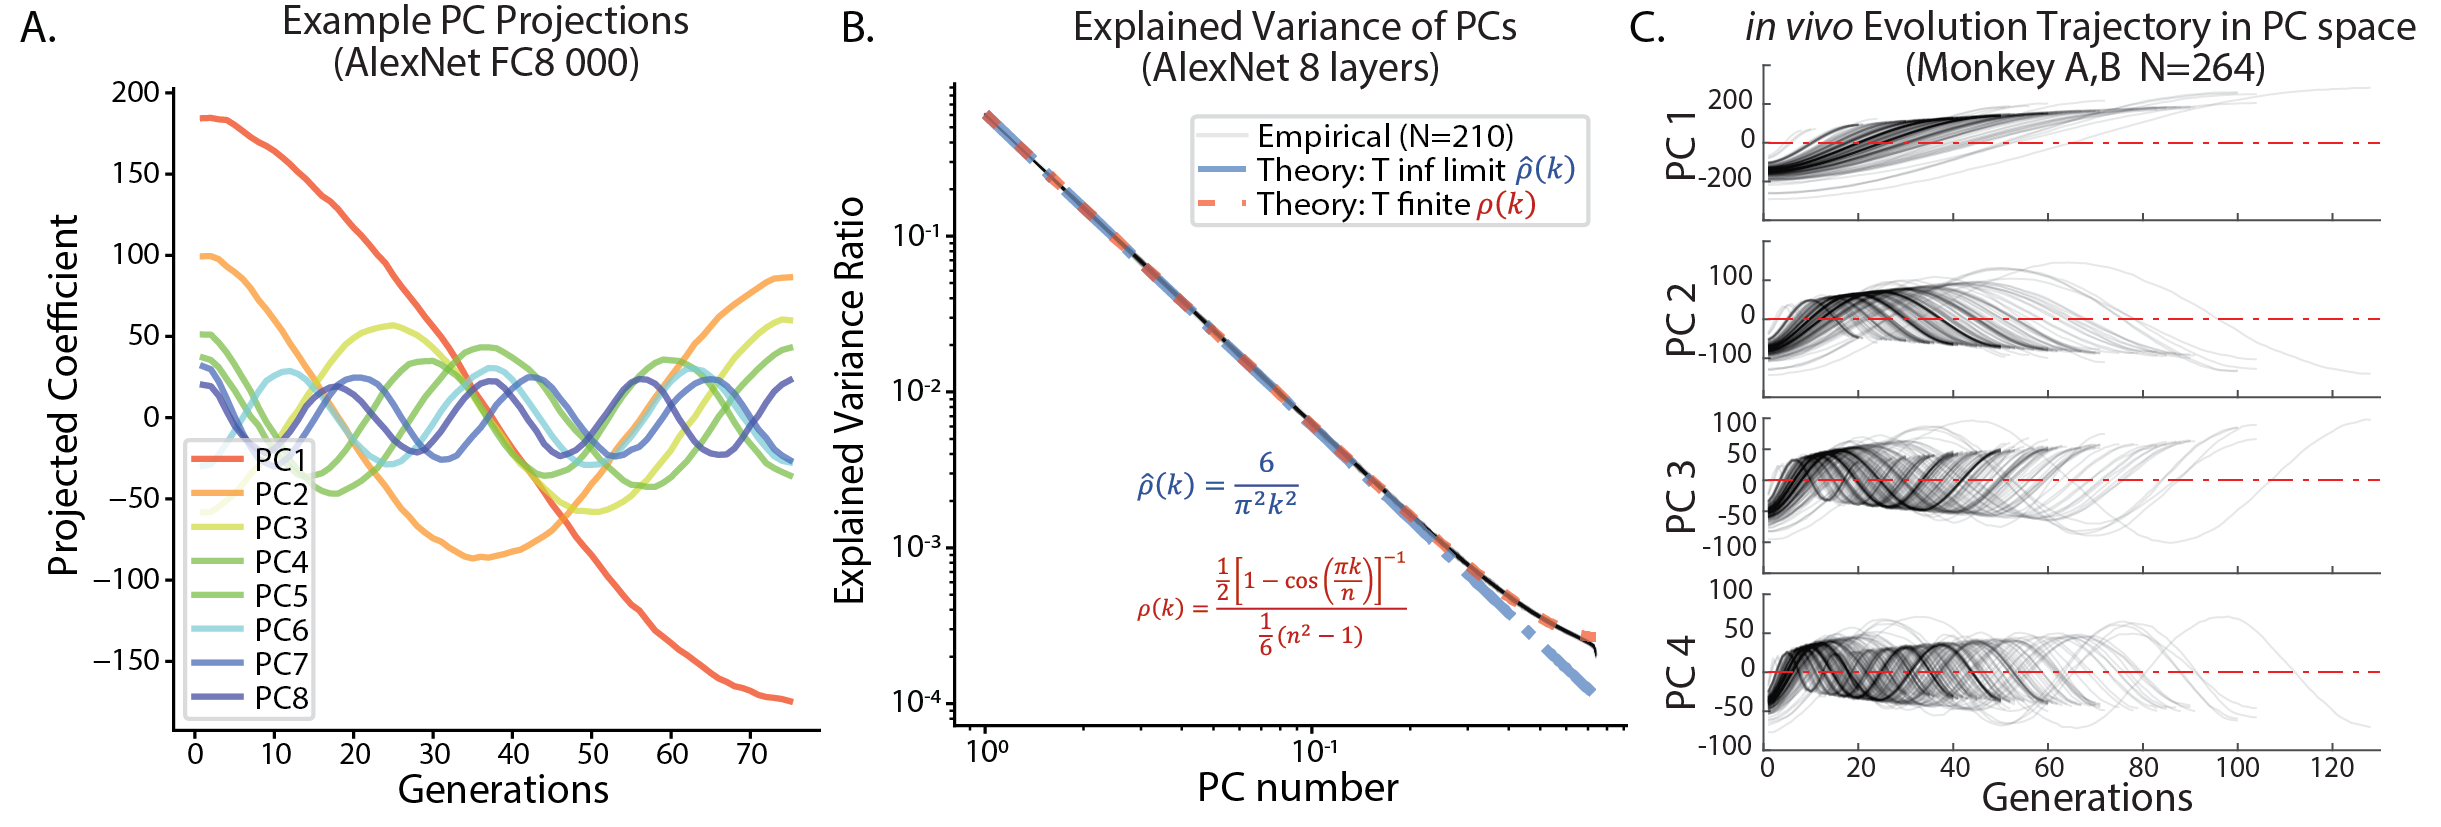
Next, we investigated the geometric structure of the Evolution trajectories, through the lens of Principal Component Analysis (PCA), a linear dimension-reduction algorithm. For each experiment, we computed the mean latent vector for each generation , and applied PCA to this -by- matrix of mean vectors ().
We found a pervasive sinusoidal structure to the typical trajectory. When a given trajectory was projected onto the top principal components (PC), the projection resembled cosine waves (Fig. 3A). On the th component, the projected trajectories were well-fit by cosine functions of frequency : (Fig. D.1A). If we allowed the phase and frequency to be fit, , the fit was above 0.80 for the top 16 PCs for 95% of trajectories (Fig. D.1B). As a result, projecting the mean trajectory onto the top PCs will result in Lissajous curves (Fig. D.3). Further, we analyzed the PCs of the in vivo Evolution experiments (), and found the same sinusoidal structure (Fig. 3C). Even for control evolutions driven by noise, this sinusoidal structure persisted (Fig. D.2).
This intriguing structure was reminiscent of the PCA of another type of high-dimensional optimization trajectory: that of neural-network parameters during training (Lorch, 2016). This structure was later observed and analytically described for high-dimensional random walks or discrete Ornstein-Uhlenbeck (OU) processes guided by potential (Antognini and Sohl-Dickstein, 2018). To test this connection, we examined the explained variance of each principal components (Fig. 3B). We found that the explained variance of the th PC was well approximated by Eq. 6, which was derived as the theoretical limit for PCA of random walk with steps in high-dimensional space555Our Eq.6 was adapted from Eq.12 in (Antognini and Sohl-Dickstein, 2018). We found the original equation had the incorrect normalization factor, so we corrected the denominator as it is now. (Antognini and Sohl-Dickstein, 2018). If we take the step number to infinity in Eq. 6, the explained variance of th PC scales with (Eq. 6), showing a fast decay.
| (6) |
Indeed, both in theory and in our data, the first principal component explained more than variance of mean evolution trajectory, and the top five PC explained close to of the variance (Fig. 3 B). In this view, the evolution trajectory of mean latent code of CMAES could be regarded as a (guided) random walk in high dimensional space, with its main variance residing in a low-dimensional space.
How are evolutionary trajectories related to random walks? In the extreme, when the response is pure noise, the randomly weighted average of the candidates will be isotropic; thus each step is taken isotropically. Intuitively, this is close to a random walk. In our evolutions, the selection of candidates was biased by the visual-attribute tuning of units or neurons, thus their associated trajectories were random walks guided by given potentials. As derived in (Antognini and Sohl-Dickstein, 2018), for random walks guided by quadratic potentials, the structure of trajectory should be dominated by the dimensions with the smallest driving force (curvature). As we will see below (Sec. 3.3, Sec. B,C), the latent space had a large portion of dimensions to which the units were not tuned. This may explain why our evolution trajectories looked like random walks via PCA. In summary, we interpreted this as an intriguing and robust geometric property of high-dimensional curves (Antognini and Sohl-Dickstein, 2018), but its full significance remains to be defined.
3.3. Evolution Trajectories Preferentially Travel in the Top Hessian Eigenspace
Given that individual trajectories had a low-dimensional structure, we asked if there was a common subspace that these Evolution trajectories collectively shared. We reasoned that each optimization trajectory should lead to a local optimum of the tuning function of each given CNNs unit or cortical neuron, encoding relevant visual features. Though different neurons or units prefer diverse visual attributes of different complexity(Rose et al., 2021), it was possible that the preferred visual features populated certain subspaces in the latent space of our generator.
We first collected the in silico Evolution trajectories of runs, across all conditions, and represented each trajectory by the mean code from the final generation, i.e. the evolution direction . We shuffled the entries of each vector to form a control collection of evolution directions , preserving their vector norms. We found that the collection of observed Evolution directions was lower-dimensional than its shuffled counterpart: by PCA, the explained variance of top 7 PCs was larger than the shuffled counterpart ( comparing to 500 shuffles, Fig. A.7).

Next, we examined the relationship between the collection of trajectories and the global geometry of the space (Sec. B). Previously, we reported that the latent space of the generator exhibits a highly anisotropic geometry, as quantified by the Riemannian metric tensor of this image manifold (Wang and Ponce, 2021). The bilinear form defined by this Riemannian metric tensor represented the degree of image change when moving in direction . Consequently, moving in top eigen-directions changes the generated image much more than other directions, while moving in the bottom eigenspace scarcely affects the image (Fig. B.1B,C). Moreover, this structure is homogeneous in the space, thus similar directions will cause rapid image change at different positions in the latent space. Thus, there exist global dimensions that affect the image a lot, and dimensions that do not. We hypothesized that the optimization trajectories might preferentially travel in some part of this eigenspace.
We used the averaged metric tensor from Wang and Ponce (2021, (Wang and Ponce, 2021)). Its eigenvectors with eigenvalues became our reference frame for analyzing trajectories. We projected the collection of evolution directions onto this basis, and examined the mean projection amplitude on each eigenvector as a function of eigenvalue (Fig. 4A). Since for in silico experiments, the initial generation was the origin, this quantity was the average distance travelled along the eigenvector across runs. We expected the trajectories to travel further for eigen-dimensions where more CNN units exhibit ”gradient”.
We applied the Kolmogorov–Smirnov test to determine if the distribution of projection coefficient in the top and bottom eigen-dimensions were different. We found that the projection coefficients onto the top eigen-dimensions as a distribution were significantly different from those onto bottom dimensions (KS statistics , Fig. 4A). Further, within the top PC dimensions, the mean traveled distance strongly correlated with the log eigenvalues (Pearson correlation , Fig. 4A), i.e. the trajectories tended to travel further for dimensions with larger eigenvalues.
As for in vivo evolutions, we examined the collection of evolution trajectories ( from 2 monkeys, (Rose et al., 2021)) and projected them onto the Hessian eigenframe as above. We found that they preferentially aligned with the top eigenspace than the lower eigenspace (Fig. 4B): the distance traveled in the top eigenspace correlated with the eigenvalues (Pearson correlation ). Since in vivo evolutions used a set of initial codes instead of the origin, we used noise-driven evolutions starting from these initial codes as control. As a baseline, the noise-driven evolutions had a lower correlation between the distance traveled and the eigenvalues ( for the noise evolution with matching generations; for that with matching code norm). Our results were robust to the choice of cutoff dimension (600-1000).
In conclusion, this result showed us that the evolution trajectories traveled further in the the top eigenspace, and the average distance traveled was positively correlated with the eigenvalue. How do we interpret this effect? Since the top eigen-dimensions change the images more perceptibly, the tuning functions of neurons and CNN units were more likely to exhibit a ”gradient” in such subspace. As the lower eigenspace did not induce perceptible changes, those dimensions barely affected the activations of units or neurons. Thus, no signal could guide the search in lower eigenspace, inducing dynamics similar to pure diffusion. As the visually tuned units could exhibit gradient in the top eigenspace, the search would be a diffusion with a driving force, allowing the optimizers to travel farther in the top eigenspace.
3.4. The Spherical Geometry of Latent Space Facilitated Convergence

Finally, we noticed one geometric structure that facilitated the convergence of the CMA algorithm. For the DeePSim generator(Dosovitskiy and Brox, 2016) with DCGAN architecture(Radford et al., 2015), the mapping was relatively linear. Namely, changing the scale of the input mainly affected the contrast of the generated image (Fig. B.1). Thus, when the base vector has a larger norm, travelling the same euclidean distance will induce a smaller perceptual change; in contrast, traveling the same angular deviation will result in a similar pattern change regardless of the norm of the base vector (Fig. A.8). We reasoned that the angular distance in latent space would be a better proxy to the perceptual distance across generated images.

We validated this using the perceptual dissimilarity metric Learned Perceptual Image Patch Similarity (LPIPS, (Zhang et al., 2018)). We measured image variability in each generation using the mean LPIPS distance between all pairs. We measured the code variability by the standard deviation (std) of latent codes averaged across dimensions, which was an estimate of the step size and was strongly correlated with the mean L2 distance among codes. We also measured the mean angular distance between all pairs of codes in each generation. We found that the std of latent codes decreased from (first generation) to (), and hit the floor at around 25 generations (Fig. 6). In contrast, the perceptual variability kept decreasing till the end, which was better approximated by the trend of angular variability within each generation (from 1.57 rad to 0.50 rad, Fig. 6). This discrepancy of Euclidean and angular distance was mediated by the increasing vector norm during evolution: we found that the squared norm of the mean latent codes scaled linearly with generation (, , Fig. D.2C), which is a classic property of a random walk. As a combined effect of the increasing vector norm and the decreasing step size , the angular variability within a generation decreased towards the end. Similarly, we found that across each given trajectory, angular distance was also a better proxy for the perceptual distance between images than L2 distance (Fig. 5). The mean-code images from late generations were more similar to each other than the ones from initial generations, as predicted by the angular distance between the mean vectors — but not L2 distance.
For a visual neuron or a CNN unit, the perceptual distances across images matter more. Thus, when designing the new optimizer, we reasoned it should control the angular step size as a proxy to perceptual distance, instead of the Euclidean distance () (Sec. 4).
4. Proposed Improvement: SphereCMA
Finally, we proposed an optimizer incorporating the findings above. We would test whether this new optimizer could perform as well as the original CMA algorithms.
This optimizer is designed to operate on a hypersphere, thus it was called SphereCMA (Alg. 1). This design was guided by the training of the image generator . Many generative models (GAN) were trained to map an isotropic distribution of latent codes (e.g. Gaussian (Karras et al., 2019; Dosovitskiy and Brox, 2016) or truncated Gaussian (Brock et al., 2018)) to a distribution of natural images. Thus, the generator has only learned to map latent codes sampled from this distribution. In a high-dimensional space, the density of standard normal distribution concentrates around a thin spherical shell with radius . Due to this, latent codes should be sampled from this hypersphere to obtain natural images. Thus, we enforced the optimizer to search on this sphere.

To design it, we leveraged the principles we learned from CMA-ES and the geometry of the latent space. First, since higher contrast images usually stimulate neurons or CNN units better, we set the spherical optimizer to operate at a norm comparable to that achieved by the end of a successful evolution experiment (), ensuring a high contrast from the start. Second, since the covariance matrix update did not contribute to the success of the CMA-ES algorithm in this application (Sec. 3.1), we kept the algorithm exploring in an isotropic manner, without covariance update. To sample codes on the sphere, we used a trick from differential geometry, sampling vectors isotropically in the tangent space of the mean vector , and then mapping these tangent vectors onto the sphere as new samples (Fig. 7). Third, since the angular distance better approximated the perceptual change in the image (Sec. 3.4), we controlled the perceptual variability in each generation by sampling codes with a fixed angular distance (the step size ) to the mean vector. Fourth and final, as the latent vector norm was fixed, the SphereCMA lacked the step size shrinking mechanism endowed by increasing code norm (Sec. 3.4). We built in an angular step size decay function modelling that in Fig. 6, to help convergence.
We tested this algorithm against other CMA-style algorithms in the same setup as in Sec. 2.2. Specifically, we tested two versions with different step-size-decay function , exponential (Sp Exp) and inverse function (Sp Inv). The change of angular step size through generations is shown in Fig. A.9, the parameters for the decay function were tuned by Bayesian optimization and fixed.
We found that, SphereCMA with exponential decay (Sp Exp) outperformed all other CMA algorithms when pooled across all noise levels and layers (Tab. 1, two-sample t-tests, for CholeskyCMA, for original CMA, for DiagonalCMA, ). Compared to CholeskyCMA, SphereCMA surpassed its achieved activation by around 7%. Interestingly, when we compared the performance per noise level, we found that SphereCMA-Exp was the best performing algorithm under the noise-free condition () across the seven layers (two-sample t-test, for all of CholeskyCMA, original CMA and DiagonalCMA; runs were pooled across 7 layers, , same below). But in noisier conditions, it performed comparably or sometimes worse than other CMA optimizers: at all comparisons with other optimizers were not significant except for SphereCMA-Exp vs DiagonalCMA at (). For trajectory comparison, see Fig. A.2.
Overall, this result confirmed that the principles extracted from analyzing CMA-style algorithms were correct and crucial for their performance. By building these essential structures into our spherical optimizer, we could replicate and even improve the performance of CMA-ES algorithms. Finally, the interaction between the performance of SphereCMA-Exp and the noise level, provided us a future direction to find the source of noise resilience in the original CMA algorithm and improve on the SphereCMA algorithm.
5. Discussion
In this study, we addressed a problem common to both machine learning and visual neuroscience – the problem of defining the visual attributes learned by hidden units/neurons across the processing hierarchy. Neurons and hidden units are highly activated when the incoming visual signal matches their encoded attributes, so one guiding principle for defining their encoded information is to search for stimuli that lead to high activations. Since the brain does not lend itself to gradient descent, it is necessary to use evolutionary algorithms to maximize activations of visual neurons in vivo. Here, we identified a class of optimizers (CMA) that work well for this application and analyzed why they perform so well, and finally developed a faster and better optimizer (SphereCMA) based on these analysis. Here are some lessons we learned in this exploration. First, screening with comprehensive in silico benchmarks accelerates the algorithm development in vivo. Secondly, geometry of latent space matters. As a general message, when developing optimizers searching in the latent space of some generative models, we should pay attention to the distance structure i.e. geometry of the generated samples (e.g. images) instead of the latent space. Optimizers leveraging space geometry shall perform better. We hope our workflow can help the optimizer design in other domains, e.g. search for optimal stimuli in other sensory modalities and drug discovery in molecular space.
Acknowledgements.
We appreciate Mary Burkemper in her assistance in monkey managing and data collection. We thank Yunyi Shen, Kaining Zhang for reading the manuscript and providing valuable feedbacks. We are grateful to the RIS cluster and staff in Washington University in St Louis for their GPU resources and technical support. B.W. is funded by the McDonnell Center for Systems Neuroscience in Washington University (pre-doctoral fellowship to B.W.). Additional research funding by the David and Lucile Packard Foundation and the E. Matilda Ziegler Foundation for the Blind (C.R.P.).References
- (1)
- Akimoto and Hansen (2020) Y. Akimoto and N. Hansen. 2020. Diagonal Acceleration for Covariance Matrix Adaptation Evolution Strategies. Evolutionary Computation 28, 3 (sep 2020), 405–435. https://doi.org/10.1162/EVCO_A_00260 arXiv:1905.05885
- Antognini and Sohl-Dickstein (2018) Joseph M Antognini and Jascha Sohl-Dickstein. 2018. PCA of high dimensional random walks with comparison to neural network training. arXiv preprint arXiv:1806.08805 (2018).
- Brock et al. (2018) Andrew Brock, Jeff Donahue, and Karen Simonyan. 2018. Large scale gan training for high fidelity natural image synthesis. arXiv preprint arXiv:1809.11096 (2018).
- Carlson et al. (2011) Eric T. Carlson, Russell J. Rasquinha, Kechen Zhang, and Charles E. Connor. 2011. A sparse object coding scheme in area V4. Current biology : CB 21 (2 2011), 288–293. Issue 4. https://doi.org/10.1016/J.CUB.2011.01.013
- Czanner et al. (2015) Gabriela Czanner, Sridevi V. Sarma, Demba Ba, Uri T. Eden, Wei Wu, Emad Eskandar, Hubert H. Lim, Simona Temereanca, Wendy A. Suzuki, and Emery N. Brown. 2015. Measuring the signal-to-noise ratio of a neuron. Proceedings of the National Academy of Sciences of the United States of America 112, 23 (jun 2015), 7141–7146. https://doi.org/10.1073/pnas.1505545112
- Deng et al. (2009) Jia Deng, Wei Dong, Richard Socher, Li-Jia Li, Kai Li, and Li Fei-Fei. 2009. Imagenet: A large-scale hierarchical image database. In 2009 IEEE conference on computer vision and pattern recognition. Ieee, 248–255.
- Desimone et al. (1984) R. Desimone, T. D. Albright, C. G. Gross, and C. Bruce. 1984. Stimulus-selective properties of inferior temporal neurons in the macaque. The Journal of neuroscience : the official journal of the Society for Neuroscience 4, 8 (aug 1984), 2051–62. https://doi.org/10.1523/JNEUROSCI.04-08-02051.1984
- Dosovitskiy and Brox (2016) Alexey Dosovitskiy and Thomas Brox. 2016. Generating images with perceptual similarity metrics based on deep networks. In Advances in neural information processing systems. 658–666.
- Freeman and Simoncelli (2011) Jeremy Freeman and Eero P Simoncelli. 2011. Metamers of the ventral stream. Nature neuroscience 14, 9 (2011), 1195–1201.
- Gross (1994) Charles G. Gross. 1994. How inferior temporal cortex became a visual area. Cerebral Cortex 4, 5 (1994), 455–469. https://doi.org/10.1093/cercor/4.5.455
- Hansen (2016) Nikolaus Hansen. 2016. The CMA Evolution Strategy: A Tutorial. (apr 2016). arXiv:1604.00772 http://arxiv.org/abs/1604.00772
- Hansen and Auger (2014) Nikolaus Hansen and Anne Auger. 2014. Principled Design of Continuous Stochastic Search: From Theory to Practice. (2014), 145–180. https://doi.org/10.1007/978-3-642-33206-7_8
- Hansen and Ostermeier (2001) N. Hansen and A. Ostermeier. 2001. Completely derandomized self-adaptation in evolution strategies. Evolutionary computation 9, 2 (2001), 159–195. https://doi.org/10.1162/106365601750190398
- Hegdé and Van Essen (2000) J. Hegdé and D. C. Van Essen. 2000. Selectivity for complex shapes in primate visual area V2. The Journal of neuroscience : the official journal of the Society for Neuroscience 20, 5 (2000). https://doi.org/10.1523/jneurosci.20-05-j0001.2000
- Hubel and Wiesel (1962) David H Hubel and Torsten N Wiesel. 1962. Receptive fields, binocular interaction and functional architecture in the cat’s visual cortex. The Journal of physiology 160, 1 (1962), 106.
- Hung et al. (2012) Chia Chun Hung, Eric T. Carlson, and Charles E. Connor. 2012. Medial Axis Shape Coding in Macaque Inferotemporal Cortex. Neuron 74 (6 2012), 1099–1113. Issue 6. https://doi.org/10.1016/J.NEURON.2012.04.029
- Karras et al. (2019) Tero Karras, Samuli Laine, and Timo Aila. 2019. A style-based generator architecture for generative adversarial networks. In Proceedings of the IEEE conference on computer vision and pattern recognition. 4401–4410.
- Karras et al. (2020) Tero Karras, Samuli Laine, Miika Aittala, Janne Hellsten, Jaakko Lehtinen, and Timo Aila. 2020. Analyzing and improving the image quality of stylegan. In Proceedings of the IEEE/CVF Conference on Computer Vision and Pattern Recognition. 8110–8119.
- Lindsay (2020) Grace W. Lindsay. 2020. Convolutional Neural Networks as a Model of the Visual System: Past, Present, and Future. Journal of Cognitive Neuroscience (jan 2020), 1–15. https://doi.org/10.1162/jocn_a_01544 arXiv:2001.07092
- Lorch (2016) Eliana Lorch. 2016. Visualizing deep network training trajectories with pca. In ICML Workshop on Visualization for Deep Learning.
- Loshchilov (2015) Ilya Loshchilov. 2015. LM-CMA: an Alternative to L-BFGS for Large Scale Black-box Optimization. (nov 2015). arXiv:1511.00221 http://arxiv.org/abs/1511.00221
- Nguyen et al. (2016) Anh Nguyen, Alexey Dosovitskiy, Jason Yosinski, Thomas Brox, and Jeff Clune. 2016. Synthesizing the preferred inputs for neurons in neural networks via deep generator networks. In Advances in neural information processing systems. 3387–3395.
- Pasupathy and Connor (1999) A Pasupathy and C E Connor. 1999. Responses to contour features in macaque area V4. Journal of neurophysiology 82, 5 (nov 1999), 2490–502. http://www.ncbi.nlm.nih.gov/pubmed/10561421
- Ponce et al. (2019) Carlos R. Ponce, Will Xiao, Peter F. Schade, Till S. Hartmann, Gabriel Kreiman, and Margaret S. Livingstone. 2019. Evolving Images for Visual Neurons Using a Deep Generative Network Reveals Coding Principles and Neuronal Preferences. Cell 177 (5 2019), 999–1009.e10. Issue 4. https://doi.org/10.1016/J.CELL.2019.04.005
- Quiroga et al. (2005) R Quian Quiroga, Leila Reddy, Gabriel Kreiman, Christof Koch, and Itzhak Fried. 2005. Invariant visual representation by single neurons in the human brain. Nature 435, 7045 (2005), 1102–1107.
- Radford et al. (2015) Alec Radford, Luke Metz, and Soumith Chintala. 2015. Unsupervised representation learning with deep convolutional generative adversarial networks. arXiv preprint arXiv:1511.06434 (2015).
- Rapin and Teytaud (2018) J. Rapin and O. Teytaud. 2018. Nevergrad - A gradient-free optimization platform. https://GitHub.com/FacebookResearch/Nevergrad.
- Rose et al. (2021) Olivia Rose, James Johnson, Binxu Wang, and Carlos R. Ponce. 2021. Visual prototypes in the ventral stream are attuned to complexity and gaze behavior. Nature Communications 2021 12:1 12 (11 2021), 1–16. Issue 1. https://doi.org/10.1038/s41467-021-27027-8
- Schrimpf et al. (2018) Martin Schrimpf, Jonas Kubilius, Ha Hong, Najib Majaj, Rishi Rajalingham, Elias Issa, Kohitij Kar, Pouya Bashivan, Jonathan Prescott-Roy, Franziska Geiger, Kailyn Schmidt, Daniel Yamins, and James DiCarlo. 2018. Brain-Score: Which Artificial Neural Network for Object Recognition is most Brain-Like? bioRxiv (jan 2018), 407007. https://doi.org/10.1101/407007
- Srinath et al. (2021) Ramanujan Srinath, Alexandriya Emonds, Qingyang Wang, Augusto A. Lempel, Erika Dunn-Weiss, Charles E. Connor, and Kristina J. Nielsen. 2021. Early Emergence of Solid Shape Coding in Natural and Deep Network Vision. Current Biology 31 (1 2021), 51–65.e5. Issue 1. https://doi.org/10.1016/J.CUB.2020.09.076
- Wang and Ponce (2021) Binxu Wang and Carlos R. Ponce. 2021. The Geometry of Deep Generative Image Models and its Applications. (1 2021). http://arxiv.org/abs/2101.06006
- Xiao and Kreiman (2020) Will Xiao and Gabriel Kreiman. 2020. XDream: Finding preferred stimuli for visual neurons using generative networks and gradient-free optimization. PLOS Computational Biology 16, 6 (jun 2020), e1007973. https://doi.org/10.1371/JOURNAL.PCBI.1007973
- Yamane et al. (2008) Yukako Yamane, Eric T Carlson, Katherine C Bowman, Zhihong Wang, and Charles E Connor. 2008. A neural code for three-dimensional object shape in macaque inferotemporal cortex. Nature Neuroscience 11, 11 (nov 2008), 1352–1360. https://doi.org/10.1038/nn.2202
- Zhang et al. (2018) Richard Zhang, Phillip Isola, Alexei A Efros, Eli Shechtman, and Oliver Wang. 2018. The unreasonable effectiveness of deep features as a perceptual metric. In Proceedings of the IEEE conference on computer vision and pattern recognition. 586–595.
Appendix A Detailed Methods
A.1. Details of Pre-trained CNN Models
In this work, we used units from two pretrained CNN models, AlexNet and ResNet50-robust. Both were pre-trained for object recognition on ImageNet(Deng et al., 2009).
AlexNet: The architecture and weights were fetched from torchvision.modelzoo. As for layers, we used the activations from conv2-fc8 layer, the activation were non-negative (post ReLU rectification) except for fc8, which we used the logits.
ResNet50-robust: The architecture were defined in torchvision.modelzoo, with the weights fetched from https://github.com/MadryLab/robustness. We used the version with adversarial training setting: norm with strength . It has been noticed that the adversarially trained network exhibited more perceptually aligned gradients, the direct gradient descent from the units could generate impressive feature visualizations. We used this model in our benchmark since the achieved activations were harder to be affected by ”adversarial” patterns generated by the generator. For layers, we used the output of last Bottleneck block from layer1-4, namely layer1.Bottleneck2, layer2.Bottleneck3, layer3.Bottleneck5, layer4.Bottleneck2, and the linear layer before softmax.
| sum sq | df | F | Pr(¿F) | |
|---|---|---|---|---|
| optimizer | 0.14 | 2 | 3.40 | |
| layernum | 19.14 | 1 | 953.56 | |
| noiselevel | 43.56 | 1 | 2170.60 | |
| optimizer:layernum | 0.60 | 2 | 14.98 | |
| optimizer:noiselevel | 0.19 | 2 | 4.66 | |
| Residual | 63.03 | 3141 |
| net-layer | CMA | Diag | SQP | Rescaled | ES | NG | DE | 2pDE | PSO | 1+1 | TBPSA | Rand | |
|---|---|---|---|---|---|---|---|---|---|---|---|---|---|
| 0.0 | 0.478 | 0.473 | 0.345 | 0.218 | 0.325 | 0.359 | 0.347 | 0.358 | 0.222 | 0.237 | 0.209 | 0.213 | |
| 0.2 | 0.599 | 0.582 | 0.426 | 0.240 | 0.416 | 0.425 | 0.417 | 0.428 | 0.274 | 0.322 | 0.255 | 0.252 | |
| RN50-L1-Btn2 | 0.5 | 0.809 | 0.801 | 0.558 | 0.326 | 0.572 | 0.555 | 0.575 | 0.607 | 0.376 | 0.443 | 0.367 | 0.361 |
| 0.0 | 0.545 | 0.534 | 0.346 | 0.318 | 0.331 | 0.351 | 0.360 | 0.370 | 0.197 | 0.203 | 0.208 | 0.208 | |
| 0.2 | 0.637 | 0.644 | 0.401 | 0.326 | 0.410 | 0.411 | 0.392 | 0.449 | 0.220 | 0.281 | 0.249 | 0.250 | |
| RN50-L2-Btn3 | 0.5 | 0.831 | 0.825 | 0.529 | 0.442 | 0.565 | 0.574 | 0.520 | 0.606 | 0.303 | 0.409 | 0.335 | 0.338 |
| 0.0 | 0.578 | 0.567 | 0.344 | 0.174 | 0.230 | 0.283 | 0.279 | 0.301 | 0.111 | 0.121 | 0.131 | 0.128 | |
| 0.2 | 0.619 | 0.600 | 0.357 | 0.173 | 0.270 | 0.311 | 0.308 | 0.325 | 0.123 | 0.176 | 0.142 | 0.138 | |
| RN50-L3-Btn5 | 0.5 | 0.846 | 0.787 | 0.458 | 0.203 | 0.370 | 0.422 | 0.411 | 0.411 | 0.164 | 0.234 | 0.206 | 0.205 |
| 0.0 | 0.624 | 0.631 | 0.259 | 0.139 | 0.188 | 0.236 | 0.227 | 0.243 | 0.096 | 0.104 | 0.090 | 0.095 | |
| 0.2 | 0.667 | 0.656 | 0.272 | 0.124 | 0.217 | 0.238 | 0.243 | 0.258 | 0.105 | 0.134 | 0.106 | 0.106 | |
| RN50-L4-Btn2 | 0.5 | 0.724 | 0.740 | 0.267 | 0.130 | 0.279 | 0.294 | 0.316 | 0.335 | 0.137 | 0.192 | 0.149 | 0.141 |
| 0.0 | 0.721 | 0.651 | 0.311 | 0.225 | 0.190 | 0.214 | 0.238 | 0.256 | 0.090 | 0.096 | 0.093 | 0.095 | |
| 0.2 | 0.664 | 0.678 | 0.336 | 0.151 | 0.218 | 0.234 | 0.242 | 0.252 | 0.098 | 0.132 | 0.108 | 0.107 | |
| RN50-fc | 0.5 | 0.760 | 0.753 | 0.351 | 0.163 | 0.292 | 0.286 | 0.304 | 0.324 | 0.135 | 0.171 | 0.139 | 0.144 |
| 0.0 | 0.592 | 0.585 | 0.254 | 0.100 | 0.236 | 0.317 | 0.324 | 0.338 | 0.087 | 0.135 | 0.075 | 0.081 | |
| 0.2 | 0.643 | 0.657 | 0.278 | 0.080 | 0.284 | 0.387 | 0.356 | 0.371 | 0.096 | 0.181 | 0.086 | 0.087 | |
| Alex-conv2 | 0.5 | 0.792 | 0.751 | 0.331 | 0.093 | 0.374 | 0.421 | 0.438 | 0.423 | 0.106 | 0.242 | 0.107 | 0.112 |
| 0.0 | 0.658 | 0.657 | 0.327 | 0.125 | 0.214 | 0.306 | 0.310 | 0.298 | 0.083 | 0.092 | 0.078 | 0.075 | |
| 0.2 | 0.689 | 0.697 | 0.296 | 0.100 | 0.245 | 0.298 | 0.316 | 0.307 | 0.083 | 0.140 | 0.084 | 0.080 | |
| Alex-conv3 | 0.5 | 0.822 | 0.762 | 0.314 | 0.112 | 0.336 | 0.376 | 0.370 | 0.367 | 0.110 | 0.184 | 0.106 | 0.106 |
| 0.0 | 0.710 | 0.661 | 0.342 | 0.014 | 0.186 | 0.259 | 0.271 | 0.267 | 0.059 | 0.073 | 0.067 | 0.064 | |
| 0.2 | 0.676 | 0.656 | 0.362 | 0.012 | 0.227 | 0.286 | 0.262 | 0.267 | 0.068 | 0.113 | 0.072 | 0.072 | |
| Alex-conv5 | 0.5 | 0.798 | 0.764 | 0.438 | 0.018 | 0.295 | 0.346 | 0.343 | 0.335 | 0.090 | 0.163 | 0.089 | 0.094 |
| 0.0 | 0.824 | 0.722 | 0.318 | 0.117 | 0.202 | 0.259 | 0.277 | 0.276 | 0.086 | 0.121 | 0.084 | 0.082 | |
| 0.2 | 0.688 | 0.617 | 0.324 | 0.080 | 0.242 | 0.273 | 0.281 | 0.277 | 0.097 | 0.159 | 0.093 | 0.091 | |
| Alex-fc7 | 0.5 | 0.749 | 0.739 | 0.354 | 0.098 | 0.327 | 0.381 | 0.351 | 0.377 | 0.136 | 0.219 | 0.126 | 0.122 |
| 0.0 | 0.814 | 0.768 | 0.334 | 0.199 | 0.173 | 0.224 | 0.223 | 0.228 | 0.069 | 0.089 | 0.089 | 0.087 | |
| 0.2 | 0.680 | 0.672 | 0.351 | 0.137 | 0.205 | 0.221 | 0.237 | 0.243 | 0.076 | 0.117 | 0.098 | 0.099 | |
| Alex-fc8 | 0.5 | 0.744 | 0.695 | 0.382 | 0.127 | 0.262 | 0.304 | 0.295 | 0.308 | 0.100 | 0.168 | 0.140 | 0.136 |
| Average | 0.700 | 0.677 | 0.352 | 0.159 | 0.289 | 0.328 | 0.327 | 0.340 | 0.133 | 0.181 | 0.139 | 0.139 | |
| Runtime(s) RN50 | 126.1 | 45.5 | 129.6 | 133.5 | 38.9 | 69.2 | 69.5 | 39.3 | 454.3 | 38.3 | 38.5 | 38.5 | |
| Std | 38.2 | 5.9 | 34.2 | 39.6 | 2.9 | 5.4 | 5.5 | 2.9 | 31.0 | 2.7 | 2.9 | 2.8 | |
| Runtime(s) Alex | 104.5 | 23.0 | 118.6 | 107.1 | 16.2 | 48.8 | 47.9 | 16.8 | 435.4 | 16.8 | 17.5 | 17.6 | |
| Std | 30.0 | 4.5 | 67.7 | 31.1 | 1.5 | 4.8 | 4.8 | 1.6 | 36.1 | 1.6 | 2.2 | 2.2 | |


A.2. Detailed Methods for in vivo Evolution Experiments
Here we detailed the method by which we conducted in vivo Evolution experiments, same as that in (Rose et al., 2021).
Two macaque monkeys (A,B) were used as subjects with Floating Multielectrode Array (FMA) implanted in their visual cortices, in V1/V2, V4 and posterior IT. In an electro-physiology experiments, the electric signal recorded in each electrode (i.e. channel) will be processed and the spikes were detected from it using an online spike sorting algorithm from Plexon. These spikes represented the output from a few neurons or a local population in the visual cortex.
In an in vivo session, we first performed a receptive field mapping experiment. An image was rapidly (100ms duration) showed in a grid of positions in the visual field. The spike times following the stimuli onset will be binned into a histogram, i.e. post-stimulus time histogram (PSTH). We measured the spatial extant where the image evoked neuronal responses above the baseline level. Based on the PSTH of the recorded units, we selected a responsive unit, with a well-formed receptive field as our target unit. This was the in vivo counterpart of the unit we selected in CNN in silico.
Finally, we performed the Evolution experiment. During the experiment, the images would be presented to the animal subjects on the screen in front of them, centered at the receptive field found previously; each image were presented 100ms followed by a 150ms blank screen. The spike count in ms time window after the stimulus onset was used as the score for each image . A set of 40 texture images from (Freeman and Simoncelli, 2011) were inverted and then generated from the generator ; they were used as the initial generation . After the neuronal responses to all images in a generation were recorded, the latent codes and recorded responses were sent to the optimizer, which proposed the next set of latent codes . These codes were mapped to new image samples which were showed to animal subjects again. This loop continued for 20-80 rounds until the activation saturated or the activation didn’t increase from the start. When we compared two optimizers (CMA vs GA in Sec. 2.3), we ran them in parallel, i.e. interleaving the images that were proposed by the two optimizers. This ensured that the performance difference of the two optimizers were not due to change in signal quality or in electrode position.


Appendix B Geometry of the Generative Image Manifold
As showed in (Wang and Ponce, 2021), the deep neural network image generators usually have a highly anisotropic latent space. We visualized it in Fig. B.1 B,C. When travelling the same distance along an eigenvector, it induced much larger perceptual change in the image when the eigenvalue was larger; and eigenvectors like the rank 1000 one (Fig. B.1B) merely changed the image in the range tested. Thus these lower eigenvectors formed an effective ”null space” where the input was not meaningful to the generated images or the activation of the units or neuron. In later development of optimization algorithms (Wang and Ponce, 2021), we projected out the lower eigen-dimensions and only optimize the top eigen-dimensions of the generator. This could reduce the search dimensionality to around 500d.
As for the spherical geometry of the generative image mapping , it can be seen from Fig. B.1, scaling the latent vectors will majorly change the contrast instead of content of the generated image. This made angular distance relevance to our generator. However, unlike anisotropy, this linearity of is not a general property of generators. For other image generators such as BigGAN, StyleGAN (Brock et al., 2018; Karras et al., 2019; Karras et al., 2020), scaling the latent vector will not result in a scaling in pixel space: the image content will also change. We suggest that for these generator spaces, the code norm should not be fixed but should be varied and explored during optimization. So when developing optimizers in those latent spaces, as code norm increases automatically for CMA type algorithm due to diffusion, unconstrained evolution will bias the generated image towards those images with larger code norms.

Appendix C Geometry of the Tuning Function Landscape
The geometry of the latent space is important for the effectiveness of optimization algorithms. More important is the geometry of the objective function in this space. As a foundation, we characterized the geometry esp. curvature of the tuning functions of in silico units. Recall the tuning function of unit in the image space , and the image generative map . The effective function to be optimized in our problem was their composition , we measured its curvature by computing the Hessian spectra of . Intuitively, this eigenvalue represented the sharpness of tuning along the eigenvector in the latent space: a larger eigenvalue corresponds to a sharper tuning and a smaller eigenvalue corresponds to a broader tuning.
We selected 5 units from each of the 8 layers of AlexNet, and then searched for a local maximum for each unit using CholeskyCMAES optimizer. Next, we calculated the eigendecomposition of the Hessian evaluated at the local optima. We borrowed the technique from (Wang and Ponce, 2021): we represented the Hessian matrix implicitly by constructing a Hessian vector product (HVP) operator, and then applied Lanczos algorithm on this linear operator to extract the top 2000 eigen-pairs with the largest absolute eigenvalues. We examined the absolute eigen spectra, normalized by the largest absolute eigenvalue. This was reasonable since the overall scale of eigenvalues was related to the scale of activation of the unit, which differed from layer to layer.
We found that all the spectra were highly ”ill-conditioned” spanning eigenvalues of 4 to 9 orders of magnitude. This was consistent with the findings in (Wang and Ponce, 2021). The image generative network is already a highly ill-conditioned mapping, such that some latent dimensions affects the image much more than other dimensions. Since the tuning function in the latent space is a composite of and , the Jacobians of the two mappings multiply, so it inherited this ill-condition of the generative map.
More interestingly, as we compared the spectra of tuning landscapes across layers, we found that the spectra decayed rapidly for units in conv1 and decayed slower going up the hierarchy from conv2 to conv5, and became much slower for units in fully connected layers fc6-fc8 (Fig. C.1). We found similar spectral result when we evaluated the Hessian at random vectors instead of the peaks found by optimizers , confirming that this was a general phenomenon of the landscape. Though we noted that, the spectra of fc layer units precipitated sometimes, presumably because the unit was not active enough.
We interpreted this as units in early convolutional layers were tuned for very few dimensions in the latent space, and they were relatively invariant for a large subspace. In contrast, the units deeper in the hierarchy were tuned for a larger dimensional space, and were selective for more specific combination of features.
This observation was relevant to the performance of optimizers with different covariance update rules (Tab. 1). For units in earlier conv layers (e.g. conv1-5), there was a large invariant subspace, so the peaks of optimization were easy to find, so optimizers don’t need to find or model the exact tuning axis. In contrast, for units that tuned for hundreds-thousands of dimensions (fc6-8) all these axes need to be be jointly optimized to achieve the highest activation. Because of this, we reasoned that the diagonal scaling of covariance matrix may not work well in the deeper layers like fc6-8. This could be one explanation for why DiagonalCMA perform better than CMA in earlier layers, but not as well in deeper layers (Tab. A.1).


Appendix D Additional Analysis
D.1. Dimensionality of the Collection of Evolution Trajectories
We tested if the collection of evolution trajectories exhibited a lower dimensionality than shuffled controls. We collected the evolution trajectories of runs, across all noise level and layers and their PC structure. Since we observed that the mean trajectories could be well represented by their top PCs, we represented each search trajectory by a single vector, evolution direction . We computed this direction by projecting the mean latent code of final generation onto the top 5 PCs space (which explained over 88% of the variance of the mean trajectory). We shuffled the entries of these vectors to form a control collection of trajectories , preserving their vector norms. We shuffled 500 times to establish statistic significance.
Generally the collection of evolution directions were not low dimensional, with top dimensions accounting for only % of variance (Fig. A.7 A). But comparing to the shuffled counterparts, the evolution trajectories resided in a (slightly) lower dimensional space: The first 7 singular values were larger than the shuffled counterpart (, Fig. A.7 A). This signature suggested that the search trajectories exhibited some common lower dimensional structure.


D.2. PCA of Evolution Trajectory Formed by All Codes also Exhibited Sinusoidal Structure
In addition to the analysis we did to the mean search trajectory as in Sec. 3.2, we considered how individual latent codes sampled during Evolution fit into the global geometry of the trajectory. We stacked all the latent codes sampled by the CholeskyCMA during Evolution into a -by- matrix () and applied PCA to decompose it. We found that the main structure of the search trajectory remained intact: the codes projected onto top principal axes were still sinusoidal curves but with dispersion. We compared the PC vectors computed from all latent codes, and those from the mean trajectory by calculating their the inner product or cosine angles. We found that the top 30 PC vectors of two basis were matched to a high degree: 28 PC vectors of the mean trajectory had cosine angle ¿ 0.8 with the PC vector of the same rank for all latent codes (Fig. D.1 C). This showed that the global structure of all sampled codes coincided with the mean search trajectory, while the individual codes contributed to local variability around the mean search trajectory.
D.3. 2D PC Projections of Evolution Trajectory were Lissajous Curves
In our work, we consistently observed that the projection of original CMA, CholeskyCMA and Diagonal CMA evolution trajectory onto top PC axis was sinusoidal curve. One interesting way to visualize these trajectories is to project it onto 2d PC subspaces. As expected, we saw the Lissajous curve formed by the projection (Fig. D.3). We noted that the Lissajous curves decreased its amplitude towards the end (red), so the red end didn’t overlap perfectly with the blue end. This is in line with a decreasing step size during evolution. As a comparison, we also performed PCA and 2d projection with optimization trajectories driven by SphereCMA algorithm (Fig. D.4). We can see, it deviated more from the sinusoidal structure predicted by random walk, indicating a different kind of search process on the sphere.


Appendix E Definition of Subroutines used in SphereCMA
In this section we define the subroutines we used in the SphereCMA algorithm: ExpMap, RankWeight, SphereExtrapolate.
This is the famous SLERP (Spherical linear interpolation) algorithm.