High-entropy ejecta plumes in Cassiopeia A from neutrino-driven convection
Abstract
Recent multi-dimensional simulations suggest that high-entropy buoyant plumes help massive stars to explode\@citex[]2016ARNPS..66..341J,2020MNRAS.491.2715B. Outwardly protruding iron-rich fingers in the galactic supernova remnant Cassiopeia A\@citex[]2000ApJ…528L.109H,2003ApJ…597..362H are uniquely suggestive of this picture. Detecting signatures of specific elements synthesized in the high-entropy nuclear burning regime (i.e., -rich freeze out) would be among the strongest substantiating evidence. Here we report the discovery of such elements, stable Ti and Cr, at a confidence level greater than 5 in the shocked high-velocity iron-rich ejecta of Cassiopeia A. We found the observed Ti/Fe and Cr/Fe mass ratios require -rich freeze out, providing the first observational demonstration for the existence of high-entropy ejecta plumes that boosted the shock wave at explosion. The metal composition of the plumes agrees well with predictions for strongly neutrino-processed proton-rich ejecta\@citex[]2006A&A…447.1049B,2018ApJ…852…40W,2020MNRAS.491.2715B. These results support the operation of the convective supernova engine via neutrino heating in the supernova that produced Cassiopeia A.
-
1
RIKEN, 2-1 Hirosawa, Wako, Saitama 351-0198, Japan
-
2
NASA, Goddard Space Flight Center, 8800 Greenbelt Road, Greenbelt, MD 20771, USA
-
3
Department of Physics, University of Maryland Baltimore County, 1000 Hilltop Circle, Baltimore, MD 21250, USA
-
4
Department of Astronomy, Kyoto University, Kitashirakawa-Oiwake-cho, Sakyo-ku, Kyoto 606-8502, Japan
-
5
Astrophysical Big Bang Laboratory (ABBL), RIKEN Cluster for Pioneering Research, 2-1 Hirosawa, Wako, Saitama 351-0198, Japan
-
6
RIKEN Interdisciplinary Theoretical and Mathematical Science Program (iTHEMS), 2-1 Hirosawa, Wako, Saitama 351-0198, Japan
-
7
Department of Astronomy, Graduate School of Science, University of Tokyo, 7-3-1 Hongo, Bunkyo-ku, Tokyo 113-0033, Japan
-
8
Cahill Center for Astrophysics, 1216 E. California Boulevard, California Institute of Technology, Pasadena, CA 91125, USA
-
9
Department of Physics and Astronomy, Rutgers University, 136 Frelinghuysen Road, Piscataway, NJ 08854-8019, USA
∗e-mail: [email protected], [email protected]
The explosion mechanism leading to core-collapse supernovae (CC SNe) is a long-standing problem in astrophysics. The neutrino-driven explosion\@citex[]1985ApJ…295…14B is a current viable mechanism that still needs to be tested by observation. In this mechanism, the outward shock wave formed by core bounce at the proto-neutron star’s surface is boosted by strong neutrino heating. It has been recognized that convective overturn in the neutrino heating region is essential for initiating explosions\@citex[]1995ApJ…450..830B,2012PTEP.2012aA309J. The buoyant high-entropy (low density and high temperature) bubbles then push the shock farther out. Some of the biggest high-entropy bubbles can develop into Rayleigh-Taylor instabilities on a larger scale at late stages of the explosion and penetrate into the hydrogen envelope with large velocities creating iron-dominated plumes\@citex[]2003A&A…408..621K,2010ApJ…714.1371H,2017ApJ…842…13W. The presence of such high-entropy iron-dominated ejecta in SN remnants will allow us to probe details of the convective supernova engine.
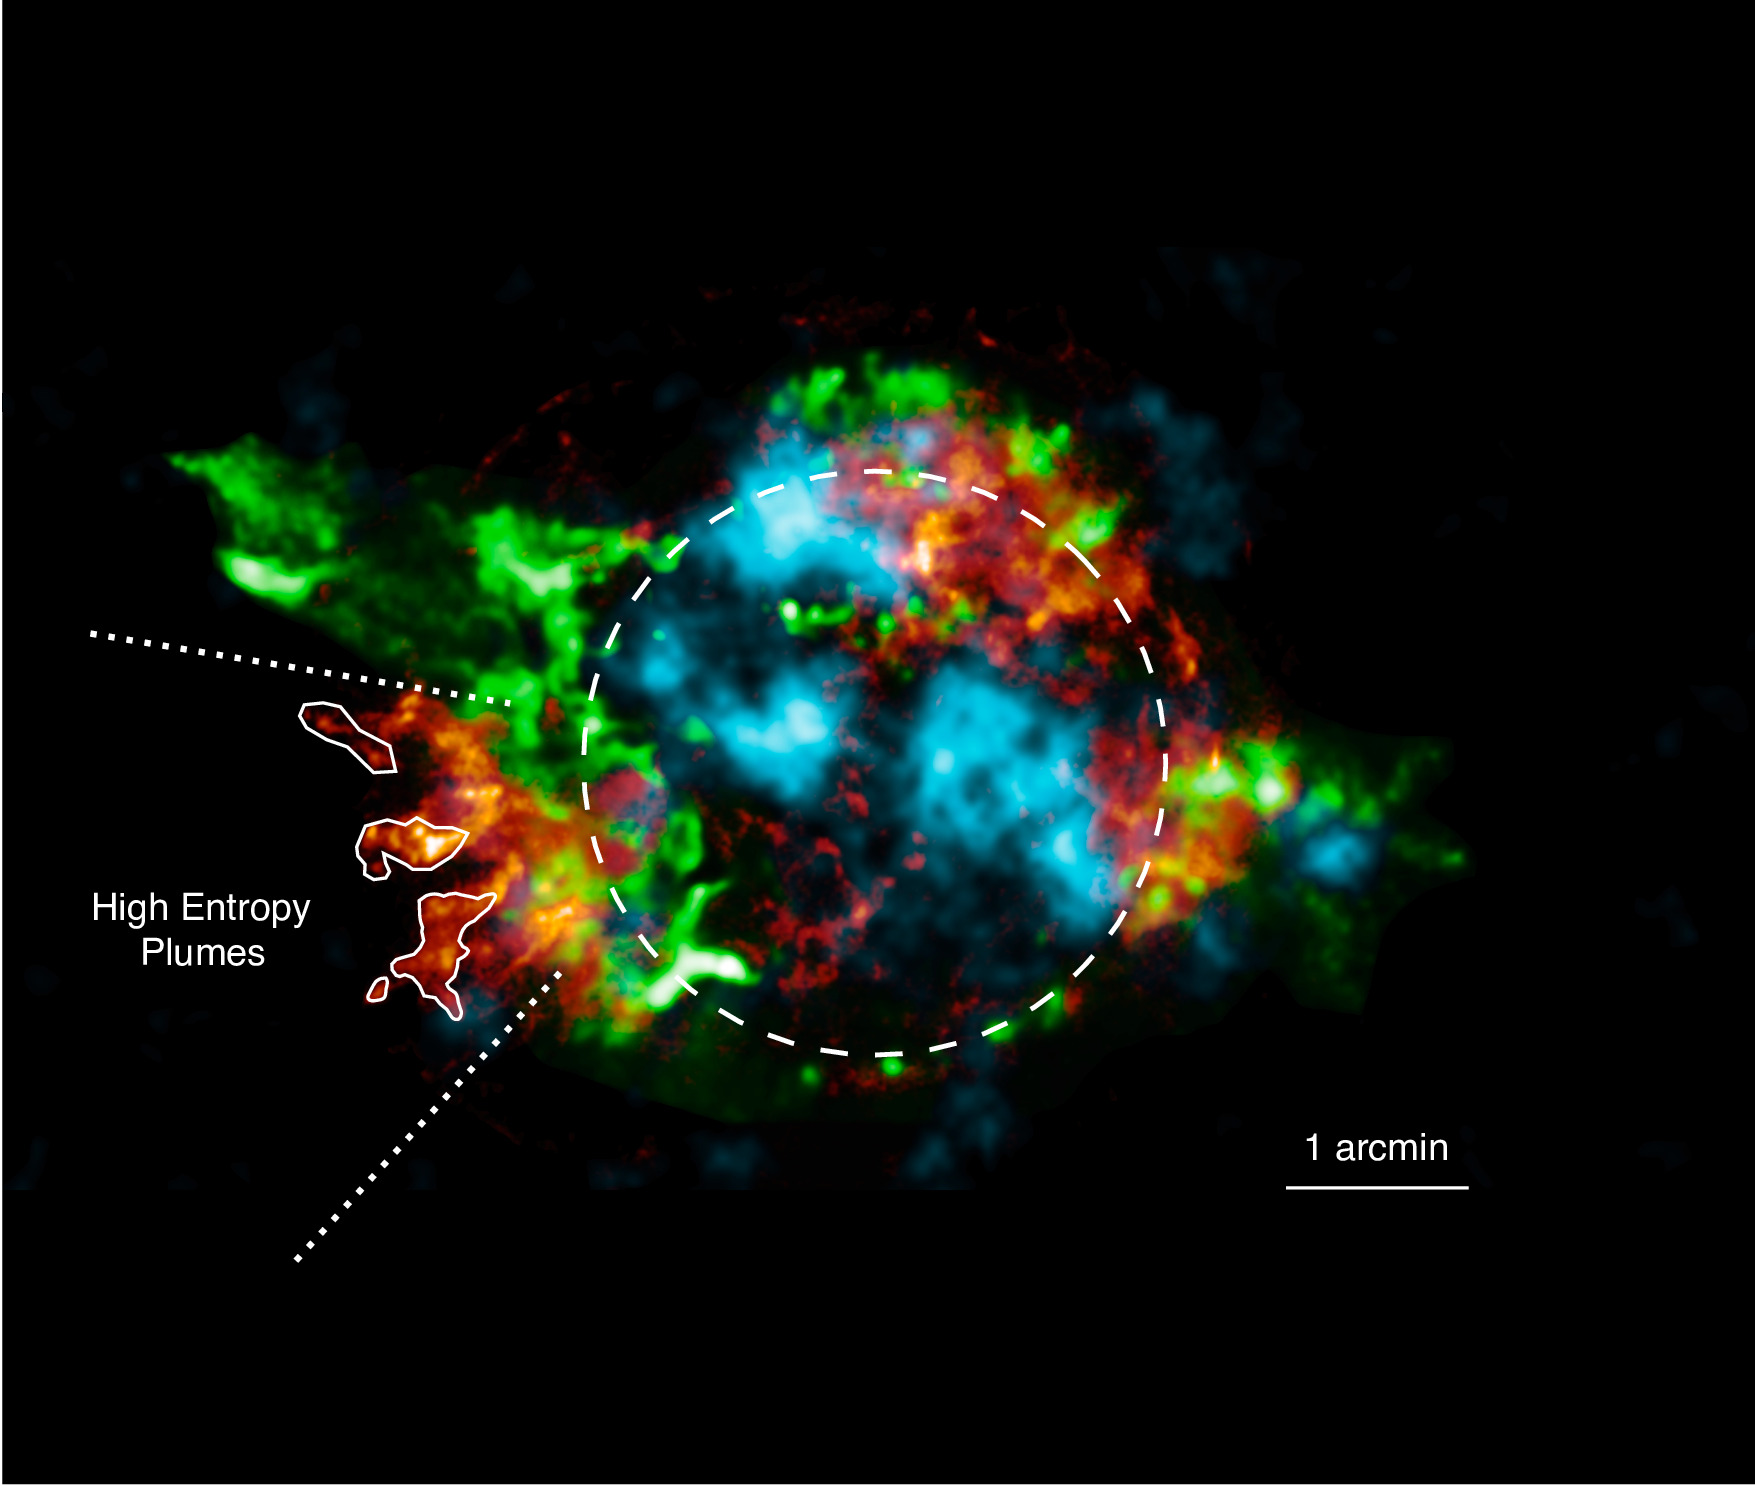
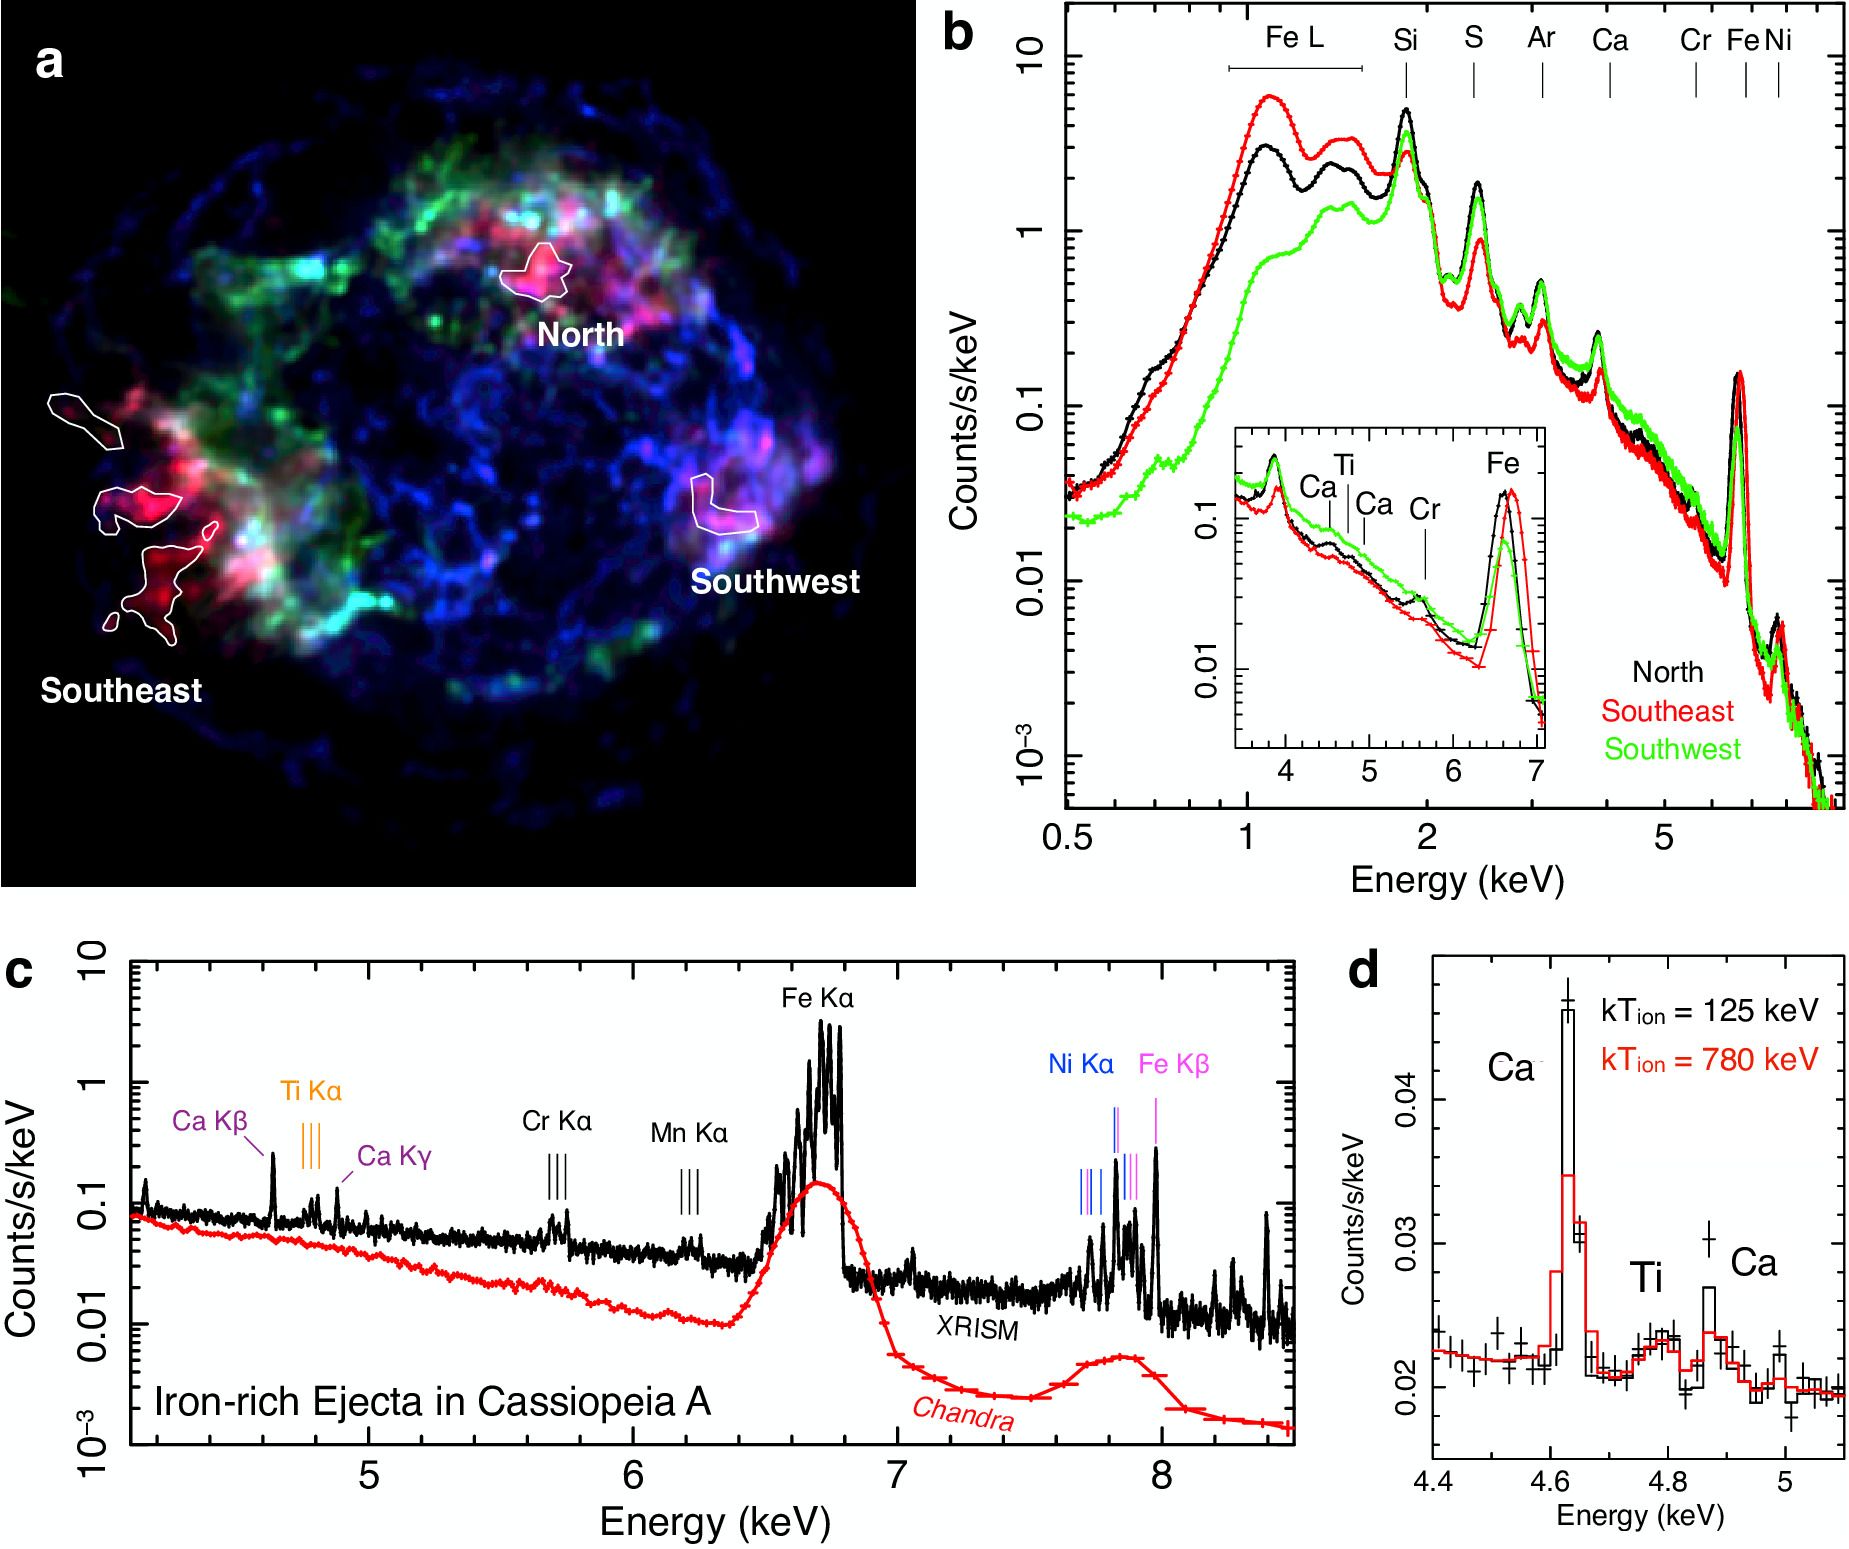
The young supernova remnant Cassiopeia A (350 yr) exhibits asymmetric and bright Fe-K distribution\@citex[]2000ApJ…528L.109H making it a unique target in our galaxy to examine details of the core-collapse explosion mechanism. In particular, the remnant shows protruding iron-rich fingers at the southeastern region\@citex[]2003ApJ…597..362H (Fig. 1). A key premise, derived from these results, is to relate the iron-rich ejecta to strong asymmetric phenomona in the central core of the explosion.
Detection of some “-rich freeze-out” products in the iron-rich ejecta would allow a direct connection with the predicted high-entropy plumes. -rich freeze out is a nuclear burning regime that controls explosive nucleosynthesis at high-entropy (especially for CC SNe). In the high-entropy nuclear burning regime, abundant particles (4He) are captured by heavy elements. Thus, the coexistence of the main burning product, iron (56Fe after decay of 56Ni), and other elements (e.g., 44Ti, 64Zn) in the same physical location would be strong evidence for the high-entropy process\@citex[]1998ApJ…492L..45N. The 44Ti decay line has been detected in Cassiopeia A\@citex[]1994A&A…284L…1I,2014Natur.506..339G,2017ApJ…834…19G, but the weak correlation in the spatial distribution between Fe and Ti has complicated the picture\@citex[]2014Natur.506..339G (Fig. 1).
In addition to the most famous -rich freeze-out product, radioactive 44Ti, other rare stable elements synthesized through subsequent captures of -particles, such as stable Ti, Cr and Zn (see Methods for the detailed isotopes), can also be used to characterize the high-entropy nuclear burning regime\@citex[]2001ApJ…555..880N,2018ApJ…852…40W. X-ray thermal emission lines from these and other elements provide direct measurement of the relative element compositions within a specific parcel of shocked plasma. This is indeed impossible with the -ray lines from 44Ti, since there are no similar detectable lines arising from other species via the same emission mechanism. In this letter, we report the discovery of -rich freeze-out products, namely stable titanium and chromium, from the iron-rich ejecta of Cassiopeia A.
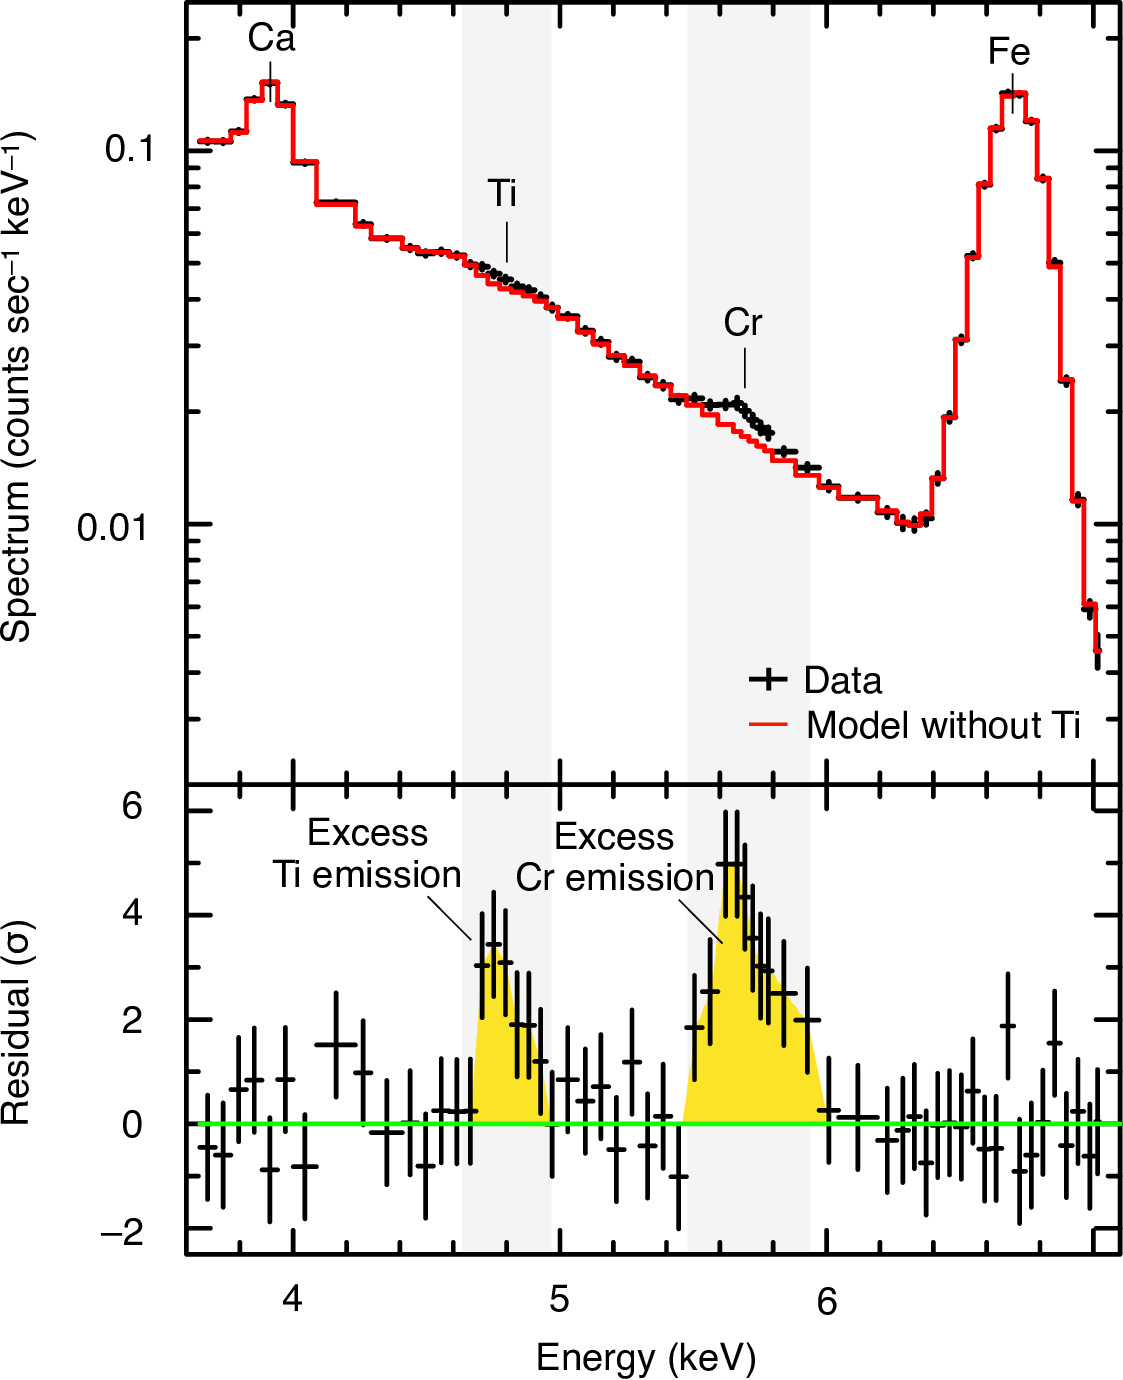
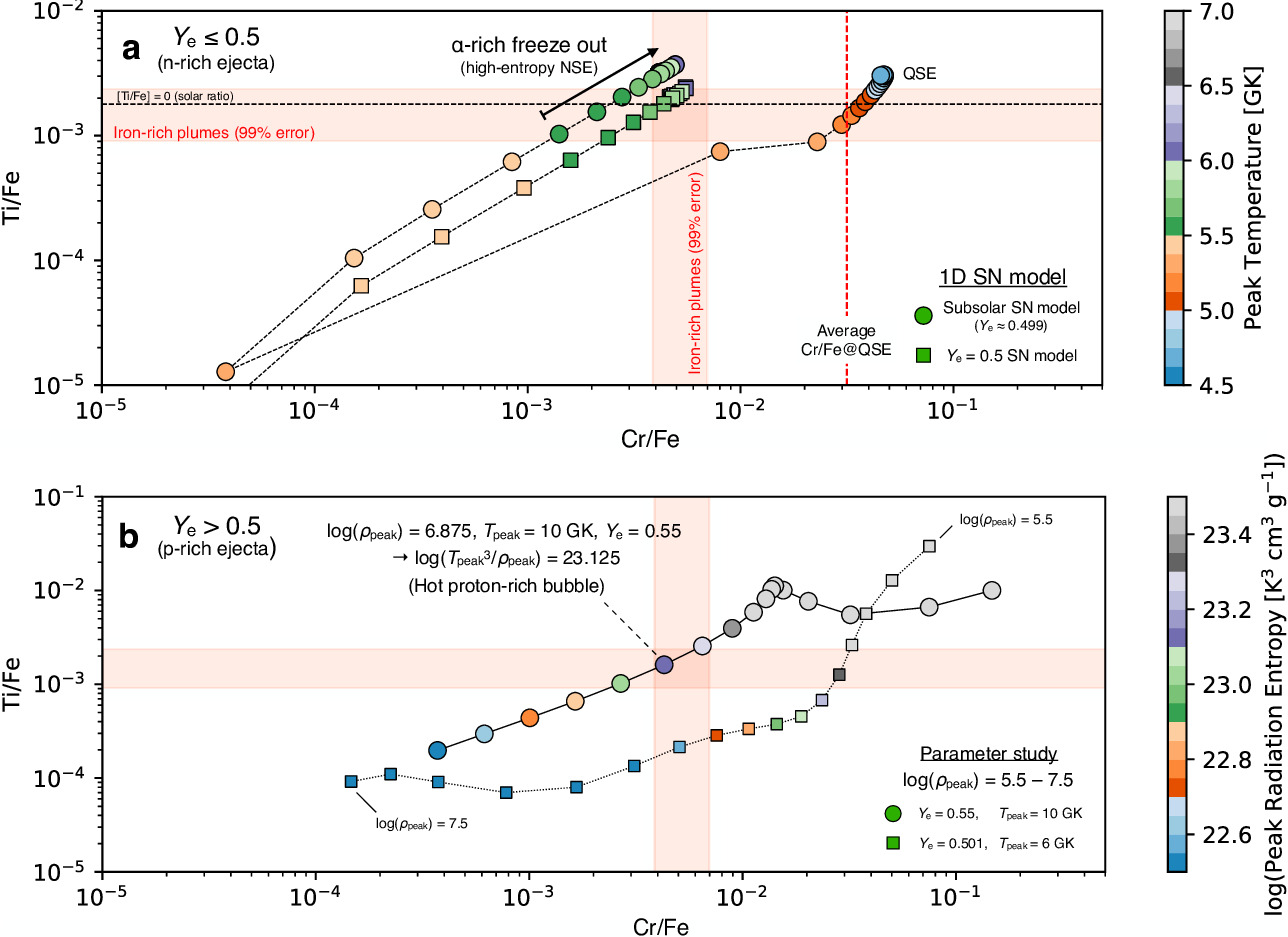
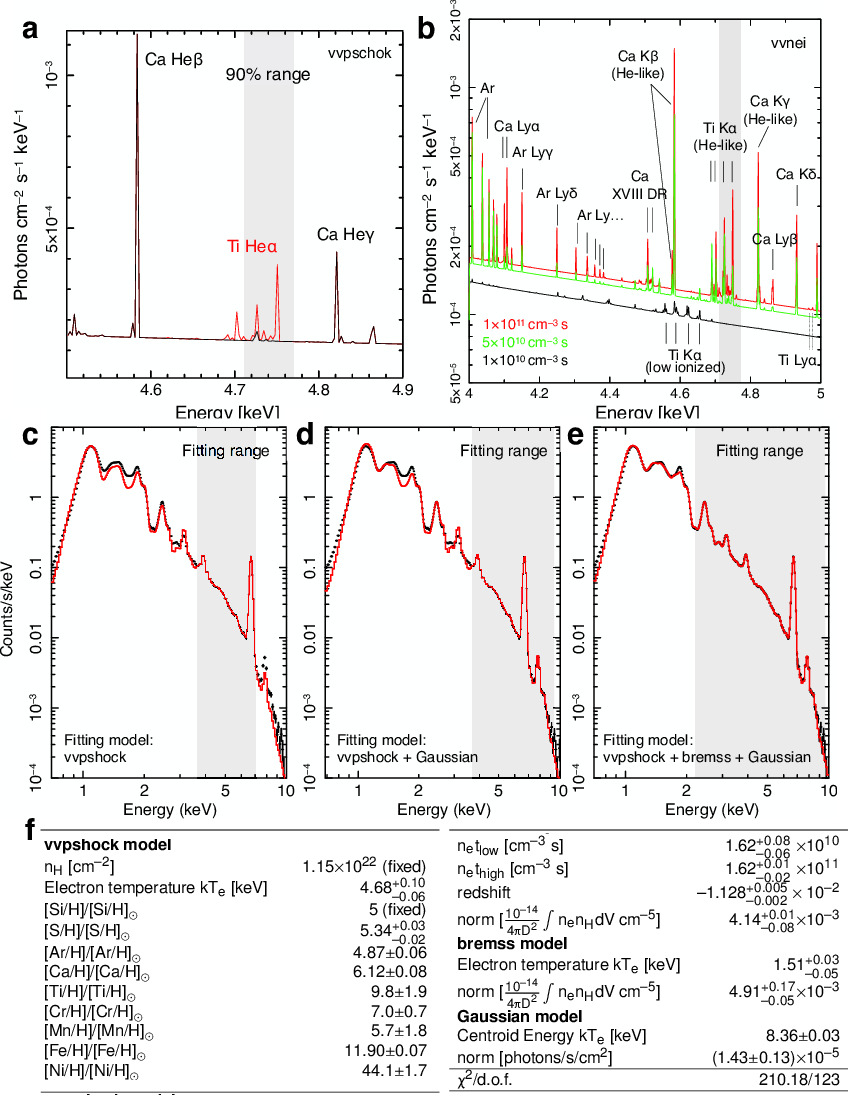
We find large residuals from the reference model spectrum around 4.7–4.8 keV and 5.6–5.8 keV in the southeastern iron-rich ejecta region using Chandra (Fig. 2), which can be explained only by K emission from He-like Ti and Cr ions. Using an ionizing plasma model that includes these lines, we find that the spectrum is well fitted while the residual features are eliminated (see Methods). We compute observed mass ratios of Ti/Fe = 0.09–0.24% and Cr/Fe = 0.39–0.70% (these are 99% confidence level ranges) in this region. These mass ratios require the yields of Fe-peak elements produced by -rich freeze out process (Fig. 3a, Method). There exists some contamination from unrelated Si-rich ejecta within the selected region, but it is negligible in deriving the Ti and Cr abundances (Methods). While stable Ti and Cr are produced at both the -rich freeze-out and lower-temperature quasi-equilibrium (QSE) layers, the low Cr/Fe ratio rules out an origin in the QSE layer (Fig. 3a). Thus, we conclude that the iron-rich fingers were produced at the high-entropy nuclear burning region.
The mass ratios among the -rich freeze-out elements are specified by only a few parameters: the lepton (electron) fraction (the average electron number per baryon), the peak density, the peak temperature, the rate at which the temperature/density change and the freezeout timescale\@citex[]1973ApJS…26..231W,2020ApJ…895…82V. This means, in principle, that the observed mass ratios can provide estimates of key physical parameters (i.e., the peak radiation entropy, and the lepton fraction, ) of the convective supernova engine. In fact, some recent simulations predict that strongly neutrino-heated plumes are high-entropy and proton-rich\@citex[]2006A&A…447.1049B,2018ApJ…852…40W,2020MNRAS.491.2715B.
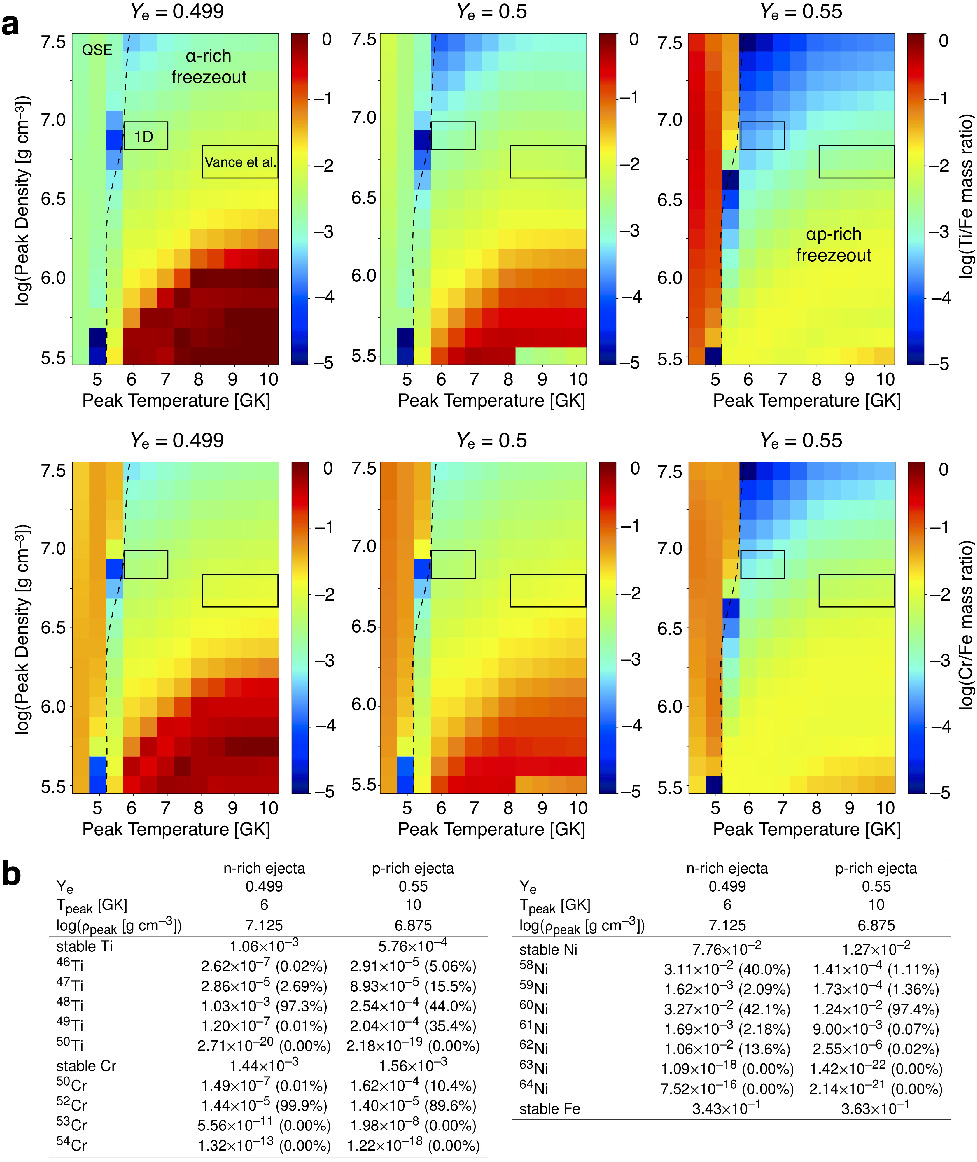
In Fig. 3b, we show the nucleosynthetic outputs for an extremely hot ( 10 GK) burning zone with 0.5 that can be achieved only in such neutrino-heated plumes (Methods). We find that the high-entropy (log( [K3 cm3 g-1]) 23) and proton-rich ( 0.55) environment can reproduce the observed mass ratios very well. These physical parameters are very similar to those of hot plumes in multi-dimensional simulations\@citex[]2018ApJ…852…40W,2020MNRAS.491.2715B,2020ApJ…895…82V. In another possible scenario, we can also explain the mass ratios with the material immediately above the hot plumes that is characterized by lower entropy and higher density ( 6 GK, 107 g cm-3, log() 22.3) than the hot plumes themselves. In this case, the lepton fraction needs to be modified to be 0.5 (see curves with square points in Fig. 3a). Such conditions are found in recent neutrino-driven SN simulations\@citex[]2020MNRAS.491.2715B where the neutrino exposure is key to changing the lepton fraction from the original stellar value ( 0.5). Both scenarios are the direct consequence of the neutrino-driven convective engine. Distinguishing the two scenarios further is not straightforward, but the first scenario, i.e., the nucleosynthesis products within the hot plumes, is preferred; a drawback of the second scenario is that the Mn/Fe ratio does not support the modification, while it does agree well with the proton-rich case (Methods). Other elements such as Ni that are sensitive to the value will become useful in the near future with improved X-ray detector technology (Methods).
Based on Doppler velocity and proper motion measurements, the total space velocity of the iron-rich ejecta is estimated to be 4,000 km s-1. In multi-dimensional simulations\@citex[]2003A&A…408..621K,2010ApJ…714.1371H,2017ApJ…842…13W, iron-rich clumps produced by the combination of convective overturn and the growth of Rayleigh-Taylor instabilities during the explosion have maximum velocities of 4,000–5,000 km s-1. Thus, the observed kinematics of the high-entropy iron-rich ejecta agree well with theoretical predictions.
The high-entropy iron-rich plumes appear to smoothly connect with the characteristic 3D structures (i.e., bubble-like interior and outer ring-like structures) of the ejecta in Cassiopeia A\@citex[]2013ApJ…772..134M,2015Sci…347..526M. Recent multi-dimensional simulations of the remnant formation based on a neutrino-driven SN explosion model\@citex[]2017ApJ…842…13W,2021A&A…645A..66O demonstrated that these observational characteristics of the remnant can be naturally explained by convective overturning in the neutrino-heating layer and the standing accretion shock instability. Especially, the simulated large cavities along the direction of propagation of the iron-rich plumes bear a remarkable resemblance to the structure around the southeastern iron-rich region in Cassiopeia A. Thus our results on the iron-rich plumes and their proposed formation process agree well with existing evidence from multi-wave band data of the global structure of the remnant interior.
While the detection of 44Ti (a representative isotope produced in -rich freeze out) has been reported, the poor spatial correlation between the 44Ti and iron-rich X-ray ejecta has been puzzling\@citex[]2014Natur.506..339G (Fig. 1). A possible explanation is that most of the iron processed by the -rich freeze out has not yet been heated to X-ray-emitting temperatures by the reverse shock. In addition, NuSTAR’s sensitivity to blue-shifted 44Ti lines is worse due to an instrumental feature in the mirror reflectivity (Pt 78.4 keV K-edge), hence only upper limits\@citex[]2017ApJ…834…19G could be set on the 44Ti emission in the blue-shifted iron-rich regions\@citex[]2002A&A…381.1039W,2010ApJ…725.2038D (see Method). Our results show not only that iron and the -rich freeze out elements (Ti and Cr) indeed spatially coexist in the plumes, but also that this region lies at the outermost edge of the remnant in the southeast. Interestingly, the proton-rich ejecta we propose for the iron-rich plumes typically contains less 44Ti than in neutron-rich ejecta\@citex[]2018ApJ…852…40W and indeed our estimates of the 44Ti mass in the Fe-rich plumes falls below the NuSTAR upper limits (see Methods). The finding here supports the basic picture of the convective SN explosion mechanism, with a need of strong asymmetry, therefore shedding light on an important decades-long unresolved problem in astrophysics.
Recent Hitomi SXS observations have demonstrated that high-resolution X-ray spectroscopy with X-ray calorimeters is a powerful tool for measuring the abundances of rare elemental species\@citex[]2017Natur.551..478H. Upcoming X-ray calorimeter missions (e.g., XRISM\@citex[]2020SPIE11444E..22T, Athena\@citex[]2018SPIE10699E..1GB) will provide us a great opportunity to investigate the role of the high-entropy nuclear burning in the Universe using stable titanium (and also zinc) as a new tool.
References
- [1] Janka, H.-T., Melson, T. & Summa, A. Physics of Core-Collapse Supernovae in Three Dimensions: A Sneak Preview. Annual Review of Nuclear and Particle Science 66, 341–375 (2016). 1602.05576.
- [2] Burrows, A. et al. The overarching framework of core-collapse supernova explosions as revealed by 3D FORNAX simulations. Monthly Notices of the Royal Astronomical Society 491, 2715–2735 (2020). 1909.04152.
- [3] Hughes, J. P., Rakowski, C. E., Burrows, D. N. & Slane, P. O. Nucleosynthesis and Mixing in Cassiopeia A. The Astrophysical Journal Letters 528, L109–L113 (2000). astro-ph/9910474.
- [4] Hwang, U. & Laming, J. M. Where Was the Iron Synthesized in Cassiopeia A? The Astrophysical Journal 597, 362–373 (2003). astro-ph/0306120.
- [5] Buras, R., Rampp, M., Janka, H. T. & Kifonidis, K. Two-dimensional hydrodynamic core-collapse supernova simulations with spectral neutrino transport. I. Numerical method and results for a 15 M⊙ star. Astronomy & Astrophysics 447, 1049–1092 (2006). astro-ph/0507135.
- [6] Wanajo, S., Müller, B., Janka, H.-T. & Heger, A. Nucleosynthesis in the Innermost Ejecta of Neutrino-driven Supernova Explosions in Two Dimensions. The Astrophysical Journal 852, 40 (2018). 1701.06786.
- [7] Bethe, H. A. & Wilson, J. R. Revival of a stalled supernova shock by neutrino heating. The Astrophysical Journal 295, 14–23 (1985).
- [8] Burrows, A., Hayes, J. & Fryxell, B. A. On the Nature of Core-Collapse Supernova Explosions. The Astrophysical Journal 450, 830 (1995). astro-ph/9506061.
- [9] Janka, H.-T. et al. Core-collapse supernovae: Reflections and directions. Progress of Theoretical and Experimental Physics 2012, 01A309 (2012). 1211.1378.
- [10] Kifonidis, K., Plewa, T., Janka, H. T. & Müller, E. Non-spherical core collapse supernovae. I. Neutrino-driven convection, Rayleigh-Taylor instabilities, and the formation and propagation of metal clumps. Astronomy & Astrophysics 408, 621–649 (2003). astro-ph/0302239.
- [11] Hammer, N. J., Janka, H. T. & Müller, E. Three-dimensional Simulations of Mixing Instabilities in Supernova Explosions. The Astrophysical Journal 714, 1371–1385 (2010). 0908.3474.
- [12] Wongwathanarat, A., Janka, H.-T., Müller, E., Pllumbi, E. & Wanajo, S. Production and Distribution of 44Ti and 56Ni in a Three-dimensional Supernova Model Resembling Cassiopeia A. The Astrophysical Journal 842, 13 (2017). 1610.05643.
- [13] Nagataki, S., Hashimoto, M.-a., Sato, K., Yamada, S. & Mochizuki, Y. S. The High Ratio of 44Ti/56Ni in Cassiopeia A and the Axisymmetric Collapse-driven Supernova Explosion. The Astrophysical Journal Letters 492, L45–L48 (1998). astro-ph/9807015.
- [14] Iyudin, A. F. et al. COMPTEL observations of 44Ti gamma-ray line emission form CAS A. Astronomy & Astrophysics 284, L1–L4 (1994).
- [15] Grefenstette, B. W. et al. Asymmetries in core-collapse supernovae from maps of radioactive 44Ti in CassiopeiaA. Nature 506, 339–342 (2014). 1403.4978.
- [16] Grefenstette, B. W. et al. The Distribution of Radioactive 44Ti in Cassiopeia A. The Astrophysical Journal 834, 19 (2017). 1612.02774.
- [17] Nakamura, T. et al. Explosive Nucleosynthesis in Hypernovae. The Astrophysical Journal 555, 880–899 (2001). astro-ph/0011184.
- [18] Woosley, S. E., Arnett, W. D. & Clayton, D. D. The Explosive Burning of Oxygen and Silicon. The Astrophysical Journal Supplement 26, 231 (1973).
- [19] Vance, G. S., Young, P. A., Fryer, C. L. & Ellinger, C. I. Titanium and Iron in the Cassiopeia A Supernova Remnant. The Astrophysical Journal 895, 82 (2020). 2005.03777.
- [20] Milisavljevic, D. & Fesen, R. A. A Detailed Kinematic Map of Cassiopeia A’s Optical Main Shell and Outer High-velocity Ejecta. The Astrophysical Journal 772, 134 (2013). 1306.2310.
- [21] Milisavljevic, D. & Fesen, R. A. The bubble-like interior of the core-collapse supernova remnant Cassiopeia A. Science 347, 526–530 (2015). 1501.07283.
- [22] Orlando, S. et al. The fully developed remnant of a neutrino-driven supernova. Evolution of ejecta structure and asymmetries in SNR Cassiopeia A. Astronomy & Astrophysics 645, A66 (2021). 2009.01789.
- [23] Willingale, R., Bleeker, J. A. M., van der Heyden, K. J., Kaastra, J. S. & Vink, J. X-ray spectral imaging and Doppler mapping of Cassiopeia A. Astronomy & Astrophysics 381, 1039–1048 (2002). astro-ph/0107270.
- [24] DeLaney, T. et al. The Three-dimensional Structure of Cassiopeia A. The Astrophysical Journal 725, 2038–2058 (2010). 1011.3858.
- [25] Hitomi Collaboration et al. Solar abundance ratios of the iron-peak elements in the Perseus cluster. Nature 551, 478–480 (2017). 1711.10035.
- [26] Tashiro, M. et al. Status of x-ray imaging and spectroscopy mission (XRISM). In Society of Photo-Optical Instrumentation Engineers (SPIE) Conference Series, vol. 11444 of Society of Photo-Optical Instrumentation Engineers (SPIE) Conference Series, 1144422 (2020).
- [27] Barret, D. et al. The ATHENA X-ray Integral Field Unit (X-IFU). In SPIE proceedings, vol. 10699 of Society of Photo-Optical Instrumentation Engineers (SPIE) Conference Series, 106991G (2018). 1807.06092.
- [28] Gotthelf, E. V. et al. Chandra Detection of the Forward and Reverse Shocks in Cassiopeia A. The Astrophysical Journal Letters 552, L39–L43 (2001). astro-ph/0104161.
- [29] Anders, E. & Grevesse, N. Abundances of the elements: Meteoritic and solar. Geochimica et Cosmochimica Acta 53, 197–214 (1989).
- [30] Sato, T. et al. A Subsolar Metallicity Progenitor for Cassiopeia A, the Remnant of a Type IIb Supernova. The Astrophysical Journal 893, 49 (2020). 2003.08922.
Methods
Previous studies of the ejecta distribution in Cassiopeia A.
Cassiopeia A, as a young, nearby and bright remnant of a core-collapse supernova, is a unique object to probe the explosion mechanism of massive stars. In particular, the asymmetric ejecta distribution and kinematics in the remnant that have been supported from various observations provide an important clue to understand the asymmetry in the explosion itself. Here we summarize the characteristic ejecta distribution in the remnant investigated in previous studies in order to clarify the novelty of this research.
The high-velocity optical knots have clearly shown the asymmetric explosion in Cassiopeia A\@citex[]2001ApJS..133..161F,2006ApJ…645..283F,2016ApJ…818…17F,2001AJ….122..297T. In particular, the S-rich optical knots in the NE jet and SW counterjet regions have high velocities of 10,000 km s-1, which is a unique feature connected to the explosion mechanism. These jet-like structures are kinematically and chemically distinct from the rest of the remnant. Motivated by this structure, there have been some previous papers\@citex[]2008ApJ…677.1091W proposing a jet-induced explosion scenario to explain the NE/SW jet-like structures and the southeastern Fe-rich ejecta. However, the distribution of 44Ti\@citex[]1994A&A…284L…1I,2001ApJ…560L..79V,2006ApJ…647L..41R,2014Natur.506..339G,2017ApJ…834…19G does not support highly asymmetric bipolar explosions resulting from a fast-rotating progenitor\@citex[]2014Natur.506..339G, even though it infers (mildly) asymmetric explosion in Cassiopeia A indirectly.
The neutrino-driven convection is a key mechanism to explode stars by neutrino-driven explosion. Especially, a recent simulation succeeded to reproduce the observed SN properties well, even the explosion energy\@citex[]2020arXiv201010506B, thus observational verification of this mechanism would be timely and significant. To probe this, the Fe-rich ejecta could be a unique target. The formation process of the southeast Fe-rich ejecta\@citex[]2000ApJ…528L.109H,2000ApJ…537L.119H,2002A&A…381.1039W,2003ApJ…597..362H,2004ApJ…615L.117H has been debated until this research. Hughes et al. (2000)\@citex[]2000ApJ…528L.109H, for the first time, has proposed that the Fe-rich ejecta could be originated from the rising bubbles in the neutrino-driven convection layer\@citex[]1994ApJ…435..339H,1995ApJ…450..830B,2007PhR…442…38J,2012PTEP.2012aA309J,2021Natur.589…29B during the supernova explosion. Also, Hwang et al. (2003)\@citex[]2003ApJ…597..362H proposed a possibility that the Fe-rich ejecta were produced by -rich freezeout, through the same nucleosynthesis process with the formation of the Fe-rich region, based on the physical properties investigated by X-rays. However, the mismatch of Ti-rich and Fe-rich ejecta regions could not support the -rich freezeout origin well\@citex[]2014Natur.506..339G,2017ApJ…834…19G. Our results solve this apparent contradiction, and observationally verify the existence of the neutrino-driven convection based on the discovery of the high-entropy plumes.
The origin of the Fe-rich ejecta should be closely connected to its kinematic structure. DeLaney et al. (2010)\@citex[]2010ApJ…725.2038D argued that the Fe-rich ejecta occupies a hole in the Si-group emission and does not represent “overturning”, as previously thought\@citex[]2000ApJ…528L.109H. Instead of overturning, the authors proposed interaction with the circumstellar medium to reproduce the protruding Fe-rich ejecta. If this is the case and there is no inversion of the ejecta layers, the outermost tip of the Fe-rich ejecta should be produced by QSE (and we would see an O-burning layer on the outside of it). It would be not natural that all the outer layers (e.g. QSE, O-burning and so on) around the Fe-rich ejecta are hided only by the cross-section effect. This is in tension with the nucleosyntgetic origin of the Fe-rich ejecta we constrained in this work. However, the structure of the Fe-rich ejecta can indeed be well reproduced also by multi-dimensional simulations\@citex[]2003ApJ…598.1163M,2016ApJ…822…22O,2021A&A…645A..66O even without the CSM interaction. Especially, a recent SNR simulation\@citex[]2021A&A…645A..66O based on a neutrino-driven explosion have succeeded to reproduce naturally the characteristic ejecta structures in Cassiopeia A without any special CSM interaction. The picture here is consistent with our conclusion that the outermost tip of the southeast Fe-rich ejecta was produced by -rich freezeout. In summary, we conclude that the formation scenario of the Fe-rich ejecta with the inversion of ejecta layers during the SN explosion for Cassiopeia A is supported by all the available observational data.
The bubble-like interior observed in Cassiopeia A\@citex[]2015Sci…347..526M also provides strong evidence of turbulent mixing processes during the explosion. At optical and infrared wavelengths, arc- and ring-like structures of shocked ejecta have been observed\@citex[]1995ApJ…440..706R,1995AJ….109.2635L,2014MNRAS.441.2996A,2010ApJ…725.2038D. The bubble-like morphology revealed by near-infrared observations of unshocked ejecta smoothly connects to these structures. This internal structure indirectly supports the existence of a “Ni-bubble” effect during the explosion\@citex[]1989ApJ…341L..63A,1993ApJ…419..824L,2001ApJ…557..782B,2013ApJ…773..161O. The Ni-bubble effect has been used to explain observations of SN 1987A indicating extensive mixing of chemical species in the envelope of the progenitor star during the explosion. Early simulations of the effect were started by artificially seeding Rayleigh-Taylor instabilities (RTIs) in the mantle and envelope of the progenitor and following their evolution until shock breakout from the stellar surface\@citex[]1989ApJ…341L..63A,1991ApJ…367..619F,1990ApJ…358L..57H,1991A&A…251..505M,1991ApJ…370L..81H,1993ApJ…419..824L. More recent simulations consistently connect the seed asymmetries arising from convective flow in the neutrino-heated bubble and by the SASI during the explosion\@citex[]2003A&A…408..621K,2007PhR…442…38J,2010ApJ…714.1371H,2012PTEP.2012aA309J,2021MNRAS.tmp..147G. This is the same scenario as explaining the formation of the Fe-rich ejecta\@citex[]2000ApJ…528L.109H. Thus, the origin of the bubble-like interior in the remnant could smoothly connect with the formation process of the protruding Fe-rich ejecta and the recent simulation study supports this picture\@citex[]2021A&A…645A..66O.
As summarized above, the previous studies focused on the ejecta distribution in Cassiopeia A to tackle to the explosion mechanism. In the present work, we introduce a new dimension, namely the nucleosynthetic perspective of the high-entropy bubbles as a key ingredient of the neutrino-driven explosion. We for the first time demonstrated that the X-ray observation of the Fe-rich ejecta can provide us the mass fractions of the key elements, which allow us to probe local physical parameters (i.e. lepton fraction, peak temperature, peak density and so on) around the convective SN engine. Currently, this is the only way to measure these parameters in a SN explosion.
Chandra observations and data reduction. Cassiopeia A has been observed with Chandra ACIS-S several times since the launch\@citex[]2000ApJ…528L.109H,2011ApJ…729L..28P,2014ApJ…789..138P,2017ApJ…836..225S,2018ApJ…853…46S. We used all ACIS-S observations from 2000 to 2018, with a total exposure of 1.57 Ms. We reprocessed the event files (from level 1 to level 2) to remove pixel randomization and to correct for CCD charge transfer efficiencies using CIAO\@citex[]2006SPIE.6270E..1VF version 4.6 and CalDB 4.6.3. The bad grades were filtered out, and good time intervals were reserved.
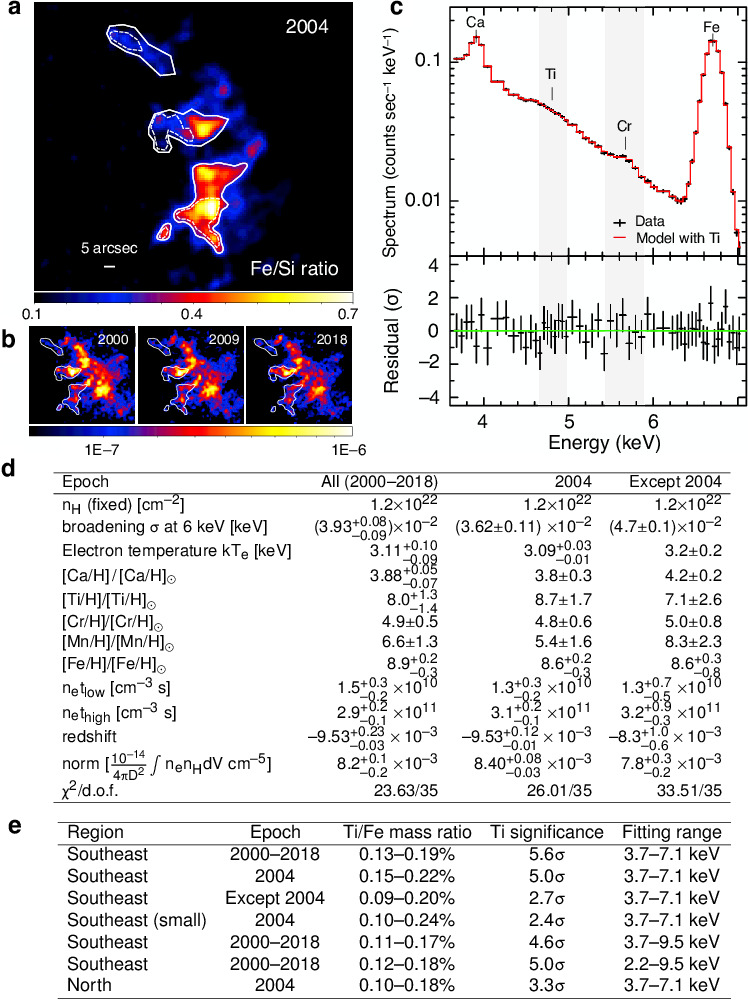
Extended Data Fig. 1a shows a Fe-K/Si-K ratio map where the white contour is the region we extracted the spectrum. In order to extract a Fe-rich spectrum, only bright regions were selected using this image. The position of the iron-rich ejecta we focused is shifting from year to year due to the bulk expansion of the material. Therefore, we carefully chose the regions for each epoch considering the shift to track the same material. The proper motions of the iron-rich structures were estimated to be 0.2′′ yr-1. With a similar shift to that measurement, we were able to correct the position of the regions well. As shown in Extended Data Fig. 1b, we could track well the entire Fe-rich structure from epoch to epoch although the shape of the structure is slightly changing.
The shape of small structures at off-axis angle is distorted by the aberrations of Wolter type I optics. This may increase uncertainty for the region selection from epoch to epoch. On the other hand, the encircled energy radii for circles enclosing 90% of the power at 6.4 keV around the Fe-rich region (the off-axis angle of 3 arcmin) is 2 arcseciiisee Figure 4.12 & 4.13 in https://cxc.harvard.edu/proposer/POG/html/chap4.html, which is much smaller than the regions we used (see Extended Data Fig. 1a). Therefore, the difference in the image distortion due to the off-axis effect from epoch to epoch can be ignored. In fact, a comparison between single epoch and multiple epoch measurements shows that the results are consistent, indicating that the region selection itself does not have a significant impact on the Ti measurements (see following sections and Extended Data Fig. 1d,e).
We also analyzed the X-ray spectrum taken from a smaller region shown in Extended Data Fig. 1a (white broken contour). We found that the change of the region boundaries does not change the Ti/Fe ratio (Extended Data Fig. 1e). On the other hand, the Ca/Fe mass ratio decreases from 1.50–1.54% to 1.07–1.20% when we use the smaller region. The decrease of Ca/Fe is interpreted as a decrease of the contamination from the Si-rich component (see also “The origin of the lighter elements in the iron-rich ejecta”). The unchanged Ti/Fe ratio implies that the Si-rich component is not the main component providing Ti. From these, we are confident that the region selection does not change our conclusion significantly.
NuSTAR observations and data reduction. In Figure 1, the same 44Ti image as in Grefenstette et al. (2017)\@citex[]2017ApJ…834…19G was used. Cassiopeia A was observed with NuSTAR during the first 18 months of the NuSTARmission with a total exposure time of 2.4 Ms. We reduced the NuSTAR data with the NuSTAR Data Analysis Software (NuSTARDAS) version 1.4.1 and NuSTAR calibration database (CALDB) version 20150316 to produce images, exposure maps, and response files for each telescope.
Modeling of X-ray spectrum. We extract the X-ray spectrum from the southeastern iron-rich structure (Fig. 2). To model it, we use an absorbed thermal plasma model with a gsmooth model that is used for modeling the lines broadened by thermal broadening and/or multiple velocity components (= phabsgsmoothvvpshock in Xspec using AtomDB version 3.0.9). We assumed that the plasma parameters (e.g., ionization state, temperature, redshift) for each element are identical. Although the column density is not sensitive to this energy band (3.7–7.1 keV), we fixed it to the typical value around this region\@citex[]2003ApJ…597..362H. The best-fit parameters are summarized in Extended Data Fig. 1d.
The residuals around 4.7–4.8 keV in Fig. 2 are very well explained by the Ti emissions of the thermal model (Extended Data Fig. 1). The main difference in the models shown in these two figures is whether titanium is included (Extended Data Fig. 1) or not (Fig. 2). The significance of the Ti detection in the thermal fitting is 5.6 ( 33.044). Even if we used only the data in 2004 (the net exposure time 980 ks), the significance level is still above 5 ( 25.422). Even if we used an ionizing plasma model with a single ionization state (NEI model), the significance level of the line detection is almost the same ( 25.219). We also analyzed all the data except 2004 (the net exposure time 590 ks) to check the consistency and again detected the Ti emissions at a 2.7 confidence level. All the Ti/Fe ratios in the different data sets are consistent with each other (see Extended Data Fig. 1d,e), which indicates the robustness of our Ti measurements.
We also performed a simple Gaussian fitting for the residual line. Here we used a zgauss model in Xspec to express the blue-shifted line. Assuming the same blue-shift velocity as in the vvpshock model (2,860 km s-1), the centroid energy of the residual line is estimated to be 4.740.03 keV (90% confidence level, ) in the rest frame, which is consistent with the K emissions from the He-like Ti ion (Extended Data Fig. 2a). We note that there is almost no bright X-ray line around this energy band in the AtomDB database, except for the titanium. For the Gaussian fitting, the significance of the line detection is almost same as that in the thermal fitting ().
We note that the energy of the He-alpha lines of Sc are 4.295 kev (resonance line) and 4.316 keV (intercombination line). This is close to the H-like Ca K line energy (4.1 keV), but it would not be a source of confusion for the detection of stable Ti. On the other hand, we would note that the uncertainty on the line emissivities (i.e. uncertainty of atomic data base) could change the estimations of mass ratios.
The narrow fitting range from 3.7 to 7.1 keV does not affect our conclusion. Even if we expanded the fitting range, we could obtain good spectral fits (reduced 2) and the Ti/Fe mass ratios are consistent with each other (Extended Data Fig. 1e). In Extended Data Fig. 2 bottom, we show the entire X-ray spectra fitted with different fitting range. In all the fittings, the entire spectra are roughly explained by the best-fit models. Here, elements in areas outside of the fitting range are fitted by eye and fixed. In Extended Data Fig. 2d, we fit the spectrum up to 9.5 keV where the Ni emissions are included. The current modeling around 8.0–8.5 keV is not accurate enough (please also see “Another strong evidence of -rich freezeout”). This is due to uncertainties of emissivities of Fe K,,,… emissions. To model a lack of these emissions, we added a Gaussian model in this fitting. In Extended Data Fig. 2e, we fit the spectrum from 2.2 to 9.5 keV where the emissions from S to Ni are included (a complete spectral modeling for the entire energy band from 0.7 to 9.5 keV is too complicated to realize for now). Even in the wide range fitting, we could obtain a good fit (reduced 1.71). The best-fit parameters are summarized in Extended Data Fig. 2f. In this case, we added a bremss model in Xspec because a low temperature component cannot be ignored\@citex[]2002A&A…381.1039W due to expanding to the lower energy band. Considering the uncertainties of handling the multi-temperature modeling and also the uncertainties of modeling around the Ni emission line, we presented only the result for the 3.7-7.1 keV band in the main text.
Estimation of the total iron/titanium mass in the iron-rich region. We estimated that the three large iron-rich structures (white contour regions) at the southeastern region have a total volume of 0.141 arcmin3 (= 0.6′0.2′0.2′ for north one + 0.6′0.3′0.3′ for middle one + 0.7′0.3′0.3′ for south one), which corresponds to 41054 cm-3 at the distance of 3.4 kpc. The emission measure, is estimated to be 1.11057 cm-3 from the fitting result (i.e., from the norm parameter in Extended Data Fig. 1d). Assuming (for fully ionized H-dominant plasma with 10% He) and [Fe/H]/[Fe/H]⊙ = 8.7, the iron mass in the structures is estimated to be 10-3 . On the other hand, the total iron mass in the southeastern region is estimated to be 0.018 in previous studies\@citex[]2017ApJ…834…19G, which is almost one order of magnitude higher than our estimation (probably it’s due to some different assumptions). Compared to the total mass of all the synthesized iron in this remnant\@citex[]2012ApJ…746..130H, the iron mass at the edge of the southeastern structures is not so large (1–10% of the entire iron ejecta). Here, the total stable titanium mass in the iron-rich region could be estimated to be 10-6–10-5 assuming Ti/Fe = 10-3.
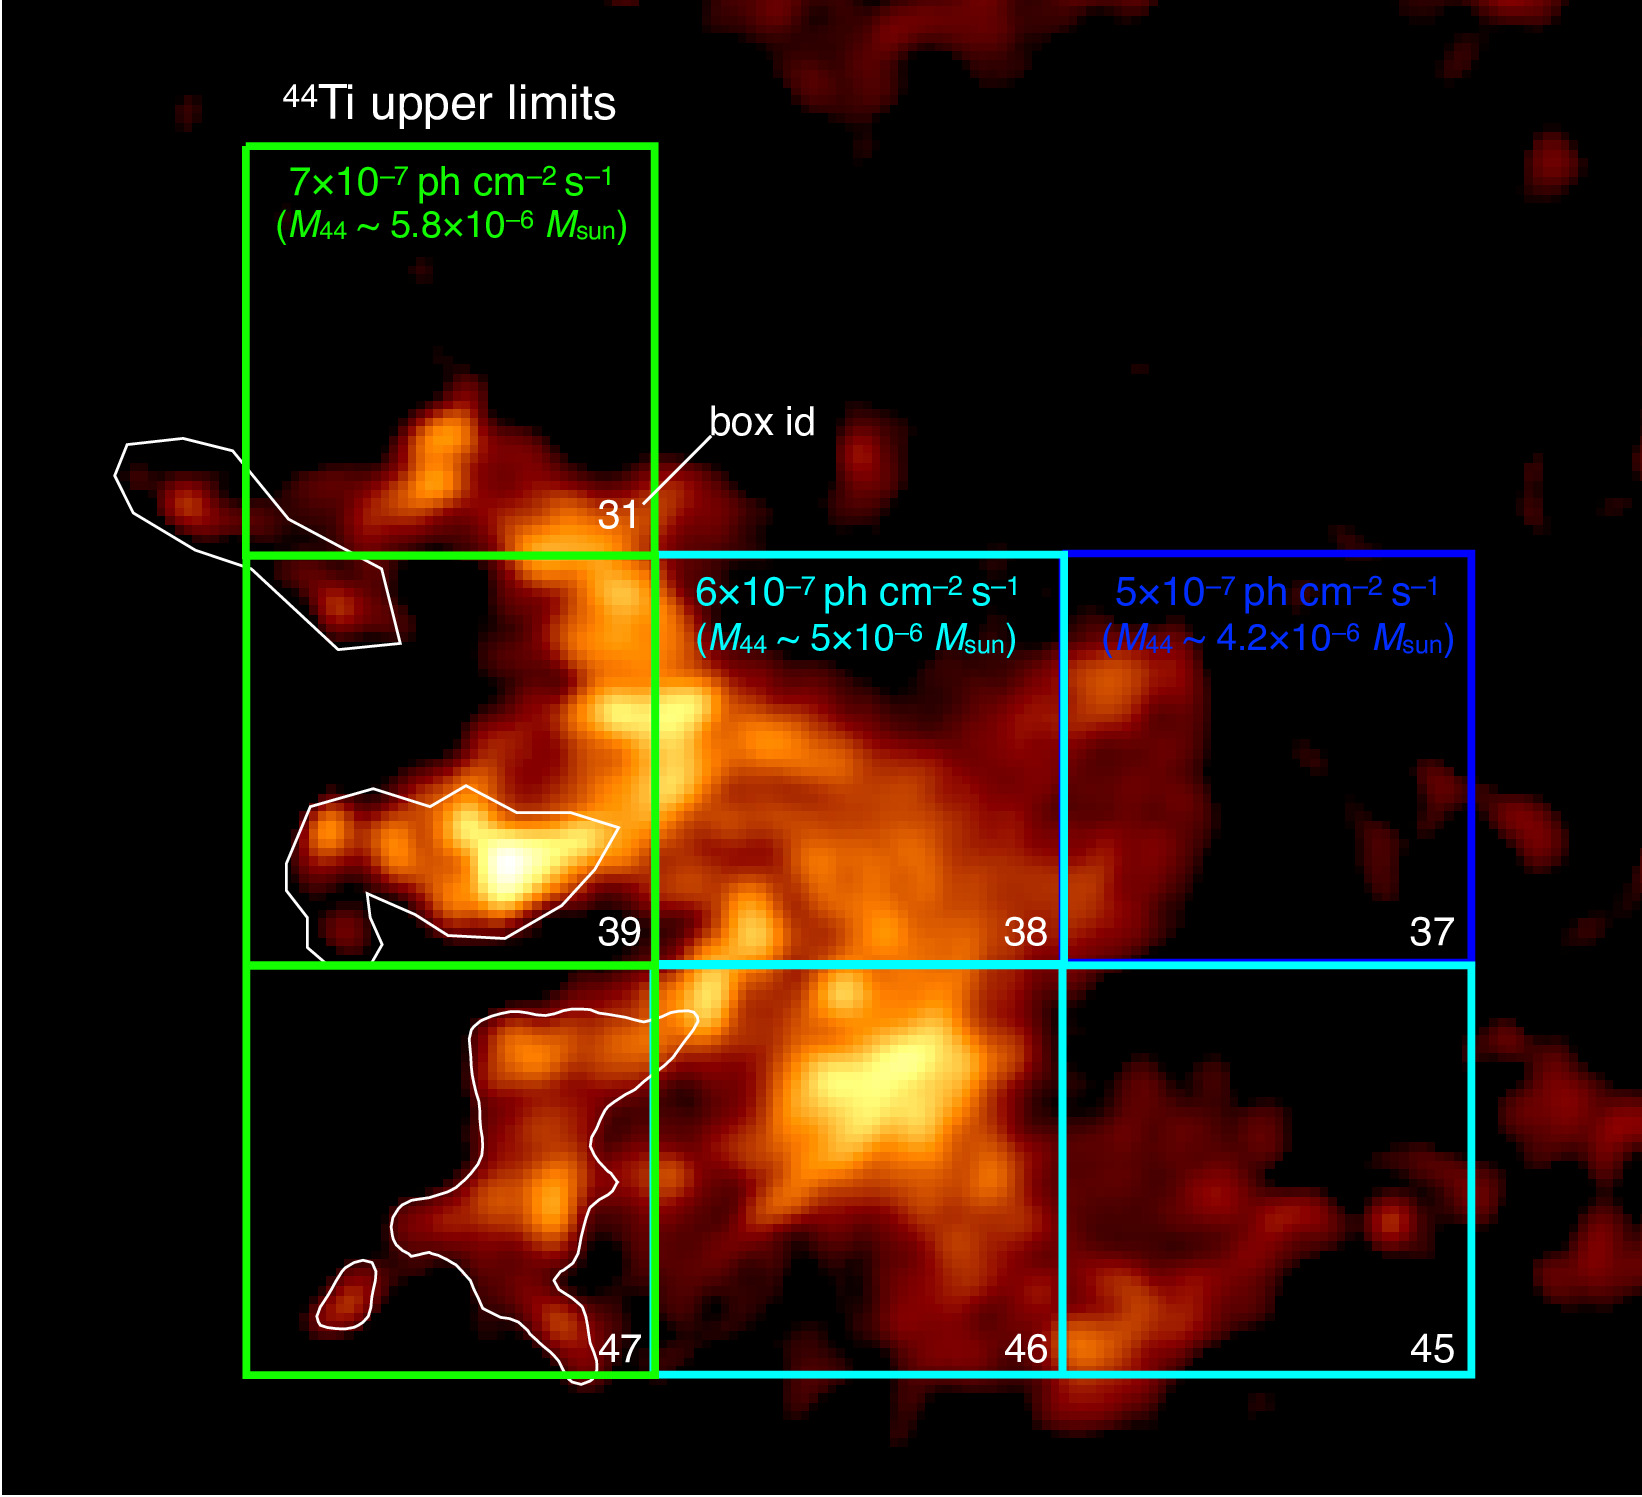
Extended Data Fig. 3 shows the 44Ti upper-limit map by NuSTAR\@citex[]2017ApJ…834…19G. Around the southeastern iron-rich regions, the upper limits show 710-7 ph cm-2 s-1 for each box region (box id: 31, 39, 47), which corresponds to 44Ti mass of 5.810-6 . Assuming the iron mass of 10-3–10-2 and the mass ratio of Ti/Fe = 10-3 and 44Ti/Ti = 0.2 (Extended Data Fig. 4), the 44Ti mass in the iron-rich region is estimated to be 210-7–210-6 , which is almost comparable or an order of magnitude lower than the NuSTAR’s upper limit. In the case of proton-rich ejecta, the synthesized amount of 44Ti is almost one order of magnitude less than this estimation\@citex[]2018ApJ…852…40W. Therefore, especially in the proton-rich case, it would be reasonable that the NuSTAR’s observations could not detect the 44Ti line significantly from this region. In addition, recent multi-dimensional simulations\@citex[]2021A&A…645A..66O,2020ApJ…895…82V showed that the mass ratio between 44Ti and 56Ni could vary by 3 orders of magnitude from region to region with an average mass ratio of 44Ti/56Ni 10-3. The regions with poor Ti production rates, such as those appearing in the multi-dimensional simulations, could also explain the undetected 44Ti in the iron-rich region.
Nucleosynthesis model calculations. We use nucleosynthesis models for core-collapse supernovae calculated in Sato et al. (2020)\@citex[]2020ApJ…893…49S. Here we calculate the evolution of a 15 star with metallicity of = 0.007 (0.5 ) from hydrogen burning until the central temperature reaches 109.9 K. The calculation is performed using a 1D stellar evolution code, HOngo Stellar Hydrodynamics Investigator (HOSHI) code\@citex[]2016MNRAS.456.1320T,2018ApJ…857..111T,2019ApJ…871..153T,2019ApJ…881…16Y. Detailed parameter sets of the stellar models are the same as Set L in Yoshida et al. (2019)\@citex[]2019ApJ…881…16Y. Nucleosynthesis of 300 isotopic species is also calculated within the stellar evolution code. The metallicity dependence of the mass-loss rate is for main-sequence stars and for yellow and red supergiants\@citex[]2013A&A…558A.103G.
The simulation of the supernova explosion is performed with a PPM hydrodynamics code\@citex[]1984JCoPh..54..174C,2005ApJ…619..427U, assuming a spherically symmetric explosion. The explosion energy is set to be 3 erg. The location of the mass cut is determined so that the ejected 56Ni mass is 0.07 . After the supernova explosion simulations, the explosive nucleosynthesis calculations are performed in a postprocessing step. Radioactive decays in the supernova ejecta after 350 yr are also taken into account.
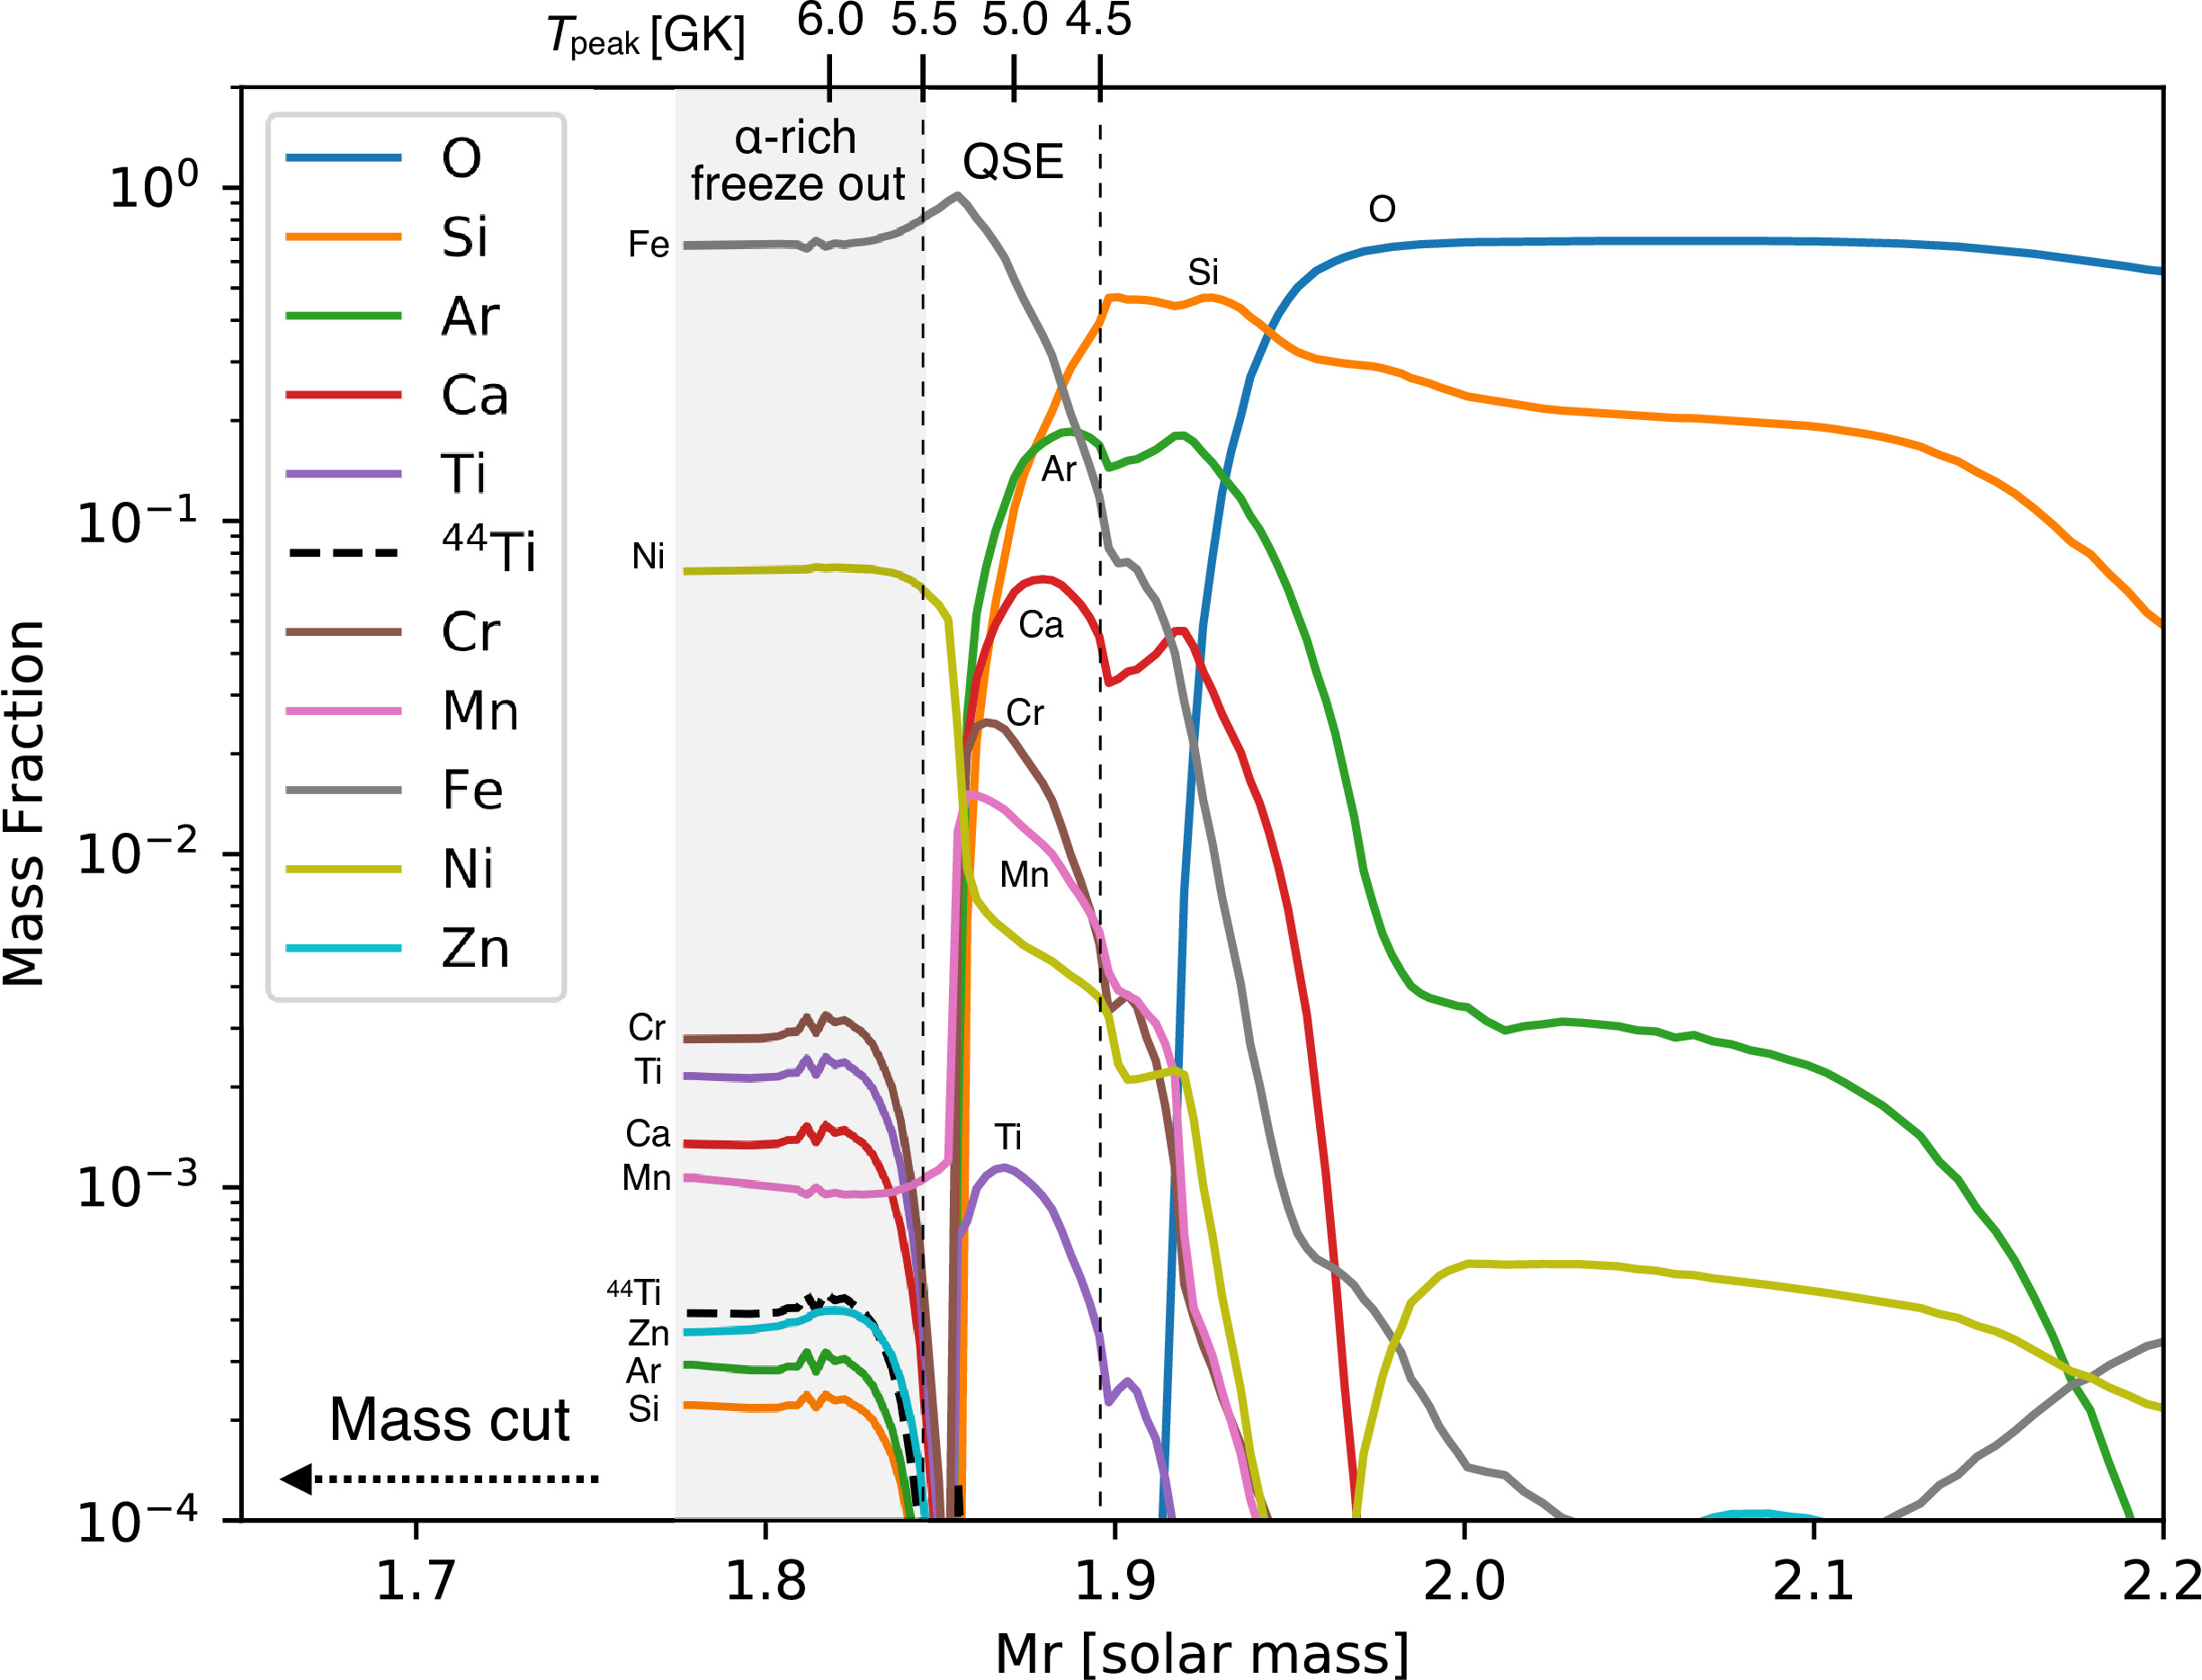
As shown in Extended Data Fig. 4, the region where Fe (though 56Ni) is abundantly produced is divided into two layers; the alpha-rich freezeout as characterized by the higher temperature (or entropy), producing mainly Fe-peak elements, and the incomplete QSE burning as characterized by the lower temperature, producing intermediate mass elements abundantly. In the one-dimensional model, the alpha-rich freezeout region is located in the deepest layer since higher entropy is realized in the inner layer in the one-dimensional model. However, this is not necessarily the case in realistic three-dimensional simulations\@citex[]2016ARNPS..66..341J,2020MNRAS.491.2715B, since the penetration of the the high-entropy bubbles into the outer layers is essential to initiate the explosion.
Ti has 5 stable isotopes of which 48Ti is the most abundant comprising 74% of titanium atoms in terrestrial samples. In our SN model with 0.5, 90% of all Ti is 48Ti. The isotope of Ti most well known to supernova researchers is 44Ti, which has a half life of 60 years, decaying to 44Sc by electron capture (and then to 44Ca by beta decay). In our models, all Ti isotopes are contained in “Ti”. The radioactive element 44Ti is also included, but stable Ti is dominant due to the decay for 350 yr. We summarized the stable isotopes of Ti, Cr and Ni for neutron-rich and proton-rich ejecta in Extended Data Fig. 5b. The mass fractions among isotopes are different between them. In the case of Ti, the synthesized amount of 46,47,49Ti drastically increases in the proton-rich ejecta. The dependence of each isotope can be checked in Figure 10 of Wanajo et al. (2018)\@citex[]2018ApJ…852…40W.
Parameter studies of nucleosynthetic outputs in the peak temperature-density plane. In the case of 1D SN calculations, it is limited to express an extreme environment in the hot bubbles produced by neutrino heating. The 1D SN calculations as described above deal only with the regions above the hot plumes, which are heated by the shock wave produced by the action of the hot plumes. To express the high entropy environment within the hot plumes seen in multi-dimensional models, another approach is necessary. In order to discuss the element composition in the hot bubbles, a parameter study beyond the parameter range in 1D SN models would be suitable. Magkotsios et al. (2010)\@citex[]2010ApJS..191…66M have investigated the sensitivity of 44Ti and 56Ni synthesis for both dependencies over an extended parameter space. Here, we do a similar approach for investigating the yield of stable Ti and Cr, which would be useful for discussing the nucleosynthesis that cannot be expressed with the 1D SN models. The data in Fig. 3b were made from nucleosynthesis calculations we introduce here.
Extended Data Fig. 5 shows the Ti/Fe and Cr/Fe mass ratios in the peak temperature-density plane. We can clearly see that both the mass ratios increase as the peak radiation entropy increases. This trend is the same as 44Ti\@citex[]2010ApJS..191…66M, therefore these elements can be an alternative tool for probing the high-entropy process. In computing this, we need to specify the thermodynamic trajectory for the hot bubbles. Since the time scale for the expansion and cooling there (i.e., the rate of the change in the temperature and density) should be similar to the innermost zone seen in the 1D simulation, we first extrapolate the thermodynamic trajectory from the innermost zones of the 1D model to match the peak temperature to a given peak temperature for the hot plumes. Then, we multiply a constant value to the density trajectory to match to the density condition for the hot plumes. Radioactive decays in the supernova ejecta after 350 yr are also taken into account.
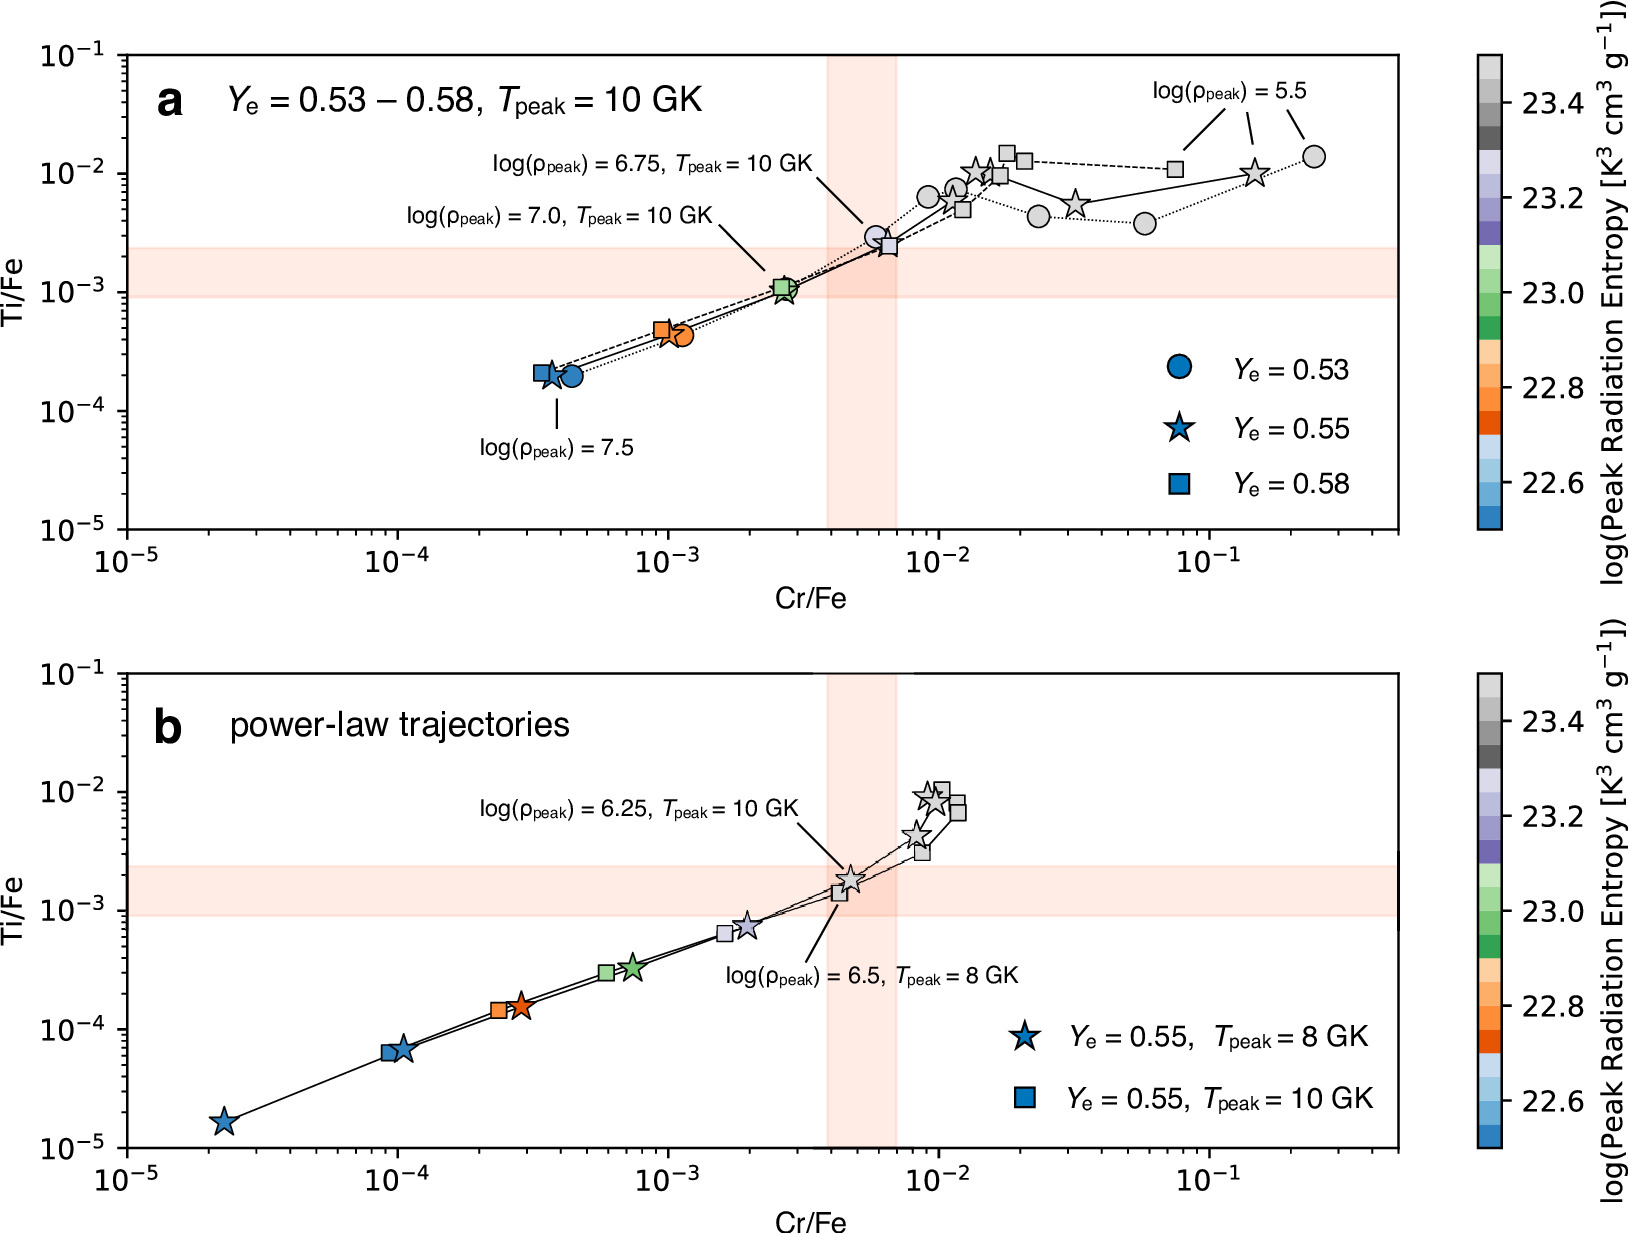
In Extended Data Fig. 6, we show the Ti/Fe and Cr/Fe mass ratios that are calculated with some situations that are not considered in Extended Data Fig. 5. Extended Data Fig. 6a shows the mass ratios calculated with 0.53–0.58 and 10 GK. In multi-dimensional simulations, the lepton fraction in the innermost proton-rich ejecta whose progenitor mass is in 15–20 has a wide range from 0.5 to 0.6\@citex[]2018ApJ…852…40W,2018MNRAS.477.3091V. As shown in Fig. 3b, slightly proton-rich ejecta could not reproduce the observed mass ratios. On the other hand, we found that the proton-rich ejecta with 0.51 can reproduce the observed mass ratios. When the increases to a certain extent, we can no longer use these mass ratios to distinguish the differences (Extended Data Fig. 6a).
The yields of the -rich freezeout are very sensitive to the thermodynamic evolution of the material, especially for intermediate mass elements like Ti and Cr. Therefore, we also investigated nucleosynthetic outputs using different thermodynamic evolution. In Extended Data Fig. 6b, we show the Ti/Fe and Cr/Fe mass ratios produced by power-law thermodynamic trajectories. Here we calculate the evolution of temperature and density using Eq. (5) in Magkotsios et al. (2010)\@citex[]2010ApJS..191…66M. As a result, we found that the yields of intermediate mass elements by the power-law thermodynamic trajectories need more high-entropy to reproduce the observation. Thus, we note that the current estimation of the radiation entropy (i.e. peak temperature and density) has a certain uncertainty. Special thermodynamic evolutions, such as those realized in multidimensional simulations\@citex[]2018ApJ…852…40W,2020ApJ…895…82V, may further alter the synthesis of these intermediate mass elements. That will be our tasks in the future.
The origin of the lighter elements in the iron-rich ejecta. We found X-ray lines not only from the -rich freeze-out products, but also from the intermediate mass elements: IME (e.g., Si, S, Ar, Ca) in the spectrum of the iron-rich ejecta. In our analysis, the region we chose is relatively large to obtain enough photon statistics, which could produce contamination from some ejecta that are not iron-rich. Therefore, if the Ti and Cr we found were not the iron-rich ejecta origin, our conclusion could change. We here confirm that the effect of this contamination is not significant to our conclusion.
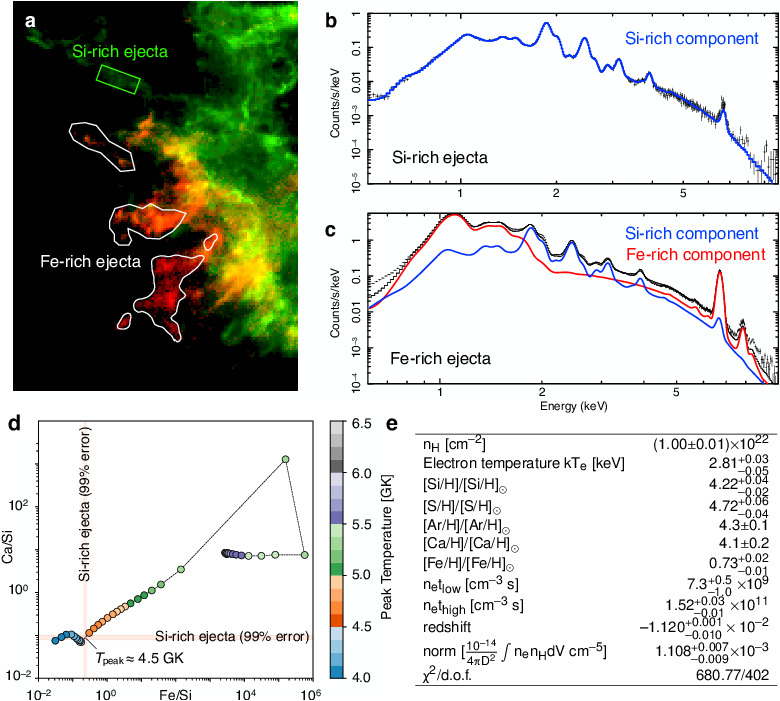
In Extended Data Fig. 8a, we newly defined a Si-rich ejecta region to compare with the iron-rich ejecta. The Si-rich region is adjacent to the iron-rich ejecta. Extended Data Fig. 8b shows the X-ray spectrum extracted from the Si-rich region, which is well explained by a thermal plasma model (phabsvvpshock). The best-fit parameters are summarized in Extended Data Fig. 8e. Using the plasma model, we attempted to model the X-rays from the lighter elements in the iron-rich region (Extended Data Fig. 8c). As a result, we found that the Si-rich region reproduces the IME lines up to Ca, while the lines from Fe-peak elements and continuum are dominanted by the Fe-rich region. Thus, it was confirmed that the lighter elements very likely originate in the contamination from faint Si-rich emissions along the same line of sight.
What is the nucleosynthetic origin for the Si-rich ejecta? The mass fractions among them will answer it. Extended Data Fig. 8d shows a relation between Ca/Si and Fe/Si mass ratios. The observed Ca/Si and Fe/Si mass ratios in the Si-rich ejecta are well consistent with those at 4.5 GK. Therefore, we conclude that the Si-rich ejecta have been reprocessed through the QSE (incomplete Si burning) layer (see Extended Data Fig. 4). Around this peak temperature, a large amount of Ti and Fe can not be produced. This means that the contamination from the Si-rich ejecta to the Ti and Fe emissions in the iron-rich ejecta is negligible. Given that this contamination would not affect the fluxes of the Ti, Cr and Fe lines, the Ti/Fe and Cr/Fe are hardly affected. In fact, we confirmed that the derived ratios of Ti/Fe and Cr/Fe are nearly unchanged even if we subtracted the Si-rich model from the Fe-rich spectrum.
Another strong evidence of -rich freeze out. A strong line feature around 7.8 keV in the spectrum of the iron-rich structure (see Extended Data Fig. 2 bottom, Extended Data Fig. 8 and Extended Data Fig. 10) implies a large abundance of Ni. The stable Ni (= 58Ni and 60Ni) is the second abundant element in the -rich freeze out (Extended Data Fig. 4). The existence of Ni in the iron-rich ejecta strongly supports the -rich freeze-out origin.
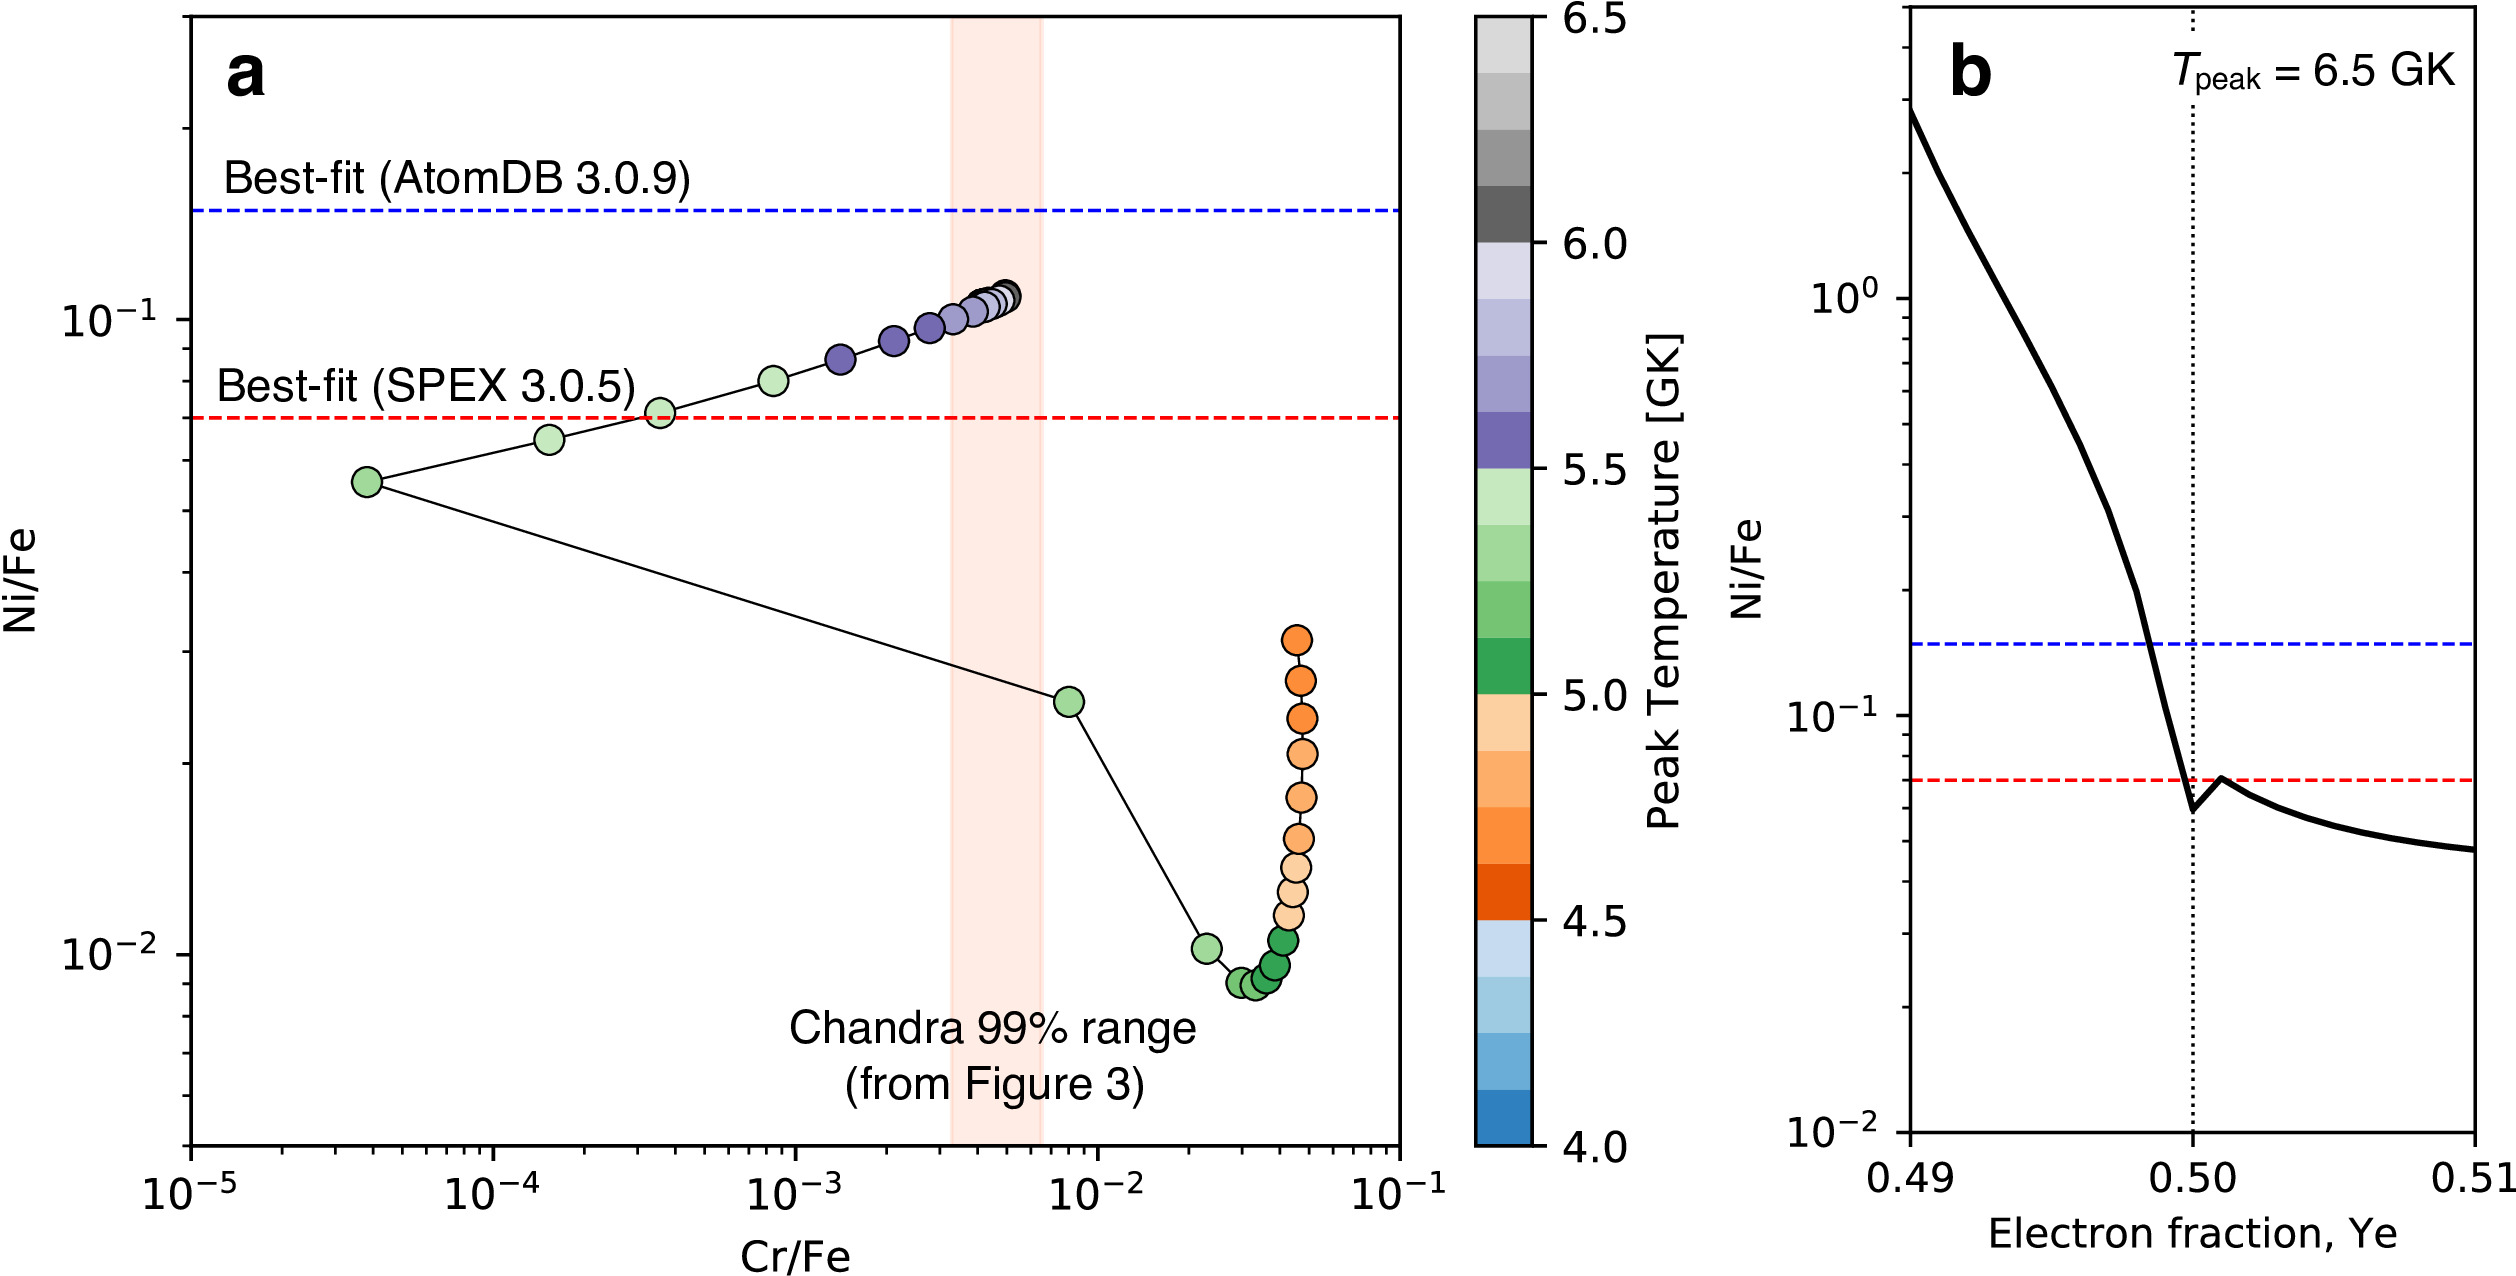
Extended Data Fig. 9 shows a relation between the Ni/Fe and Cr/Fe mass ratios in the CC SN ejecta. We found that the best-fit Ni/Fe mass ratios estimated in the iron-rich ejecta is above a few percent, which can be archived only at high peak temperature above 5.5 GK. On the other hand, we note that there are large uncertainties of the current modelings\@citex[]2017Natur.551..478H. In particular, both the Ni K emissions and Fe K emissions contribute to the 7.8 keV line feature. The emissivities of these emissions vary from atomic code to atomic code, and thus the derived value of Ni/Fe has a large uncertainty (see blue and red broken lines in Extended Data Fig. 9). Further investigations for Ni, taking these uncertainties into account, will be our future works. For example, high X-ray resolution spectroscopy will help us to measure the element abundances accurately even up to such rare metals. Extended Data Fig. 10 bottom shows a comparison of spectra between XRISM and Chandra. As in the figure, we can separate fine structures in the X-ray spectrum in the near future, which will provide us the robust element abundance measurements.
The accurate Ni measurement will help us to estimate the lepton fraction in the ejecta. In proton-rich side, 58,60Ni are the most abundant in stable nickel isotopes (Extended Data Fig. 5b) where the Ni/Fe mass ratio is 10%. In proton-rich side, 60Ni is the most abundant in stable nickel isotopes (Extended Data Fig. 5b) where the Ni/Fe mass ratio is 3–5% (see Extended Data Fig. 5b and Extended Data Fig. 9). In the current spectral fitting, the model in SPEX does a better job of reproducing the spectrum (at least, SPEX does not need the Gaussian line used in Xspec), but still we found some residuals of the fitting. Here, the best-fit Ni/Fe mass ratio with SPEX is 7%, which is almost in between the proton-rich and neutron-rich ejecta (Extended Data Fig. 9b). In addition, the Ni/Fe dependence on is not so sensitive in the proton-rich side (Extended Data Fig. 9b). Therefore, a tight constrain of Ni/Fe beyond the current measurement will be needed to determine the . At least, some updates of the atomic codes and the spectral resolution as done by Hitomi\@citex[]2018PASJ…70…12H will be needed for such a measurement. And, we hope that XRISM will do this (Extended Data Fig. 10 bottom).
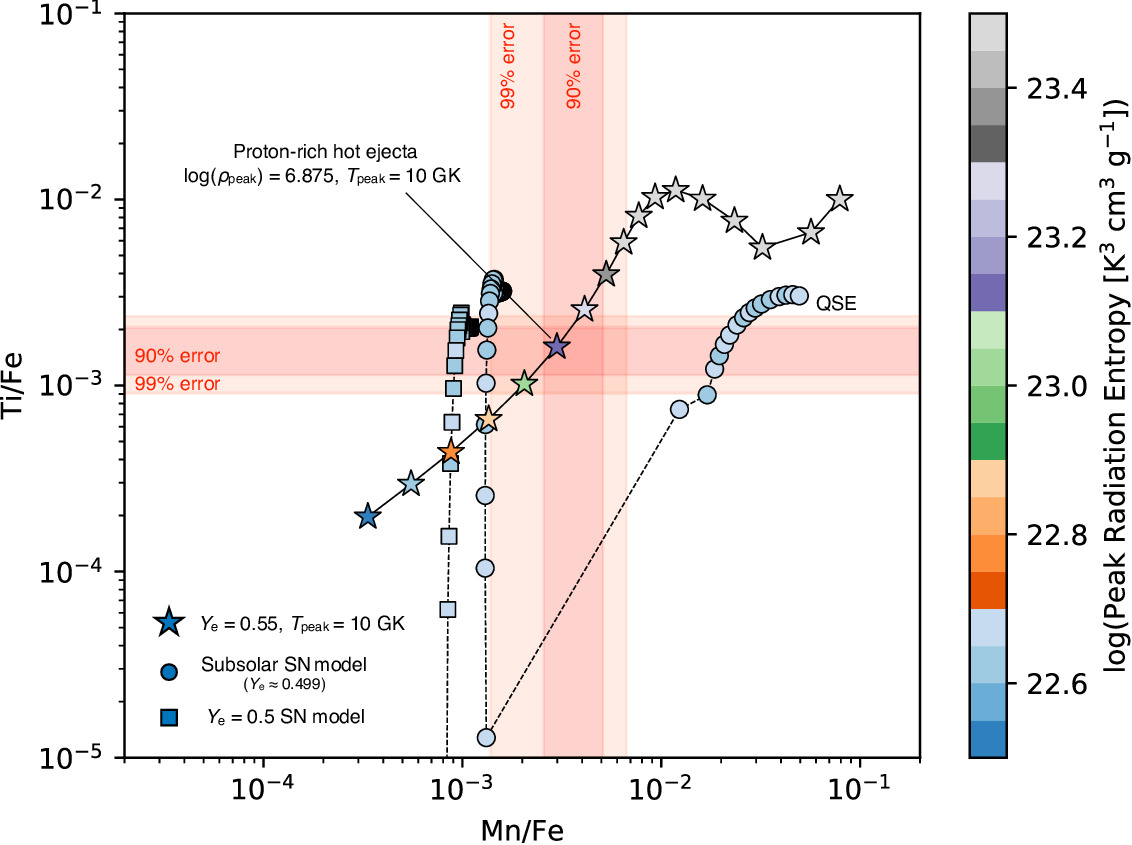
The amount of Manganese in the Fe-rich ejecta. In contrast of the Cr production, the Mn is more effectively produced in the proton-rich side\@citex[]2018ApJ…852…40W. This tendency would help us to discriminate between the proton-rich and neutron-rich ejecta. In Extended Data Fig. 7, we found that the high-entropy proton-rich ejecta could reproduce the observed Mn/Fe ratio very well. On the other hand, the Mn/Fe in the neutron-rich ejecta is out of the observed range. In addition, we needed a modified of 0.5 to reproduce both Ti/Fe and Cr/Fe as shown in the main text (see Fig. 3). This modification (increase of ) suppresses the production of neutron-rich elements like Mn, which provides a further deviation from the observed ratio (see box data in Extended Data Fig. 7). Thus, the high-entropy proton-rich ejecta are more favorable to explain the observation.
We note that the Mn production around the mass cut region is sensitive to -process\@citex[]1990ApJ…356..272W,2008ApJ…672.1043Y. Here, 55Co (= 55Mn) is produced through after the production of 56Ni through complete and incomplete Si burning. The contribution of -process to the Mn production is significant especially in the neutron-rich side because the Mn is rarely synthesized by -rich freezeout with the neutron-rich environment ( 0.5). In the proton-rich side, the -process causes almost no change in the amount of Mn. In -process, the amount of Mn depends on the total neutrino energy in the supernovae. The total energy carried away by the neutrinos is determined by the binding energy released during the formation of a neutron star, where the binding energy () is described as \@citex[]2001ApJ…550..426L. In our calculations, we assumed a total neutrino energy of 31053 erg, which corresponds to the binding energy at a typical NS mass of 1.4 . Even if we assumed a heavy NS with 2 ( 61053 erg), the Mn/Fe mass ratio produced by a SN model with 0.5 is out of the 90% error range of the observation. This still prefers the proton-rich environment for producing the Fe-rich ejecta.
X-ray spectra in other Fe-rich regions. We have investigated X-ray spectra in three Fe-rich regions of Cassiopeia A to search for products by high-entropy burning, where the Fe-rich regions are located at the southeast, north and southwest regions (Extended Data Fig. 10a). We found the spectrum in the north region has a significant Ti line with a confidence level of 3.3 (Extended Data Fig. 1e), but we also found that it has a strong Cr line (Extended Data Fig. 10b). The strong Cr line means that the majority of the ejecta were produced at the incomplete Si burning (QSE) layer (see Fig. 3 and Extended Data Fig. 4). The QSE layer could also produce Ti, so it was difficult to discuss the Ti production at the high-entropy burning using this region. In the case of the southwest region, the non-thermal emissions are significant, which make it difficult to detect the Ti line. Thus, we discussed only the southeast Fe-rich region where we can purely discuss the high-entropy process in the main text.
The Ti underproduction problem in the classical Galactic chemical evolution models. Interestingly, the observed Ti/Fe ratio is consistent with the solar ratio (Fig. 3), whereas the chemical evolution of our Galaxy requires overproduction of Ti for typical CC SNe ([Ti/Fe] 0.4\@citex[]2006ApJ…653.1145K). While the deficiency of titanium in the SN yield may come from atomic data/nuclear reaction rate uncertainty, another possibility is that it could be related to the yet-unknown explosion mechanism on which the present result may shed some light. The high Ti yield exceeding the solar ratio, necessary to reproduce the abundances of the metal-poor stars, may be realized if the hot and high-entropy bubble could significantly contribute the titanium production\@citex[]1999ApJ…511..341N,2020ApJ…895…82V; the Ti/Fe is limited to the solar value for the incomplete (QSE) Si burning regime. It can exceed the solar value significantly for the high entropy bubble (Fig. 3), especially for the higher explosion energy (or higher entropy) and low below 0.5.
To realize [Ti/Fe] 0.4 (Ti/Fe mass ratio 0.45%) in a SN CC, most of the iron-rich ejecta needs to be synthesized in a high-entropy environment. If we assumed the Ti/Fe mass ratios of 10-3 and 10-2 for normal Fe-rich ejecta and extremely high-entropy Fe-rich ejecta, respectively, 40% of the Fe-rich ejecta must be synthesized at the extremely high-entropy enviroment. In addition, such a quite high Ti/Fe mass ratio of 10-2 is hardly achieved with 1D SN calculations (Extended Data Fig. 5). In the three-dimensional simulation of Vance et al. (2020)\@citex[]2020ApJ…895…82V, the hottest ejecta have Ti/Fe 10-2 where the thermodynamic trajectories from the three-dimensional supernova explosion model enhanced the Ti production (although this is radioactive 44Ti). If there is a SN CC whose most of the iron-rich ejecta are synthesized in such an environment, the overabundance of Ti in the early phase might be explained by it. Thus, future multi-dimensional simulations will help us to understand the Galactic chemical evolution, too.
Data availability All the Chandra and NuSTAR data using this research are available from the Chandra Data Archive (CDA: https://cxc.harvard.edu/cda/) and the NuSTAR Archive (https://heasarc.gsfc.nasa.gov/docs/nustar/nustar_archive.html) in raw and reduced formats.
Code availability To analyze X-ray data with Chandra, we used public software, Chandra Interactive Analysis of Observations: CIAO (https://cxc.cfa.harvard.edu/ciao/). We used public atomic data in atomDB (http://www.atomdb.org/) and SPEX (https://www.sron.nl/astrophysics-spex). We fitted the X-ray spectra with a public package, Xspec (https://heasarc.gsfc.nasa.gov/xanadu/xspec/). We have not made publicly available codes for the hydrodynamics and nucleosynthesis of supernova explosions because they are not prepared for the open-use. Instead, the simulated thermodynamic profiles of the supernova explosions and the composition distributions shown in this paper are available on request.
Acknowledgements TS was supported by the Japan Society for the Promotion of Science (JSPS) KAKENHI grant No. JP19K14739, the Special Postdoctoral Researchers Program, and FY 2019 Incentive Research Projects in RIKEN. KM was supported in part by the Grants-in-Aid for the Scientific Research of Japan Society for the Promotion of Science (JSPS, No. JP18H05223 and JP20H00174). SN is partially supported by the Grants-in-Aid for “Scientific Research of JSPS (KAKENHI) (A) 19H00693,” Program of RIKEN for Evolution of Matter in the Universe (r-EMU), and Theoretical and Mathematical Sciences Program of RIKEN (iTHEMS). JPH acknowledges support for X-ray studies of SNRs from NASA grant NNX15AK71G to Rutgers University. TY is supported in part by the Grants-in-Aid for Scientific Research of Innovative Areas (JP20H05249). HU is supported in part by the Grant-in-Aid for Scientific Research (JP17H01130).
Author contributions TS wrote the manuscript with comments from all the authors and analysed the Chandra data. KM, SN, HU, JPH and BJW made significant contributions to the overall science case and manuscript. BG analysed the NuSTAR data and made Fig. 1. TY, HU and MO calculated the nucleosynthesis models.
Author Information The authors declare no competing financial interests. All correspondence should be addressed to TS ([email protected])
References
- [1] Fesen, R. A. An Optical Survey of Outlying Ejecta in Cassiopeia A: Evidence for a Turbulent, Asymmetric Explosion. The Astrophysical Journal Supplement 133, 161–186 (2001).
- [2] Fesen, R. A. et al. The Expansion Asymmetry and Age of the Cassiopeia A Supernova Remnant. The Astrophysical Journal 645, 283–292 (2006). astro-ph/0603371.
- [3] Fesen, R. A. & Milisavljevic, D. An HST Survey of the Highest-velocity Ejecta in Cassiopeia A. The Astrophysical Journal 818, 17 (2016). 1512.05049.
- [4] Thorstensen, J. R., Fesen, R. A. & van den Bergh, S. The Expansion Center and Dynamical Age of the Galactic Supernova Remnant Cassiopeia A. The Astronomical Journal 122, 297–307 (2001). astro-ph/0104188.
- [5] Wheeler, J. C., Maund, J. R. & Couch, S. M. The Shape of Cas A. The Astrophysical Journal 677, 1091–1099 (2008). 0711.3925.
- [6] Vink, J. et al. Detection of the 67.9 and 78.4 keV Lines Associated with the Radioactive Decay of 44Ti in Cassiopeia A. The Astrophysical Journal Letters 560, L79–L82 (2001). astro-ph/0107468.
- [7] Renaud, M. et al. The Signature of 44Ti in Cassiopeia A Revealed by IBIS/ISGRI on INTEGRAL. The Astrophysical Journal Letters 647, L41–L44 (2006). astro-ph/0606736.
- [8] Bollig, R. et al. Self-consistent 3D Supernova Models From -7 Minutes to +7 Seconds: a 1-bethe Explosion of a ~19 Solar-mass Progenitor. arXiv e-prints arXiv:2010.10506 (2020). 2010.10506.
- [9] Hwang, U., Holt, S. S. & Petre, R. Mapping the X-Ray-emitting Ejecta in Cassiopeia A with Chandra. The Astrophysical Journal Letters 537, L119–L122 (2000). astro-ph/0005560.
- [10] Hwang, U. et al. A Million Second Chandra View of Cassiopeia A. The Astrophysical Journal Letters 615, L117–L120 (2004). astro-ph/0409760.
- [11] Herant, M., Benz, W., Hix, W. R., Fryer, C. L. & Colgate, S. A. Inside the Supernova: A Powerful Convective Engine. The Astrophysical Journal 435, 339 (1994). astro-ph/9404024.
- [12] Janka, H. T., Langanke, K., Marek, A., Martínez-Pinedo, G. & Müller, B. Theory of core-collapse supernovae. Physics Reports 442, 38–74 (2007). astro-ph/0612072.
- [13] Burrows, A. & Vartanyan, D. Core-collapse supernova explosion theory. Nature 589, 29–39 (2021). 2009.14157.
- [14] Maeda, K. & Nomoto, K. Bipolar Supernova Explosions: Nucleosynthesis and Implications for Abundances in Extremely Metal-Poor Stars. The Astrophysical Journal 598, 1163–1200 (2003). astro-ph/0304172.
- [15] Orlando, S., Miceli, M., Pumo, M. L. & Bocchino, F. Modeling SNR Cassiopeia A from the Supernova Explosion to its Current Age: The Role of Post-explosion Anisotropies of Ejecta. The Astrophysical Journal 822, 22 (2016). 1603.03690.
- [16] Reed, J. E., Hester, J. J., Fabian, A. C. & Winkler, P. F. The Three-dimensional Structure of the Cassiopeia A Supernova Remnant. I. The Spherical Shell. The Astrophysical Journal 440, 706 (1995).
- [17] Lawrence, S. S. et al. Three-Dimensional Fabry-Perot Imaging Spectroscopy of the Crab Nebula, Cassiopeia A, and Nova GK Persei. The Astronomical Journal 109, 2635 (1995).
- [18] Alarie, A., Bilodeau, A. & Drissen, L. A hyperspectral view of Cassiopeia A. Monthly Notices of the Royal Astronomical Society 441, 2996–3008 (2014).
- [19] Arnett, D., Fryxell, B. & Mueller, E. Instabilities and Nonradial Motion in SN 1987A. The Astrophysical Journal Letters 341, L63 (1989).
- [20] Li, H., McCray, R. & Sunyaev, R. A. Iron, Cobalt, and Nickel in SN 1987A. The Astrophysical Journal 419, 824 (1993).
- [21] Blondin, J. M., Borkowski, K. J. & Reynolds, S. P. Dynamics of Fe Bubbles in Young Supernova Remnants. The Astrophysical Journal 557, 782–791 (2001). astro-ph/0010285.
- [22] Ono, M. et al. Matter Mixing in Aspherical Core-collapse Supernovae: A Search for Possible Conditions for Conveying 56Ni into High Velocity Regions. The Astrophysical Journal 773, 161 (2013). 1306.4258.
- [23] Fryxell, B., Mueller, E. & Arnett, D. Instabilities and Clumping in SN 1987A. I. Early Evolution in Two Dimensions. The Astrophysical Journal 367, 619 (1991).
- [24] Hachisu, I., Matsuda, T., Nomoto, K. & Shigeyama, T. Nonlinear Growth of Rayleigh-Taylor Instabilities and Mixing in SN 1987A. The Astrophysical Journal Letters 358, L57 (1990).
- [25] Mueller, E., Fryxell, B. & Arnett, D. Instability and clumping in SN 1987A. Astronomy & Astrophysics 251, 505 (1991).
- [26] Herant, M. & Benz, W. Hydrodynamical Instabilities and Mixing in SN 1987A: Two-dimensional Simulations of the First 3 Months. The Astrophysical Journal Letters 370, L81 (1991).
- [27] Gabler, M., Wongwathanarat, A. & Janka, H.-T. The infancy of core-collapse supernova remnants. Monthly Notices of the Royal Astronomical Society (2021). 2008.01763.
- [28] Patnaude, D. J., Vink, J., Laming, J. M. & Fesen, R. A. A Decline in the Nonthermal X-ray Emission from Cassiopeia A. The Astrophysical Journal Letters 729, L28 (2011). 1012.0243.
- [29] Patnaude, D. J. & Fesen, R. A. A Comparison of X-Ray and Optical Emission in Cassiopeia A. The Astrophysical Journal 789, 138 (2014). 1403.5812.
- [30] Sato, T. et al. Multi-year X-Ray Variations of Iron-K and Continuum Emissions in the Young Supernova Remnant Cassiopeia A. The Astrophysical Journal 836, 225 (2017). 1701.07905.
- [31] Sato, T. et al. X-Ray Measurements of the Particle Acceleration Properties at Inward Shocks in Cassiopeia A. The Astrophysical Journal 853, 46 (2018). 1710.06992.
- [32] Fruscione, A. et al. CIAO: Chandra’s data analysis system. In Silva, D. R. & Doxsey, R. E. (eds.) Society of Photo-Optical Instrumentation Engineers (SPIE) Conference Series, vol. 6270 of Society of Photo-Optical Instrumentation Engineers (SPIE) Conference Series, 62701V (2006).
- [33] Hwang, U. & Laming, J. M. A Chandra X-Ray Survey of Ejecta in the Cassiopeia A Supernova Remnant. The Astrophysical Journal 746, 130 (2012). 1111.7316.
- [34] Takahashi, K., Yoshida, T., Umeda, H., Sumiyoshi, K. & Yamada, S. Exact and approximate expressions of energy generation rates and their impact on the explosion properties of pair instability supernovae. Monthly Notices of the Royal Astronomical Society 456, 1320–1331 (2016). 1511.03040.
- [35] Takahashi, K., Yoshida, T. & Umeda, H. Stellar Yields of Rotating First Stars. II. Pair-instability Supernovae and Comparison with Observations. The Astrophysical Journal 857, 111 (2018). 1803.06630.
- [36] Takahashi, K., Sumiyoshi, K., Yamada, S., Umeda, H. & Yoshida, T. The Evolution toward Electron Capture Supernovae: The Flame Propagation and the Pre-bounce Electron-Neutrino Radiation. The Astrophysical Journal 871, 153 (2019).
- [37] Yoshida, T. et al. One-, Two-, and Three-dimensional Simulations of Oxygen-shell Burning Just before the Core Collapse of Massive Stars. The Astrophysical Journal 881, 16 (2019). 1903.07811.
- [38] Georgy, C. et al. Grids of stellar models with rotation. III. Models from 0.8 to 120 M⊙ at a metallicity Z = 0.002. Astronomy & Astrophysics 558, A103 (2013). 1308.2914.
- [39] Colella, P. & Woodward, P. R. The Piecewise Parabolic Method (PPM) for Gas-Dynamical Simulations. Journal of Computational Physics 54, 174–201 (1984).
- [40] Umeda, H. & Nomoto, K. Variations in the Abundance Pattern of Extremely Metal-Poor Stars and Nucleosynthesis in Population III Supernovae. The Astrophysical Journal 619, 427–445 (2005). astro-ph/0308029.
- [41] Magkotsios, G. et al. Trends in 44Ti and 56Ni from Core-collapse Supernovae. The Astrophysical Journal Supplement 191, 66–95 (2010). 1009.3175.
- [42] Vartanyan, D., Burrows, A., Radice, D., Skinner, M. A. & Dolence, J. Revival of the fittest: exploding core-collapse supernovae from 12 to 25 M⊙. Monthly Notices of the Royal Astronomical Society 477, 3091–3108 (2018). 1801.08148.
- [43] Hitomi Collaboration et al. Atomic data and spectral modeling constraints from high-resolution X-ray observations of the Perseus cluster with Hitomi. Publications of the Astronomical Society of Japan 70, 12 (2018). 1712.05407.
- [44] Woosley, S. E., Hartmann, D. H., Hoffman, R. D. & Haxton, W. C. The nu -Process. The Astrophysical Journal 356, 272 (1990).
- [45] Yoshida, T., Umeda, H. & Nomoto, K. -Process Nucleosynthesis in Population III Core-Collapse Supernovae. The Astrophysical Journal 672, 1043–1053 (2008). 0710.0251.
- [46] Lattimer, J. M. & Prakash, M. Neutron Star Structure and the Equation of State. The Astrophysical Journal 550, 426–442 (2001). astro-ph/0002232.
- [47] Kobayashi, C., Umeda, H., Nomoto, K., Tominaga, N. & Ohkubo, T. Galactic Chemical Evolution: Carbon through Zinc. The Astrophysical Journal 653, 1145–1171 (2006). astro-ph/0608688.
- [48] Nagataki, S. Influence of Axisymmetrically Deformed Explosions in Type II Supernovae on the Reproduction of the Solar System Abundances. The Astrophysical Journal 511, 341–350 (1999).
- [49] Foster, A. R., Ji, L., Smith, R. K. & Brickhouse, N. S. Updated Atomic Data and Calculations for X-Ray Spectroscopy. The Astrophysical Journal 756, 128 (2012). 1207.0576.
- [50] Kaastra, J. S., Mewe, R. & Nieuwenhuijzen, H. SPEX: a new code for spectral analysis of X & UV spectra. In UV and X-ray Spectroscopy of Astrophysical and Laboratory Plasmas, 411–414 (1996).